

SUMMARY
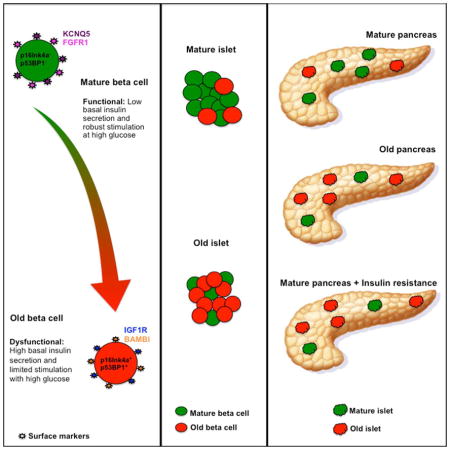
We hypothesized that the known heterogeneity of pancreatic β cells was due to subpopulations of β cells at different stages of their lifecycle with different functional capacities and that further changes occur with metabolic stress and aging. We identified new markers of aging in β cells, including IGF1R. In β cells IGF1R expression correlated with age, dysfunction and with expression of known age markers p16ink4a, p53BP1 and senescence-associated β-galactosidase. The new markers showed striking heterogeneity both within and between islets in both mouse and human pancreas. Acute induction of insulin resistance with an insulin receptor antagonist or chronic ER stress resulted in increased expression of aging markers, providing insight into how metabolic stress might accelerate dysfunction and decline of β cells. These novel findings about β-cell and islet heterogeneity, and how they change with age, open up an entirely new set of questions about the pathogenesis of type 2 diabetes.
Graphical abstract
INTRODUCTION
Reduced β-cell mass and function are fundamental to the pathogenesis of type 2 diabetes (T2D) (Weir and Bonner-Weir, 2013). The loss of β-cell mass is poorly understood but the demands of insulin resistance are presumed to contribute to an accelerated loss of β cells. β-cell function as determined by insulin secretion is also markedly impaired in T2D; this dysfunction is thought to result from β cells being in a diabetic environment and strong evidence indicates that increased plasma glucose levels themselves result in major secretory abnormalities, hence the use of the term glucotoxicity. Type 2 diabetes (T2D) increases with age with the majority of patients being above the fifth decade of life (Koopman et al., 2005).
Proposed mechanisms responsible for the loss of β cells in T2D include amyloid formation (Westermark and Westermark, 2013) and endoplasmic reticulum stress (Kaufman, 2011) but their relative contributions are not known. The pathology of the islets in T2D (Gepts and Lecompte, 1981) seems to provide major clues that should lead to novel ways to examine the problem. For instance, islets in T2D are strikingly heterogeneous: many look completely normal, some contain large deposits of amyloid and others none. To understand how the pathology reached that point, it seems important to understand islet and β-cell heterogeneity and how they change with aging.
It has been known for years that there is considerable β-cell heterogeneity, which has been mostly characterized by differences in secretion (Pipeleers et al., 1994). A variety of different parameters that vary among β cells have been examined in rodents: secretory function (Salomon and Meda, 1986), insulin expression (Katsuta et al., 2012) and telomere length (Guo et al., 2011; Peng et al., 2009). The concept of functional heterogeneity among β cells is bolstered by findings that they differ in sensitivity to glucose (Van Schravendijk et al., 1992) and can be recruited by higher glucose levels into both active biosynthetic (Bosco and Meda, 1991; Kiekens et al., 1992; Schuit et al., 1988) and secretory states when there is demand for more insulin secretion (Hiriart and Ramirez-Medeles, 1991; Hiriart et al., 1995; Karaca et al., 2009; Ling et al., 2006; Pipeleers, 1992).
New insights into heterogeneity have emerged with the recent report of four subtypes of human β cells defined by cell surface markers that are proportionally altered in T2D (Dorrell C, 2016). One subtype found more often in T2D had higher basal insulin release and less response to glucose stimulation. Also, specialized hub cells, identified as 1%–10% of β cells with more active mitochondria and less insulin, have been recently reported to synchronize β cell oscillations (Johnston et al., 2016).
We hypothesized that β cells at each life stage have different markers and functional characteristics and that both age and environmental factors can shift the composition of the β cell population contributing to T2D development (Weir and Bonner-Weir, 2013). There is some understanding of the maturation of newly born β cells and some markers of old (“senescent”) β cells. However, relatively little is known about the aging of β cells and how this influences cellular function and the rate of cell death. Cellular senescence, the phenomenon by which cells cease to divide and remain metabolically active, occurs in response to different forms of stress and aging (Campisi and d’Adda di Fagagna, 2007). A known marker of senescence is p16Ink4a, a cyclin-dependent kinase inhibitor encoded by the Cdkn2a locus. In β cells its level of expression correlated with increased age and decreased proliferation (Krishnamurthy et al., 2006; Krishnamurthy et al., 2004) and yet the marked cells were heterogeneously distributed in adult mouse and human islets (Chen et al., 2009; Dhawan et al., 2009; Kohler et al., 2011; Tschen et al., 2009).
Ways to identify new, young, middle-aged, old, and pre-morbid β cells on tissue sections and with flow cytometry should greatly enhance our understanding of β cells in the pathogenesis of diabetes. In this study we identified and validated markers of β-cell aging and found marked heterogeneity of both islets and β-cells that correlated with age-related functional decline. Moreover, increased secretory demand induced by insulin resistance led to the appearance of aging markers in β cells accompanied by functional changes. These novel findings about β-cell and islet heterogeneity, and how they change with age, open up an entirely new set of questions about the pathogenesis of T2D.
RESULTS
β cell dysfunction during normal aging in mice
Aging of C57Bl/6J mice is accompanied by increased fasting glucose and worsening glucose tolerance (Fig. 1A, B) as well as increased peripheral insulin resistance as reflected by hyperinsulinemia (Fig. 1C), decreased glucose clearance during an insulin tolerance test (Fig. 1D) and increased body weight (Fig 1E). Our data are consistent with that previously published showing these mice, carriers of the Nnt mutation, have glucose intolerance and reduced insulin secretion as early as 6 months (m) of age (Freeman et al., 2006); www.jax.org).
Figure 1. Development of insulin resistance, loss of glucose tolerance and changes of insulin secretion as C57Bl/6J mice age.

Elevation of fasting blood glucose (A), glucose intolerance (B), hyperinsulinemia (C), peripheral insulin resistance as determined by an insulin tolerance test (D) and weight gain (E) were observed in 2y mice compared to 1.5m mice. n=6 for 1.5m; n=11 for 2y; *p<0.05 to 1.5m F. By static incubation, glucose stimulated insulin secretion (GSIS) increased with age. n=3 independent experiments in triplicate, *p<0.01 respect to 12w. G. By RHPA, aged mice had decreased proportion of cells secreting at high glucose, particularly those secreting medium and large plaques (arrows). n= 495–1008 cells counted/condition, 600–700 fields/condition from two independent experiments. Mean±SEM. Table 1 shows the aggregate data and the applicable statistics.
To evaluate the functional changes that accompany aging and insulin resistance in C57Bl/6J mice, we assessed both static glucose-stimulated insulin secretion (GSIS) of isolated islets and the secretion of individual β cells with reverse hemolytic plaque assay (RHPA). Compared to islets from 3m old mice, islets from 1.4 year (y) old mice had increased insulin secretion at 2.6 mM glucose but no further increase at 16.8 mM (Fig. 1F). A similar age-related increase in basal insulin secretion was observed using INK-ATTAC mice, which do not develop glucose intolerance with age (Suppl. Fig. 1A, B and C). With RHPA, the immunoplaque area is directly proportional to the amount of insulin secreted by that cell (Salomon and Meda, 1986)(Suppl. Fig. 2A–D). Using dispersed islets from 1.5m and 1.5y mice, β cells from young mice increased their insulin secretion in response to 16.8 mM glucose 5.5-fold, as reflected by the secretion index (SI) as well as recruitment of non-secreting β cells at 2.6 mM glucose (where only 26% secrete insulin) to 63% secreting cells at 16.8 mM glucose. With age, β-cell recruitment from 2.6 mM to 16.8 mM glucose was lost, and cells secreted more insulin at low glucose concentration with no further increase at high glucose (Table 1). In a cumulative frequency graph (Fig. 1G) in which the average secretion (immunoplaque area) and the percentage of secreting cells at 16.8 mM glucose are plotted, it can be seen, as previously described (Aguayo-Mazzucato et al., 2011; Aguayo-Mazzucato et al., 2006) that β-cell function is heterogeneous with several functional subpopulations that secrete varying amounts of insulin in response to a given stimulus. Interestingly, with aging (1.5y) these subpopulations changed, with many fewer β cells responsive to glucose (Fig. 1G, Table 1).
Table 1.
RHPA secretion summary from β cells obtained from different aged C57Bl/6 mice
| 2.6 mM glucose | 16.8 mM glucose | |||||
|---|---|---|---|---|---|---|
| Area (um2) | % secreting cells | Secretion Index (Area × %) | Area (um2) | % secreting cells | Secretion Index (Area × %) | |
| 1.5m | 1246 ± 30+ | 26 ± 8+ | 312 ± 8+ | 1704 ± 45 | 63 ± 1 | 1074 ± 29 |
| 1.5y | 1712 ±42*+ | 30 ± 3 | 513 ± 12*+ | 1246 ± 31* | 26 ± 4* | 312 ± 8* |
p<0.0001 respect to 1.5m
p<0.0001 respect to 16.8 mM glucose
n= 495–1008 cells counted/condition, from 600–700 fields/condition; from two independent experiments.
β-cell heterogeneity as mice age
Using C57Bl/6J MIP:GFP mice in which GFP expression is driven by the insulin promoter, we previously reported changing populations of β cells from perinatal to 7m age based on GFP brightness, cell size and granularity (Katsuta et al., 2012). Three subpopulations of pancreatic cells were identified and sorted according to GFP fluorescence levels. The proportions of these subpopulations changed markedly with age: the GFP low subpopulation was large in young animals and decreased greatly by 4m whereas the GFPhigh subpopulation was very small in the youngest mice and markedly increased by 4m (Fig. 2A). These results suggest that GFPlow cells may represent a younger, more newly-formed β cell subpopulation while the GFPmedium and GFPhigh subpopulations were older and consisted of both mature and senescent cells. To assess this, we sorted GFP+ β cells from young (e15.5- 5w), 2.5–7.5m and 1–2y MIP:GFP mice for gene expression by qPCR. Expression of the β-cell senescence marker Cdkn2a (p16Ink4a) mRNA was not detected in any population of the young animals but increased with age in the GFPhigh and GFPmedium subpopulations (Fig. 2B); only at 1–2y was it detectable in the GFPlow population. These data suggest simultaneous existence of differently aged subpopulations.
Figure 2. Heterogeneity patterns of β cells change with age as seen with FACS analysis of GFP+ cells and measurement of aging markers.

Subpopulations of β-cells based on GFP intensity change with age (A) and have increasing expression of p16Ink4a with age (B), supporting the notion of aging heterogeneity. 5–9w:n=3; 4–10m: 7; 1–2y:8; *p<0.04 to previous stage; +p<0.04 to 5–9w. For p16Ink4a: e15.5-5w:n=7;2.5–7.5m:3;1.5–2y:3. ANOVA < 0.0001; *p<0.0001 to youngest group. ND, not detected. Mean±SEM C. Heatmaps of expression data from microarrays of β cells of MIP:GFP mice showing changes in key β cell and senescence signature genes (see Suppl Fig 3). D. Volcano plot of differentially expressed cell surface genes (see Suppl Table 1). E. Expression of Igf1r mRNA increased in GFP high/medium cells at 1.5- 2y. Same samples as for p16ink4a (F) Potential aging surface markers verified by qPCR on isolated islets: p16Ink4a, Igf1r, Bambi, Kcnq5, and Fgfr1. Samples were from individual mice; n=10–18 per age; *p<0.05 to previous age. Mean±SEM
Age dependent changes in β cell gene expression represent both a maturation and an aging process
We performed Affymetrix microarrays (n=3–4 per age) on RNA from FACS-purified MIP:GFP β cells from different aged mice: 1) 3.5–9w Young; 2) 1y-old; 3) 2y-old. Analysis revealed age-related differential gene expression, with the greatest changes in expressed probe sets between young and 1y (p< 0.05) but with further changes between 1 and 2y (Fig. 2C; Suppl Fig. 3). These changes show both the processes of maturation (less than 9 w old vs older) and of aging (1y vs 2 y). The expression of p16Ink4a and the senescent signature genes in β cells from aged MIP-GFP mice supports our expectation that islets from older mice are enriched with senescent β cells.
Identification of cell surface markers of aged β cells
Surface markers that allow identification and isolation of aged β cells could be a powerful tool to study the different β-cell populations. Mining our microarray data for differential expression of plasma membrane genes (Fig. 2D and Supplementary table 1), we selected potential markers of β-cell age for evaluation, including Kcnq5 and Fgfr1, which seemed higher in young mice, and Igf1r, CD99 and Bambi higher in old mice (p value and FDR <0.05). Similar to what we found for p16Ink4a mRNA (Fig. 2B), Igf1r mRNA levels were increased in the GFPhigh and GFPmedium subpopulations of β cells from oldest animals compared to those of younger (Fig. 2E). To validate these candidate genes as aging markers, we measured their expression in independent samples of islets using expression of p16Ink4a as a benchmark for aging. With increasing age p16ink4a, Igf1r and Bambi mRNA increased whereas Kcnq5 and Fgfr1 decreased and CD99 was unchanged (Fig 2F, Suppl. Fig. 4). Taken together, phenotypically different β-cell subpopulations are present at the different ages.
Heterogeneity of aging markers in β cells
To extend our results to the protein level, paraffin sections were stained and analyzed in parallel such that differences in staining intensities reflect differences in protein. There was marked heterogeneity between islets and between the cells within an islet. IGF-1R showed enhanced staining in islets of 6.5m and 1.5y mice (Fig. 3A, B), whereas consistent with it being a marker of younger β cells, KCNQ5 protein was expressed at higher levels at 2m than at older ages (Fig. 3A,C). Intensity of insulin staining showed marked variability at each age with a decrease in the 1.5y group (Fig. 3D). The membrane location of IGF1R and KCNQ5 was confirmed with costaining with E-Cadherin (Suppl. Fig. 5). Using the INKATTAC model, costaining of IGF1R and the reporter of p16 expression FLAG was seen in a subset of β cells in 4–6 month old mice (Suppl. Fig. 1F). Importantly, age dependent increases in IGF-1R immunostaining intensity were seen in human islets (Fig. 3F, Suppl. Fig. 6A). Notably, no staining of IGF-1R was found in fetal islets (19–22w gestation).
Figure 3. Islet heterogeneity for markers of aging in mouse and human pancreas.

A. By immunostaining increased IGF1R and decreased KCNQ5 was found in islets from older mice compared to young. Magnification bar= 25 μm Intensity of individual islet staining quantified for IGF-1R (B), KCNQ5 (C) and Insulin (D). n=3 animals per age. *p<0.05 respect to previous age. E. Age dependent IGF-1R expression in human islets supports the validity of this marker. Pancreas from 2 donors per decade (aged fetal to 68 y); 15–92 islets/cell clusters per donor; total 400 human islets. Quantification given in Suppl Fig 6A. Magnification bar= 25 μm F. FACS plot showing sorting by IGF1R for β cells. G. Percentage of IGF1R+ β cells per age. n=7 independent cell preparations. H. IGF1R+ β cells express higher p16Ink4a, Ldha and Flattop mRNA as compared to unsorted. n=5 samples, each pooled from 3–7 1.5–2y mice. #p<0.05. I. GSIS profiles comparing IGF1R- and IGF1R+ subpopulations from 4 independent cell preparations of 4 m mice. J. Knockdown experiments in MIN6 cells transfected with p16Ink4a, Igf1r or scrambled siRNA (siSc) show p16ink4a affects Igf1r expression. n=3 independent experiments in triplicate. Mean±SEM
β cells expressing IGF-1R are senescent and have dysfunctional secretion
To evaluate potential functional differences between β cells expressing IGF-1R and those that do not, we used FACS to sort IGF-1Rpositive and negative populations (Fig. 3F) The percentage of IGF-1Rpositive increased as the age of the animal increased (Fig. 3G). By qPCR p16Ink4a mRNA levels were 50-fold higher in IGF-1Rpositive cells than in either IGF-1Rnegative or unsorted subpopulations (Fig. 3H); both Ldha and Flattop were also higher in IGF-1Rpositive cells. Functionally, IGF-1Rpositive cells secreted less insulin at 16.8 mM glucose than IGF-1Rnegative cells even when from 4 m old mice (Fig. 3I and Suppl. Fig. 7C), much as seen in older β cells (Fig. 1G, Table 1).
Given the expression of p16Ink4a in IGF-1Rpositive cells, we knocked down the expression of each in the β cell line MIN6 to test for possible interaction (Fig 3J). When siP16Ink4a was used, Igf1r mRNA was decreased. However, the knockdown of Igf1r had no effect on p16 mRNA levels. These data suggest that p16Ink4a expression may lead to IGF1R expression, supporting the notion that IGF1R truly marks senescent β cells.
Aging heterogeneity within β cells
To further examine the simultaneous presence of differentially aged β cells at any given time, we tested two known senescence markers. First, using nuclear localization of p53BP1 protein (Campisi and d’Adda di Fagagna, 2007; Tornovsky-Babeay et al., 2014), we found as mice aged β cells increased p53BP1 protein (Fig. 4A), with 50% β cells costaining for IGF-1R and p53BP1 at 6.5m increasing to 100% at 2y (Fig. 4B), a further validation of IGF1R as a β-cell aging marker. Then to correlate the GFP subpopulations identified by FACS (Fig. 2) with these aging markers, pancreatic sections of MIP-GFP mice at different ages were stained for GFP, P53BP1, and IGF1R (Fig. 4C and Suppl. Fig. 7A, B). In 6m old mice, most, if not all, β (insulin+) cells expressed GFP but showed heterogeneous expression when the antibody concentration was not saturated. With age there was an increased proportion of GFPlow insulin + cells. These GFPlow β cells tended to have nuclear p53BP1+ β cells and high IGF1R, suggesting that in old animals GFPlow β cells included a senescent subpopulation.
Figure 4. Senescent β cells increase in proportion through adulthood.

A. Representative images for the senescence marker nuclear P53BP1 in β cells across ages. Magnification bar= 25 μm B. Cellular co-localization of IGF1R and p53BP1 increased with age. C. Representative images of adjacent sections of islet from 1y MIP:GFP mouse costained for GFP, Insulin, and glucagon/somatostatin/pancreatic polypeptide or for GFP, p53BP1 and DAPI showing p53BP1+ cells are mostly GFPlowinsulin+. Magnification bar= 30 μm D. FACS plot showing sorting criteria for β cells stained for acidic β-Galactosidase (B-Gal) activity. E. Proportion of B-Gal positive β cells increased with age. n=5 independent preparations, each pooled of 3–5 mice. F. B-Gal positive and negative subpopulations from mature (3–6 m, n=3) and aged (1.8–2y,n=4) mice show higher Igf1r and p16Ink4a mRNA levels in B-Gal+ cells at both ages. Data normalized to negative cells. #p<0.05. Mean±SEM
Second, we used senescence-associated acidic β–galactosidase activity to identify and isolate senescent β cells. FACS sorting (Fig. 4D) showed the activity a continuum with the active supopulation in 6m smaller than in the 1.5y mice (Fig. 4E). Nonetheless, B-Gal positive β cells from both ages had increased expression of both Igf1r and p16Ink4a mRNA compared to the negative β cells from the same animals (Fig. 4F).
Aging heterogeneity between islets
Heterogeneity of aging marker among β cells within an islet was greatest in the 6–9 m mice. What was surprising was the heterogeneity between islets: within the same section, adjacent islets could be positive or negative for IGF1R, CD99 or KCNQ5 (Fig. 5A–D). To better characterize this heterogeneity between individual islets, we characterized single islets handpicked for similar size (150 um diameter) from 1.5 y old mice. Even though these single islets had insulin content varying by less than 10% (Fig. 5E), their Igf1r and Kcnq5 mRNA levels varied 800% (Fig. 5F,G). This finding indicates that β cells of differentially aged islets can maintain their insulin stores.
Figure 5. Islet heterogeneity at both protein and mRNA levels.

Adjacent islets showed heterogeneous staining of aging markers CD99 and IGF1R (A–C, merged and split channels) and KCNQ5 (D) indicating islet heterogeneity in adult pancreas. Magnification bar=50 μm. Heterogeneity of islets was further supported by similar insulin content (E) and marked differences in single islet mRNA content for Igf1r (F) and Kcnq5 (G). Handpicked 150 μM diameter islets: for RNA, 8 islets from same 1.5y mouse; for insulin content, 12 islets, 4 from each of 3 1.5y mice. Individual islet values shown.
Acceleration of the appearance of aging markers in β cells by insulin resistance
To evaluate whether metabolic stress could induce cellular aging independent of chronological age, 7m C57Bl/6J mice were treated for a week with insulin receptor antagonist S961 and as previously described (Yi et al., 2013) showed hyperglycemia and hyperinsulinemia (Fig. 6A,B). Islets from S961-treated mice had significantly increased p16Ink4a and Bambi mRNA levels (Fig. 6C) and Igf-1r mRNA had a tendency to increase. With only 1 week of treatment and 2 weeks recovery, these changes reversed. Then using a model of chronic ER stress, Ins2Akita(Akita) mice (20 wk old heterozygotes), we found Igf1r mRNA increased and both p16Ink4a and Bambi mRNA tended to increase in isolated islets compared to wildtype controls (Fig. 6D). Together these results indicate that the appearance of aging markers in β cells can be induced by metabolic stress.
Figure 6. Acceleration of the appearance of aging markers in β cells by insulin resistance and metabolic stress.

In 7m C57Bl/6J mice, 7 d of S961 administration induced hyperglycemia (A) and hyperinsulinemia (B), which were reversed by 2 w recovery period. C. Islets of these mice had increased expression of p16Ink4a, Igf1r and Bambi mRNA that reversed in 2w recovery period. Data related to control values. n= 4–12mice / group;# *p<0.01 D. In islets from Ins2Akita(Akita) mice, a model of ER stress, Igf1r mRNA increased and both p16Ink4a and Bambi mRNA tended to increase, compared to wildtype (WT). n=4 mice/group *p< .005. Islets from INK-ATTAC mice show heterogeneity of both GFP and FLAG protein at 10 m (E) as well as age-related changes in Igf1r and Kcnq5 mRNA (F). n=4 mice/age. *p<0.02 Magnification bar=40 μm. Mean±SEM
Yet, hyperglycemia or glucose toxicity was not solely responsible for the appearance of the aging marker IGF-1R. We examined INK-ATTAC mice in which a fragment of the p16Ink4a gene promoter that is transcriptionally active in senescent but not in non-senescent cells drives both GFP reporter and Flag-tagged protein products allowing the identification of senescent cells within a heterogeneous population (Baker et al., 2016; Baker et al., 2008; Baker et al., 2011). These mice remain glucose tolerant even at 1 y (Suppl Fig. 1A,B). In insulin secretion studies islets from old (1.7–2y) showed increased basal insulin release with equal stimulated release compared to islets from 4m old (Suppl Fig. 1C). Even so at 10 m there was heterogeneity of both GFP and FLAG (Fig. 6E) expression as well as age-related changes in Igf1r and Kcnq5 mRNA and protein (Fig. 6F)(Suppl Fig. 1D–E). Moreover, costaining of IGF1R and FLAG in a subset of β cells could be identified in pancreas from 4–6 m mice. Thus, aging itself is responsible for the changing phenotype but metabolic stress, whether insulin resistance or chronic ER stress, can accelerate the aging process.
Increased IGF1R and P53BP1 in human β cells in T2D
To extend our findings to human, we first examined our previously published microarray data on laser capture microdissected β cells from 10 T2D and 10 age-matched non-diabetic controls (Marselli et al., 2010). IGF1R mRNA was significantly higher (p= 0.007) in β cells from T2D than from controls. Using an in silico approach on recently published papers, IGF1R mRNA was significantly correlated with HbA1c in the Fadista (Fadista et al., 2014) PNAS study on islets from 89 human donors. Bambi was significantly upregulated in β cells from patients with T2D when compared with non-diabetic donors (Segerstolpe et al., 2016; Xin et al., 2016). In our own work, we found consistently greater immunostaining intensity of IGF1R in β cells in sections from 3 T2D than from age-matched non-diabetic controls (Suppl Fig. 6B). In a panel of nPOD samples of T2D and age matched controls, most donors by age 20 had considerable number of β cells expressing nuclear p53BP1 without differences in the number of negative cells (Fig. 6C,D); with age the percentage of high intensity nuclei increased (Fig 6E). While it seems that obesity and diabetes are associated with increased proportion of high intensity P53BP1 staining, the great variability among human donors will necessitate a far larger study with groups of similar age and BMI.
DISCUSSION
In the present study we have identified new age markers of β cells. As expected there was considerable heterogeneity among individual β cells in the expression of these markers, but very surprisingly there were also remarkable differences among islets. Additionally, we found that the aging process can be accelerated by increased insulin demand. We conclude that the varying age of the individual β cells could be the basis for their heterogeneity.
β cells are known to have slow turnover and a relatively long lifespan (rodents 2–3m) (Finegood et al., 1995), but this low rate of growth is sufficient to allow sustained β-cell mass expansion over the first 7 months in rats (Montanya et al., 2000). There are several mechanisms, such as proliferation, hypertrophy, and neogenesis (Bonner-Weir, 2000) that increase β-cell mass to meet the secretory demand as well as adaptations that increase the function of individual β cells (Liu et al., 2000). Since the β-cell population is dynamic, there must be the simultaneous presence of young, adult, senescent and dying β cells at any adult age (Weir and Bonner-Weir, 2013). These differing populations may have different functional characteristics that impact overall glucose homeostasis. One of the characteristics of functional immaturity is high insulin secretion at low glucose levels as well as diminished ability of the β cell to increase insulin secretion in response to high glucose levels (Blum et al., 2012). Intriguingly Flattop, the newly identified marker of mature β cells, was not expressed in 20% β cells of adult mice (Bader E, 2016), the same percentage of rodent adult β cells reported to be non-responsive to glucose (Salomon and Meda, 1986; Van Schravendijk et al., 1992).
As shown in the present study C57Bl/6J mice age, impaired glucose tolerance develops as well as changes in β-cell function. These functional changes are characterized by an increase in basal insulin secretion, impaired glucose-stimulated insulin secretion, along with functional loss of subpopulations of cells that respond to high glucose concentrations. This age-related change in function was accompanied by an increase in p16Ink4a, a known marker of β-cell aging and by a new marker of β-cell aging found in this study, Igf1r. By immunostaining, islets that expressed IGF1R had higher expression of p53BP1. When these presumed older cells expressing IGF1R were selected by flow cytometry, their insulin secretory response to high glucose levels was impaired, suggesting that aged β cells are dysfunctional compared to their younger (IGF-1R negative) counterparts from the same mice. It is also worth mentioning that the IGF-1R positive subpopulation was particularly vulnerable to combined stress of dispersion and FACS, such that a 17 % of the population appeared to die selectively in response to the procedure. From our microarray analysis, the apoptosis pathway and p53 signaling pathway were ranked 7 and 3 respectively when comparing beta cells isolated from 2 year old mice with those obtained from young or 1 year old mice. These results support the idea that older beta cells are more fragile and therefore more likely to die in response to a variety of insults or stimuli.
Further support of IGF1R as an aging marker comes from our siRNA experiments that indicate that p16Ink4a expression may lead to IGF1R expression. Using another well recognized marker of senescent cells, β-galactosidase activity to FACS sort subpopulations, we found that the proportion of β-GALpositive β cells increased from 6 m to 1.5 y and at both ages, the positive cells had higher Igf1r and p16 mRNA expression than the negative cells from the same animals.
Our findings are in contrast with a recent study in which induction of p16Ink4a for 10 days in β cells of 3–4 week old transgenic mice resulted in both markers of senescence and increased function of β cells (Helman et al., 2016), leading to their conclusion of a novel functional benefit of senescence in β cells. However, the β cells of 5–6 week old mice are not yet fully mature; islets from 3 wk old rats are glucose responsive but without the robustness of a 2–3 month rat (Bliss and Sharp, 1992). Another study on epigenome changes in β cells from adolescent (4–6w) and old (16–20m) also found age-related changes in function and increased Igf1r mRNA in old β cells but without significant changes in Cdkn2a (p16ink4a) (Avrahami et al., 2015). They concluded that the left shift in glucose sensitivity in old mice (46.2 % of old β cells vs 13.3 % of young responding to 5mM glucose) indicated improved function of old β cells. However, it may be that the perceived increased sensitivity of the “old” cells was due to their being compared to a population of immature cells.
With these newly identified markers coupled with known markers of cell senescence p16Ink4a, p53BP1 and acidic β-galactosidase, we have shown the presence of subpopulations of differentially aged β cells at any given time in adult mice. These markers accumulated as the age of the mice increased, and this was similarly found for β cells in human pancreases. This is not unexpected given that the replicative capacity of β cells decreases with age both in rodents (Scaglia et al., 1997) and humans (Gregg et al., 2012; Kushner, 2013), which likely results in the overall population being older and having more senescent cells. Even so, the high frequency of nuclear p53BP1 in islets of humans even as young as 20 was surprising. Moreover, this change in proliferative capacity of murine β cells fits nicely with our microarray results in which we saw the greatest changes in gene expression between β cells isolated from young and 1y mice. The changes between β cells from 1 and 2y mice were less pronounced and may reflect the increasing accumulation of senescent cells.
The heterogeneity seen in expression of the markers within individual islets as well as among islets within the same pancreas was striking. The finding of β-cell heterogeneity was not unexpected since various aspects of heterogeneity have been previously demonstrated (Pipeleers et al., 1994); in the present study, secretory heterogeneity was again seen, and it was clear that both newly identified and known aging markers are present only in some cells.
We conclude that the varying cellular age of the β cells may be one factor for the basis for their heterogeneity. Heterogeneity of β cells may be influenced by other factors; some of the functional and gene expression changes are reminiscent of immature or dedifferentiated β cells. β cell dedifferentiation has many meanings in the field. We have previously reported (Jonas et al., 1999; Weir et al., 2013) that hyperglycemia can lead to a change in β cell phenotype and function, often called glucotoxicity. Here we see many changes occurring with age in both the glucose-intolerant C57Bl/6J and the normoglycemic INKATTAC mice, such that these changes are unlikely to be dependent on glycemic levels. One could consider both the immature and the senescent β cell as dedifferentiated as compared to the archetypical mature β cells, but our interpretation is that β cells at different life stages do not have identical phenotypes. Recently, a subpopulation of β cells (1–10%) called “hub” cells were identified in young adult mice; they were highly metabolic but with many characteristics of immature β cells (Johnston et al., 2016). While in the young MIP:GFP mice, GFPlow β cells may be immature, in older mice most of the GFPlow β cells are likely rather to be senescent as seen by their preponderance of being nuclear p53BP1+ β cells. This is clearly supported by our microarray analysis of β cells obtained from young mice that are still undergoing maturation, and a subsequent aging population that accumulates. Even though some changes might seem similar between the immature and the senescent cells that could point to dedifferentiation (Mafb, Ins1, NeuroD, Nkx6.1 and Glut2), the overall gene expression profile is very different between these two groups as shown by other β cell hallmark genes (Pdx1, Ins2, Pcsk1) as well as by the cellular senescence gene set. These data support the presence of different phenotypes at different life stages of a β cell.
The heterogeneity of islets was very surprising. We have long known that there are a variety of histological differences among islets in normal and T2D pancreases, however here we found marked differences in islets with both immunostaining of pancreatic sections and gene expression measurements of individual islets. It is tempting to attribute these differences to variations in the age of these islets; however, there could be other possibilities, including the concept that gene and protein expression in all β cells of a particular islet might change in a coordinated way over time. Perhaps there are islets in humans that are temporarily functionally active or inactive, as has been described in rats in a provocative study (Olsson and Carlsson, 2011) suggesting that under normal conditions, up to 25% of pancreatic islets were functionally dormant, but that these “sleeping” islets could be activated in response to demand for more insulin secretion.
Our new markers of aging were selected without regard to their possible function to identify the differently aged subpopulations of β cells within a pancreas. Yet, the markers of age identified in this study may be involved in the mechanisms related to the age-associated functional decline of β cells. IGF1R is of particular interest since the insulin/IGF-1 signaling pathway has a major influence on lifespan across species (Barbieri et al., 2003). Having multiple markers is important to provide a “senescent β-cell signature” since senescence is seen not as a static endpoint but a multi-step evolving process (van Deursen, 2014).
Our findings that aging and the development of diabetes are associated with the appearance of markers for aging in β cells fit with generally held concepts. In an acute insulin resistance model induced by the insulin receptor antagonist S961, the development of both hyperglycemia and hyperinsulinemia after 7 d of treatment coincided with increased islet expression of the aging markers. Similar increases in the aging markers were seen in both 5m old diabetic Akita mice and aging or diabetic human pancreases. Importantly, these data show that the increased metabolic stress of insulin resistance resulted in accelerated aging of β cells, thus providing insights as to how increases in β-cell apoptosis might be occurring before glucose levels start to rise during progression to diabetes. This fits well with the finding that the state of impaired fasting glucose is associated with a 40% reduction in β-cell mass (Butler et al., 2003). A related important question is whether old β cells have less insulin secretory capacity than younger β cells; our findings provide support for this concept.
In summary, the present study has identified new markers of aging in β cells, whose pattern of expression suggests that the varying lifecycle stage of the β cells is the basis for their heterogeneity. Additionally we found that the expression of these and other markers can be accelerated by metabolic stress. This finding provides insight into how insulin resistance might accelerate the decline of β cells. In addition, striking heterogeneity among islets was found, which opens up new ways to think about islet biology and the pathogenesis of T2D.
STAR METHODS TEXT
CONTACT FOR REAGENT AND RESOURCE SHARING
Further information and requests for resources and reagents should be directed to and will be fulfilled by the Lead Contact, Dr. Susan Bonner-Weir (susan.bonner-weir@joslin.harvard.edu). Requests to use INK-ATTAC mice should be directed to Dr. Jan van Deursen (vanDeursen.Jan@mayo.edu).
EXPERIMENTAL MODELS AND SUBJECT DETAILS
Mice
All experiments were conducted at Joslin Diabetes Center with approval of its Animal Care and Use Committee; mice were kept on a 12-h light/12-h dark cycle with water and food ad libitum. Both male and female mice were used except when noted, and the age of the mice is specified for each experiment. All mice (wildtype, MIP:GFP and INK-ATTAC) were from our colonies: mouse insulin promoter:GFP (MIP-GFP) mice (Hara et al., 2003) were bred onto C57Bl/6J background (Katsuta et al., 2012); breeding pairs of INK-ATTAC mice(C57Bl/6) were the gift of Dr. Jan van Deursen (Baker et al., 2011). C57Bl/6J were from Jackson Labs.
Human tissue
Pancreases from adult brain-dead donors were obtained by the Harvard/Joslin Islet Resource Center; a small piece for quality control assessment was fixed in 4% PFA overnight and embedded in paraffin; additional sections from these blocks were used for this study. Cases were selected to represent different age decades from available tissues. Additional sections of type 2 diabetes and age-matched control donors were obtained from nPOD. Anonymously donated 18–20 wk old fetal pancreas (Advanced Biosciences Resources, Inc) were fixed for 2 hours in 4% PFA for paraffin embedding. All tissues were consented for research and had IRB exempt status (Joslin Diabetes Center IRB). Details of donors are given in Key Resources Table.
Cell lines
For transfection experiments murine beta cell line MIN6 cells were used and maintained in high-glucose Dulbecco’s modified Eagle’s medium (DMEM-H) supplemented with 15% FBS and 0.05% β-Mercaptoethanol (99% Cell culture tested). These were originally received from Dr. Jun-ichi Miyazaki, Osaka University Medical School.
METHOD DETAILS
Assessment of glucose homeostasis in animals
Body weight and morning fed glucose levels were monitored longitudinally. Blood glucose values were measured using One-Touch glucometer (LifeScan, Milpitas, CA) on blood from tail snip. For intraperitoneal glucose tolerance tests, blood samples from mice fasted overnight (15 h) were collected at 0, 15, 30, 60, 90, and 120 min after an intraperitoneal injection of glucose (2 g/kg body weight). For insulin tolerance tests, mice were fasted for 4 h, insulin (Humulin R; Eli Lilly, Indianapolis, IN; 0.75 units/kg body weight) injected intraperitoneally, and blood glucose measured at 0, 15, 30, and 60 min.
Pancreas was excised under anesthesia and either fixed in 4% (para)-formaldehyde (PFA) 2h and embedded in paraffin for histology or islets were isolated by collagenase digestion (Gotoh et al., 1987) for 17–18 minutes, followed by a Ficoll gradient and handpicked for RNA or secretion. Between steps, islets were washed with M199 + 10% NCS. Insulin was measured with a mouse insulin ELISA kit (ALPCO, Salem, NH).
FACS
Isolated islets were dispersed in a solution of 1 mg/ml trypsin (Sigma, St. Louis, MO) and 30 μg/ml DNAse (Roche, Mannheim, Germany) and were resuspended in FACS buffer (2% fetal bovine serum (FBS) (Cellgro, Manassas, VA) in PBS). Using a DakoCytomation MoFlo Cytometer (Dako, Ft. Collins, CO), cells were gated according to forward scatter and then sorted as β cells on the basis of higher endogenous fluorescence as shown in Suppl. Fig. 2G (King et al., 2007). Propidium iodide was used to exclude dead cells. For sorting based on surface markers, previous to cell sorting, cells were incubated for 1 hour at 4°C first in blocking solution (normal goat serum in FACS buffer), then with primary antibody (Key Resources Table), followed by 30 minutes at 4°C in secondary antibody. Sorted cells were collected in FACS buffer and resuspended in culture media (RPMI 10% FBS, 1% Pen/Strep) for attachment and secretion studies or in 100 μl RNA extraction buffer and stored at −80°C. For sorting based on acidic β-galactosidase activity, a fluorescent substrate was used (Enzo Life Sciences enz-kit 130-0010): dispersed islet cells were pretreated with 2 mL of 1× cell pretreatment solution and incubated at 37°C for 2 hrs. 10 uL of 200× SA-beta-Gal substrate solution were added to cells in the pretreatment solution and incubated for 1h at 37°C. Cells were then washed with PBS, resuspended in sorting buffer (PBS + 2%FBS) and FACS sorted.
Microarray
β cells from dispersed islets of differently-aged C57BL/6J MIP-GFP mice were purified by FACS (Katsuta et al., 2012) for gene expression profiles using GeneChip Mouse Genome 430 2.0 Array microarrays (Affymetrix, Santa Clara, CA) with n=3 for Young (3–9 wk); 4 for 1 y, and 3 for 2 y. The arrays were normalized using robust multi-array average (RMA) and analyzed using a custom script employing the limma (Ritchie et al., 2015) and sigPathway (Tian et al., 2005) packages in the R software (www.r-project.org).
Insulin secretion in vitro
Insulin secretion was measured by sequential static 1 hour incubations in 2.6 and 16.8 mM glucose in Krebs-Ringer bicarbonate buffer (KRB, 16 mM HEPES and 0.1 % BSA, pH 7.4)(Schuppin et al., 1993). This was preceded by a 1h incubation of the islets at 2.6mM at 37°C. Between each incubation, islets were washed with KREBS 2.6mM. Supernatants and cells were frozen until assayed. IGF-1Rpositive and negative subpopulations were FACS sorted, and incubated overnight for attachment and recovery before static GSIS. Alternatively, we measured insulin secretion of single β cells using the reverse hemolytic plaque assay (RHPA) in which secreted insulin is revealed by the presence of hemolytic plaques around secreting cells. After overnight culture, isolated islet cells were completely dispersed and mixed with protein A-coated sheep erythrocytes (18% suspension) and introduced into a poly-L-lysine-coated glass Cunningham chamber. They were stimulated with 2.6 or 16.8 mmol/l glucose in KRB for 2 h in the presence of guinea pig anti-insulin antiserum (1:40, generated in our laboratory). This was followed by 30 min incubation with guinea pig complement (1:40; Calbiochem, San Diego, CA, USA) and fixation with glutaraldehyde 2.5%. Secreted insulin was revealed as hemolytic plaques around secreting cells. The percentage of insulin-secreting cells forming plaques and the area of the plaques were measured and multiplied to calculate the secretion index, a measure of the overall secretory activity of β cells under a given condition.
Quantitative real-time PCR (QPCR)
Total RNA isolated with PicoRNA extraction kit (Arcturus) or RNEasy Plus Mini Kit (QIAGEN) was reverse transcribed (SuperScript reverse transcriptase, Invitrogen). QPCR used SYBR green detection and specific primers (Key Resources Table). Samples were normalized to β-actin, and the comparative CT (threshold cycle) method used to calculate gene expression levels.
Immunostaining and morphometric evaluation
Paraffin sections were incubated overnight with primary antibody (Key Resources Table). For each antibody, sections were stained and imaged in parallel such that the staining intensity reflects the protein expression. For quantification, images were captured systematically covering the whole section in confocal mode on a Zeiss LSM 710 microscope. Every cluster of insulin-stained cells (3–7 cells) or islet (8 or more cells)/section was evaluated; sections were coded and read blindly. For each age, 3–4 animals were evaluated for each staining. For human samples, sections from one block from the body of the pancreas from donors as listed in Key Resources Table.
S961 treatment
S961 was a generous gift from Dr. Lauge Schaffer (Novo Nordisk) (Schaffer et al., 2008). Vehicle (PBS or NaCl 0.9%) or 10 nmol S961 was loaded into Alzet osmotic pump 2001 and implanted subcutaneously on the back of mice (Yi et al., 2013) for 7 days. At the end of this period the pump was extracted, and the islets were isolated for analysis immediately or the mice were followed for two weeks before their islets were isolated.
Knockdown Experiments
siRNA against mouse p16Ink4a, Igf1r and RNA interference-negative control were purchased from Thermo Scientific/Dharmacon (Lafayette, CO). MIN6 cells were plated at 200,000 cells/well in a 24 well plate. After overnight attachment, they were transfected using DharmaFECT (2.5uL per reaction) and siRNA concentration of 100 nM. After 48 h transfection, the cells were harvested for RNA and qPCR analysis. Results are presented as fold change to MIN6 cells treated with nonspecific siRNA (siSc).
QUANTIFICATION AND STATISTICAL ANALYSIS
Data are shown as mean ± SEM. Statistical parameters (numbers, p value, etc.) are included in each figure legend. For statistical analysis, unpaired Student’s t-tests were used to compare two groups, and one-way ANOVA followed by post-hoc test for more than two groups. A p value <0.05 was considered significant. Prism software was used for graphs and statistical analysis (significance and distribution).
DATA AND SOFTWARE AVAILABILITY
The accession number for the genomic data reported in this paper is Gene Expression Omnibus GSE72753.
KEY RESOURCES TABLE.
| REAGENT or RESOURCE | SOURCE | IDENTIFIER | |
|---|---|---|---|
| Antibodies for immunostaining and FACS | |||
| IGF1r | 1:100 IF; 1:10 FACS | Santa Cruz | rabbit; sc-713 |
| IGF1r | 1:100 | Abcam | chicken; ab32823 |
| CD99 | 1:1000 | Bioss | rabbit; bs-2523R |
| Kcnq5 | 1:500 | Alomone Labs, | rabbit;APC-155 |
| p53BP1 | 1:400 | Bethyl | rabbit; A300-272A |
| GFP | 1:3000 | Aves Lab | chicken;GFP-1020 |
| FLAG | 1:500 | Sigma Aldrich | mouse; F1804 |
| Insulin | 1:500 | Dako | guinea pig; A0564 |
| IgG (rabbit) | 1:200 | Jackson Immunoresearch, | donkey; Alexa-488, -594, Cy5 |
| IgG (chicken) | 1:200 | Abcam | goat; dylight-488 |
| IgG (Guinea pig) | 1:200 | Jackson Immunoresearch, | donkey; Alexa-488, -594 |
| IgG (rabbit) | 1:200 IF: 1:100 FACS | Jackson Immunoresearch, | donkey; Biotin-SP |
| Streptavidin | 1:200 | Jackson Immunoresearch, | AMCA |
| Propidium iodide | 1:10^7 | eBioscience | 00-6990 |
| Bacterial and Virus Strains | |||
| Biological Samples | |||
| Formaldehyde fixed, Paraffin embedded sections of human pancreas (organ donors) group; age; gender; BMI | |||
| Non diabetic; 22; M; 21.9 | NPOD | 6001 | |
| Non diabetic; 22; F; 20.7 | NPOD | 6179 | |
| Non diabetic; 38; M; 30.5 | NPOD | 6254 | |
| Non diabetic; 42; M; 31 | NPOD | 6019 | |
| Non diabetic; 59; F; 24.8 | NPOD | 6017 | |
| Non diabetic; 68; F; 23.7 | NPOD | 6012 | |
| T2D;13; F; 34.1 | NPOD | 6308 | |
| T2D;18.8; F; 39.1 | NPOD | 6059 | |
| T2D;21; F; 40 | NPOD | 6110 | |
| T2D;20; M;37.8 | NPOD | 6252 | |
| T2D;33; M; 30.2 | NPOD | 6028 | |
| T2D;45; F; 30.4 | NPOD | 6127 | |
| T2D;49; F; 36.1 | NPOD | 6189 | |
| T2D;59; M; 34.1 | NPOD | 6206 | |
| T2D;61; F; 33.7 | NPOD | 6221 | |
| Non diabetic; 65 ; F; 45.6 | Joslin Clinical Islet Isolation Core | H06-02 | |
| Non diabetic; 44; F; 26.7 | Joslin Clinical Islet Isolation Core | H02-03 | |
| Non diabetic; 55; F; 25.2 | Joslin Clinical Islet Isolation Core | H01-03 | |
| Non diabetic; 54; F; 36 | Joslin Clinical Islet Isolation Core | H06-10 | |
| Non diabetic; 43; F; 35.8 | Joslin Clinical Islet Isolation Core | H05-14 | |
| Non diabetic; 45; F; 21.5 | Joslin Clinical Islet Isolation Core | H03-17 | |
| Non diabetic; 45; F; 37.4 | Joslin Clinical Islet Isolation Core | H06-23 | |
| Non diabetic; 46; F; 34.8 | Joslin Clinical Islet Isolation Core | H02-23 | |
| Non diabetic; 62; F; 22.4 | Joslin Clinical Islet Isolation Core | H05-03 | |
| Non diabetic; 65; F; 34 | Joslin Clinical Islet Isolation Core | H03-16 | |
| Non diabetic; 67; F; 38.3 | Joslin Clinical Islet Isolation Core | H03-13 | |
| Non diabetic; 68; F; 23.8 | Joslin Clinical Islet Isolation Core | H03-14 | |
| Non diabetic; 17; M; 23.7 | Joslin Clinical Islet Isolation Core | H01-12 | |
| Non diabetic; 19; M; 27 | Joslin Clinical Islet Isolation Core | H01-04 | |
| Non diabetic; 23; M; 23.7 | Joslin Clinical Islet Isolation Core | H01-18 | |
| Non diabetic; 28; F; 24.9 | Joslin Clinical Islet Isolation Core | H04-09 | |
| Non diabetic; 33; M; 24.6 | Joslin Clinical Islet Isolation Core | H01-14 | |
| Non diabetic; 44; M; 23.2 | Joslin Clinical Islet Isolation Core | H03-04 | |
| Non diabetic; 47; F; 23.2 | Joslin Clinical Islet Isolation Core | H01-06 | |
| Non diabetic; 53; M; 25.9 | Joslin Clinical Islet Isolation Core | H01-16 | |
| Non diabetic; 56; F; 21.1 | Joslin Clinical Islet Isolation Core | H01-17 | |
| Non diabetic; 60; M;24.7 | Joslin Clinical Islet Isolation Core | H02-19 | |
| fetal 18–20 wk gestation | Advanced Bioscience Resources, Inc | Y92A | |
| fetal 18 wk gestation | Advanced Bioscience Resources, Inc | Y93B | |
| Chemicals, Peptides, and Recombinant Proteins | |||
| S961 was a generous gift from Dr. Lauge Schaffer | Novo Nordisk, Denmark | N/A | |
| Critical Commercial Assays | |||
| Cellular Senescence Live Cell Analysis Assay Kit (SA-β-gal, Fluorometric) | Enzo Life Sciences | enz-kit 130-0010 | |
| SMARTpool: ON-TARGETplus Cdkn2a siRNA | Dharmacon | L-043107-00-0005 | |
| SMARTpool: ON-TARGETplus Igf1r siRNA | Dharmacon | L-056843-00-0005 | |
| ON-TARGETplus Non-targeting Pool | Dharmacon | D-001810-10-05 | |
| Deposited Data | |||
| Raw microarray data | This paper | GSE72753 | |
| Experimental Models: Cell Lines | |||
| MIN6 beta cell line | Dr. Jun-ichi Miyazaki, Osaka University Medical School | N/A | |
| Experimental Models: Organisms/Strains | |||
| C57Bl/6J | Jackson | 000664 | |
| MIP-GFP, bred onto C57Bl/6J as in Katsuta 2012 | Dr. Manami Hara, Univ Chicago | N/A | |
| INK-ATTAC line 3 congenic, C57Bl6J background | Dr. Jan van Deursen, Mayo Clinic | N/A | |
| Oligonucleotides | |||
| Primers used for q PCR (mouse) | |||
| Beta-actin | Eurofins | 5′ACCGTGAAAAGATGACCCAG-3′ 5′GTACGACCAGAGGCATACAG-3′ |
|
| IGF1r | Eurofins | 5′ATTCTGATGTCTGGTCCTTCG-3′ 5′AGCATATCAGGGCAGTTGTC-3′ |
|
| CD99 | Eurofins | 5′CGTGGTTTTGGCCCTGG-3′ 5′GGTTGGCTTCATGTTGGG-3′ |
|
| Kcnq5 | Eurofins | 5′TGTTTTCTACCATCCCTGAGC-3′ 5′CCTTGCCATCCTCTATAACGAC-3′ |
|
| Insulin-1 | Genosys | 5′CCTGTTGGTGCACTTCCTA-3′ 5′TCTGAAGGTCCCCGGGGCT-3′ |
|
| p16Ink4a | Eurofins | 5′CCCAACGCCCCGAACT-3′ 5′GCAGAAGAGCTGCTACGTGAA-3′ |
|
| Ldha | Eurofins | 5′GGATGAGCTTGCCCTTGTTGA-3′ 5′GACCAGCTTGGAGTTCGCAGTTA-3′ |
|
| Fltp | Eurofins | 5′CTGAAGATCCCACCTGCTAAG-3′ 5′CCCATTACAGGCGTTGAGTAG-3′ |
|
| Recombinant DNA | |||
| Software and Algorithms | |||
| Prism 7 software | GraphPad software | https://www.graphpad.com/scientific-software/prism/ | |
| Other | |||
Supplementary Material
Acknowledgments
We thank Dr. CR. Kahn for helpful and insightful discussion of this project; we thank both Drs. J. Winnay and. Kahn for RNA from islets from the Ins2Akita mice. This study was supported by grants from the NIH (R01 DK093909 [SBW], P30 DK036836 Joslin Diabetes Research Center [DRC] and P30 DK057521 BADRC P&F PI: CAM), the Diabetes Research and Wellness Foundation and an important group of private donors. Some human tissue sections were provided by the Network for Pancreatic Organ Donors with Diabetes (nPOD), a collaborative research project sponsored by JDRF. Organ Procurement Organizations (OPO) partnering with nPOD to provide research resources are listed at http://www.jdrfnpod.org/for-partners/npod-partners/. No conflicts of interest relevant to this article are reported.
Footnotes
AUTHORS’ CONTRIBUTIONS
CAM and SBW conceived the project and wrote the manuscript; CAM, MVH, MM, TBL, CC, JHL, BAS, and JWJ researched data; JMD and AE performed the bioinformatics; JVD provided INK:ATTAC mice and advice; GCW provided critical discussions and edited the manuscript. All authors reviewed the manuscript.
Publisher's Disclaimer: This is a PDF file of an unedited manuscript that has been accepted for publication. As a service to our customers we are providing this early version of the manuscript. The manuscript will undergo copyediting, typesetting, and review of the resulting proof before it is published in its final citable form. Please note that during the production process errors may be discovered which could affect the content, and all legal disclaimers that apply to the journal pertain.
References
- Aguayo-Mazzucato C, Koh A, El Khattabi I, Li WC, Toschi E, Jermendy A, Juhl K, Mao K, Weir GC, Sharma A, et al. Mafa expression enhances glucose-responsive insulin secretion in neonatal rat beta cells. Diabetologia. 2011;54:583–593. doi: 10.1007/s00125-010-2026-z. [DOI] [PMC free article] [PubMed] [Google Scholar]
- Aguayo-Mazzucato C, Sanchez-Soto C, Godinez-Puig V, Gutierrez-Ospina G, Hiriart M. Restructuring of pancreatic islets and insulin secretion in a postnatal critical window. PLoS ONE. 2006;1:e35. doi: 10.1371/journal.pone.0000035. [DOI] [PMC free article] [PubMed] [Google Scholar]
- Avrahami D, Li C, Zhang J, Schug J, Avrahami R, Rao S, Stadler MB, Burger L, Schubeler D, Glaser B, et al. Aging-Dependent Demethylation of Regulatory Elements Correlates with Chromatin State and Improved beta Cell Function. Cell Metabolism. 2015;22:1–14. doi: 10.1016/j.cmet.2015.07.025. [DOI] [PMC free article] [PubMed] [Google Scholar]
- Bader E, MA, Gegg M, Moruzzi N, Gerdes J, Roscioni SS, Bakhti M, Brandl E, Irmler M, Beckers J, Aichler M, Feuchtinger A, Leitzinger C, Zischka H, Wang-Sattler R, Jastroch M, Tschöp M, Machicao F, Staiger H, Haering H-U, Chmelova H, Chouinard JA, Oskolkov N, Korsgren O, Speier S, Lickert H. Identification of proliferative and mature beta cells in the islet of Langerhans. Nature. 2016;535:430–434. doi: 10.1038/nature18624. [DOI] [PubMed] [Google Scholar]
- Baker DJ, Childs BG, Durik M, Wijers ME, Sieben CJ, Zhong J, Saltness RA, Jeganathan KB, Verzosa GC, Pezeshki A, et al. Naturally occurring p16(Ink4a)-positive cells shorten healthy lifespan. Nature. 2016;530:184–189. doi: 10.1038/nature16932. [DOI] [PMC free article] [PubMed] [Google Scholar]
- Baker DJ, Perez-Terzic C, Jin F, Pitel KS, Niederlander NJ, Jeganathan K, Yamada S, Reyes S, Rowe L, Hiddinga HJ, et al. Opposing roles for p16Ink4a and p19Arf in senescence and ageing caused by BubR1 insufficiency. Nature Cell Biol. 2008;10:825–836. doi: 10.1038/ncb1744. [DOI] [PMC free article] [PubMed] [Google Scholar]
- Baker DJ, Wijshake T, Tchkonia T, LeBrasseur NK, Childs BG, van de Sluis B, Kirkland JL, van Deursen JM. Clearance of p16Ink4a-positive senescent cells delays ageing-associated disorders. Nature. 2011;479:232–236. doi: 10.1038/nature10600. [DOI] [PMC free article] [PubMed] [Google Scholar]
- Barbieri M, Bonafe M, Franceschi C, Paolisso G. Insulin/IGF-I-signaling pathway: an evolutionarily conserved mechanism of longevity from yeast to humans. Am J Physiol. 2003;285:E1064–1071. doi: 10.1152/ajpendo.00296.2003. [DOI] [PubMed] [Google Scholar]
- Bliss CR, Sharp GW. Glucose-induced insulin release in islets of young rats: time-dependent potentiation and effects of 2-bromostearate. Am J Physiol. 1992;263:E890–896. doi: 10.1152/ajpendo.1992.263.5.E890. [DOI] [PubMed] [Google Scholar]
- Blum B, Hrvatin SS, Schuetz C, Bonal C, Rezania A, Melton DA. Functional beta-cell maturation is marked by an increased glucose threshold and by expression of urocortin 3. Nature Biotech. 2012;30:261–264. doi: 10.1038/nbt.2141. [DOI] [PMC free article] [PubMed] [Google Scholar]
- Bonner-Weir S. Perspective: Postnatal pancreatic beta cell growth. Endocrinology. 2000;141:1926–1929. doi: 10.1210/endo.141.6.7567. [DOI] [PubMed] [Google Scholar]
- Bosco D, Meda P. Actively synthesizing beta-cells secrete preferentially after glucose stimulation. Endocrinology. 1991;129:3157–3166. doi: 10.1210/endo-129-6-3157. [DOI] [PubMed] [Google Scholar]
- Butler AE, Janson J, Bonner-Weir S, Ritzel R, Rizza RA, Butler PC. Beta-cell deficit and increased beta-cell apoptosis in humans with type 2 diabetes. Diabetes. 2003;52:102–110. doi: 10.2337/diabetes.52.1.102. [DOI] [PubMed] [Google Scholar]
- Campisi J, d’Adda di Fagagna F. Cellular senescence: when bad things happen to good cells. Nature Reviews Mol Cell Biol. 2007;8:729–740. doi: 10.1038/nrm2233. [DOI] [PubMed] [Google Scholar]
- Chen H, Gu X, Su IH, Bottino R, Contreras JL, Tarakhovsky A, Kim SK. Polycomb protein Ezh2 regulates pancreatic beta-cell Ink4a/Arf expression and regeneration in diabetes mellitus. Genes & Develop. 2009;23:975–985. doi: 10.1101/gad.1742509. [DOI] [PMC free article] [PubMed] [Google Scholar]
- Dhawan S, Tschen SI, Bhushan A. Bmi-1 regulates the Ink4a/Arf locus to control pancreatic beta-cell proliferation. Genes & Develop. 2009;23:906–911. doi: 10.1101/gad.1742609. [DOI] [PMC free article] [PubMed] [Google Scholar]
- Dorrell C, SJ, Canaday PS, Russ HA, Tarlow BD, Grompe MT, Horton T, Hebrok M, Streeter PR, Kaestner KH, Grompe M. Human islets contain 4 distinct subtypes of beta cells. Nature Comm. 2016;7:11756. doi: 10.1038/ncomms11756. [DOI] [PMC free article] [PubMed] [Google Scholar]
- Fadista J, Vikman P, Laakso EO, Mollet IG, Esguerra JL, Taneera J, Storm P, Osmark P, Ladenvall C, Prasad RB, et al. Global genomic and transcriptomic analysis of human pancreatic islets reveals novel genes influencing glucose metabolism. Proc Nat Acad Sci USA. 2014;111:13924–13929. doi: 10.1073/pnas.1402665111. [DOI] [PMC free article] [PubMed] [Google Scholar]
- Finegood DT, Scaglia L, Bonner-Weir S. Dynamics of beta-cell mass in the growing rat pancreas. Estimation with a simple mathematical model. Diabetes. 1995;44:249–256. doi: 10.2337/diab.44.3.249. [DOI] [PubMed] [Google Scholar]
- Freeman HC, Hugill A, Dear NT, Ashcroft FM, Cox RD. Deletion of nicotinamide nucleotide transhydrogenase: a new quantitive trait locus accounting for glucose intolerance in C57BL/6J mice. Diabetes. 2006;55:2153–2156. doi: 10.2337/db06-0358. [DOI] [PubMed] [Google Scholar]
- Gepts W, Lecompte PM. The pancreatic islets in diabetes. Am J Med. 1981;70:105–115. doi: 10.1016/0002-9343(81)90417-4. [DOI] [PubMed] [Google Scholar]
- Gotoh M, Maki T, Satomi S, Porter J, Bonner-Weir S, O’Hara CJ, Monaco AP. Reproducible high yield of rat islets by stationary in vitro digestion following pancreatic ductal or portal venous collagenase injection. Transplantation. 1987;43:725–730. doi: 10.1097/00007890-198705000-00024. [DOI] [PubMed] [Google Scholar]
- Gregg BE, Moore PC, Demozay D, Hall BA, Li M, Husain A, Wright AJ, Atkinson MA, Rhodes CJ. Formation of a human beta-cell population within pancreatic islets is set early in life. J Clin Endo Metabol. 2012;97:3197–3206. doi: 10.1210/jc.2012-1206. [DOI] [PMC free article] [PubMed] [Google Scholar]
- Guo N, Parry EM, Li LS, Kembou F, Lauder N, Hussain MA, Berggren PO, Armanios M. Short telomeres compromise beta-cell signaling and survival. PloS One. 2011;6:e17858. doi: 10.1371/journal.pone.0017858. [DOI] [PMC free article] [PubMed] [Google Scholar]
- Hara M, Wang X, Kawamura T, Bindokas VP, Dizon RF, Alcoser SY, Magnuson MA, Bell GI. Transgenic mice with green fluorescent protein-labeled pancreatic beta -cells. Am J Physiol. 2003;284:E177–183. doi: 10.1152/ajpendo.00321.2002. [DOI] [PubMed] [Google Scholar]
- Helman A, Klochendler A, Azazmeh N, Gabai Y, Horwitz E, Anzi S, Swisa A, Condiotti R, Granit RZ, Nevo Y, et al. p16(Ink4a)-induced senescence of pancreatic beta cells enhances insulin secretion. Nature Med. 2016;22:412–420. doi: 10.1038/nm.4054. [DOI] [PMC free article] [PubMed] [Google Scholar]
- Hiriart M, Ramirez-Medeles MC. Functional subpopulations of individual pancreatic B-cells in culture. Endocrinology. 1991;128:3193–3198. doi: 10.1210/endo-128-6-3193. [DOI] [PubMed] [Google Scholar]
- Hiriart M, Sanchez-Soto MC, Ramirez-Medeles MC, Malaisse WJ. Functional heterogeneity of single pancreatic beta-cells stimulated by L-leucine and the methyl ester of succinic or glutamic acid. Biochem Mol Med. 1995;54:133–137. doi: 10.1006/bmme.1995.1019. [DOI] [PubMed] [Google Scholar]
- Johnston NR, Mitchell RK, Haythorne E, Pessoa MP, Semplici F, Ferrer J, Piemonti L, Marchetti P, Bugliani M, Bosco D, et al. Beta Cell Hubs Dictate Pancreatic Islet Responses to Glucose. Cell Metabolism. 2016;24:389–401. doi: 10.1016/j.cmet.2016.06.020. [DOI] [PMC free article] [PubMed] [Google Scholar]
- Jonas JC, Sharma A, Hasenkamp W, Ilkova H, Patane G, Laybutt R, Bonner-Weir S, Weir GC. Chronic hyperglycemia triggers loss of pancreatic beta cell differentiation in an animal model of diabetes. J Biol Chem. 1999;274:14112–14121. doi: 10.1074/jbc.274.20.14112. [DOI] [PubMed] [Google Scholar]
- Karaca M, Castel J, Tourrel-Cuzin C, Brun M, Geant A, Dubois M, Catesson S, Rodriguez M, Luquet S, Cattan P, et al. Exploring functional beta-cell heterogeneity in vivo using PSA-NCAM as a specific marker. PloS One. 2009;4:e5555. doi: 10.1371/journal.pone.0005555. [DOI] [PMC free article] [PubMed] [Google Scholar]
- Katsuta H, Aguayo-Mazzucato C, Katsuta R, Akashi T, Hollister-Lock J, Sharma AJ, Bonner-Weir S, Weir GC. Subpopulations of GFP-marked mouse pancreatic beta-cells differ in size, granularity, and insulin secretion. Endocrinology. 2012;153:5180–5187. doi: 10.1210/en.2012-1257. [DOI] [PMC free article] [PubMed] [Google Scholar]
- Kaufman RJ. Beta-cell failure, stress, and type 2 diabetes. N Engl J Med. 2011;365:1931–1933. doi: 10.1056/NEJMcibr1109442. [DOI] [PMC free article] [PubMed] [Google Scholar]
- Kiekens R, In ‘t Veld P, Mahler T, Schuit F, Van De Winkel M, Pipeleers D. Differences in glucose recognition by individual rat pancreatic B cells are associated with intercellular differences in glucose-induced biosynthetic activity. J Clin Invest. 1992;89:117–125. doi: 10.1172/JCI115551. [DOI] [PMC free article] [PubMed] [Google Scholar]
- King AJ, Fernandes JR, Hollister-Lock J, Nienaber CE, Bonner-Weir S, Weir GC. Normal relationship of beta- and non-beta-cells not needed for successful islet transplantation. Diabetes. 2007;56:2312–2318. doi: 10.2337/db07-0191. [DOI] [PubMed] [Google Scholar]
- Kohler CU, Olewinski M, Tannapfel A, Schmidt WE, Fritsch H, Meier JJ. Cell cycle control of beta-cell replication in the prenatal and postnatal human pancreas. Am J Physiol. 2011;300:E221–230. doi: 10.1152/ajpendo.00496.2010. [DOI] [PubMed] [Google Scholar]
- Koopman RJ, Mainous AG, 3rd, Diaz VA, Geesey ME. Changes in age at diagnosis of type 2 diabetes mellitus in the United States, 1988 to 2000. Ann Family Med. 2005;3:60–63. doi: 10.1370/afm.214. [DOI] [PMC free article] [PubMed] [Google Scholar]
- Krishnamurthy J, Ramsey MR, Ligon KL, Torrice C, Koh A, Bonner-Weir S, Sharpless NE. p16INK4a induces an age-dependent decline in islet regenerative potential. Nature. 2006;443:453–457. doi: 10.1038/nature05092. [DOI] [PubMed] [Google Scholar]
- Krishnamurthy J, Torrice C, Ramsey MR, Kovalev GI, Al-Regaiey K, Su L, Sharpless NE. Ink4a/Arf expression is a biomarker of aging. J Clin Invest. 2004;114:1299–1307. doi: 10.1172/JCI22475. [DOI] [PMC free article] [PubMed] [Google Scholar]
- Kushner JA. The role of aging upon beta cell turnover. J Clin Invest. 2013;123:990–995. doi: 10.1172/JCI64095. [DOI] [PMC free article] [PubMed] [Google Scholar]
- Ling Z, Wang Q, Stange G, In’t Veld P, Pipeleers D. Glibenclamide treatment recruits beta-cell subpopulation into elevated and sustained basal insulin synthetic activity. Diabetes. 2006;55:78–85. [PubMed] [Google Scholar]
- Liu YQ, Nevin PW, Leahy JL. beta-cell adaptation in 60% pancreatectomy rats that preserves normoinsulinemia and normoglycemia. Am J Physiol. 2000;279:E68–73. doi: 10.1152/ajpendo.2000.279.1.E68. [DOI] [PubMed] [Google Scholar]
- Marselli L, Thorne J, Dahiya S, Sgroi DC, Sharma A, Bonner-Weir S, Marchetti P, Weir GC. Gene expression profiles of Beta-cell enriched tissue obtained by laser capture microdissection from subjects with type 2 diabetes. PLoS One. 2010;5:e11499. doi: 10.1371/journal.pone.0011499. [DOI] [PMC free article] [PubMed] [Google Scholar]
- Montanya E, Nacher V, Biarnes M, Soler J. Linear correlation between beta-cell mass and body weight throughout the lifespan in Lewis rats: role of beta-cell hyperplasia and hypertrophy. Diabetes. 2000;49:1341–1346. doi: 10.2337/diabetes.49.8.1341. [DOI] [PubMed] [Google Scholar]
- Olsson R, Carlsson PO. A low-oxygenated subpopulation of pancreatic islets constitutes a functional reserve of endocrine cells. Diabetes. 2011;60:2068–2075. doi: 10.2337/db09-0877. [DOI] [PMC free article] [PubMed] [Google Scholar]
- Peng SW, Zhu LY, Chen M, Zhang M, Li DZ, Fu YC, Chen SR, Wei CJ. Heterogeneity in mitotic activity and telomere length implies an important role of young islets in the maintenance of islet mass in the adult pancreas. Endocrinology. 2009;150:3058–3066. doi: 10.1210/en.2008-1731. [DOI] [PMC free article] [PubMed] [Google Scholar]
- Pipeleers D, Kiekens R, Ling Z, Wilikens A, Schuit F. Physiologic relevance of heterogeneity in the pancreatic beta-cell population. Diabetologia. 1994;37(Suppl 2):S57–64. doi: 10.1007/BF00400827. [DOI] [PubMed] [Google Scholar]
- Pipeleers DG. Heterogeneity in pancreatic beta-cell population. Diabetes. 1992;41:777–781. doi: 10.2337/diab.41.7.777. [DOI] [PubMed] [Google Scholar]
- Ritchie ME, Phipson B, Wu D, Hu Y, Law CW, Shi W, Smyth GK. limma powers differential expression analyses for RNA-sequencing and microarray studies. Nucleic Acids Res. 2015;43:e47. doi: 10.1093/nar/gkv007. [DOI] [PMC free article] [PubMed] [Google Scholar]
- Salomon D, Meda P. Heterogeneity and contact-dependent regulation of hormone secretion by individual B cells. Exp Cell Res. 1986;162:507–520. doi: 10.1016/0014-4827(86)90354-x. [DOI] [PubMed] [Google Scholar]
- Scaglia L, Cahill CJ, Finegood DT, Bonner-Weir S. Apoptosis participates in the remodeling of the endocrine pancreas in the neonatal rat. Endocrinology. 1997;138:1736–1741. doi: 10.1210/endo.138.4.5069. [DOI] [PubMed] [Google Scholar]
- Schaffer L, Brand CL, Hansen BF, Ribel U, Shaw AC, Slaaby R, Sturis J. A novel high-affinity peptide antagonist to the insulin receptor. Biochem Biophys Res Comm. 2008;376:380–383. doi: 10.1016/j.bbrc.2008.08.151. [DOI] [PubMed] [Google Scholar]
- Schuit FC, In’t Veld PA, Pipeleers DG. Glucose stimulates proinsulin biosynthesis by a dose-dependent recruitment of pancreatic beta cells. Proc Nati Acad Sci USA. 1988;85:3865–3869. doi: 10.1073/pnas.85.11.3865. [DOI] [PMC free article] [PubMed] [Google Scholar]
- Schuppin GT, Bonner-Weir S, Montana E, Kaiser N, Weir GC. Replication of adult pancreatic-beta cells cultured on bovine corneal endothelial cell extracellular matrix. In Vitro Cell Dev Biol Anim. 1993;29A:339–344. doi: 10.1007/BF02633963. [DOI] [PubMed] [Google Scholar]
- Segerstolpe A, Palasantza A, Eliasson P, Andersson EM, Andreasson AC, Sun X, Picelli S, Sabirsh A, Clausen M, Bjursell MK, et al. Single-Cell Transcriptome Profiling of Human Pancreatic Islets in Health and Type 2 Diabetes. Cell Metabolism. 2016;24:593–607. doi: 10.1016/j.cmet.2016.08.020. [DOI] [PMC free article] [PubMed] [Google Scholar]
- Tian L, Greenberg SA, Kong SW, Altschuler J, Kohane IS, Park PJ. Discovering statistically significant pathways in expression profiling studies. Proc Nat Acad Sci USA. 2005;102:13544–13549. doi: 10.1073/pnas.0506577102. [DOI] [PMC free article] [PubMed] [Google Scholar]
- Tornovsky-Babeay S, Dadon D, Ziv O, Tzipilevich E, Kadosh T, Schyr-Ben Haroush R, Hija A, Stolovich-Rain M, Furth-Lavi J, Granot Z, et al. Type 2 diabetes and congenital hyperinsulinism cause DNA double-strand breaks and p53 activity in beta cells. Cell Metabolism. 2014;19:109–121. doi: 10.1016/j.cmet.2013.11.007. [DOI] [PubMed] [Google Scholar]
- Tschen SI, Dhawan S, Gurlo T, Bhushan A. Age-dependent decline in beta-cell proliferation restricts the capacity of beta-cell regeneration in mice. Diabetes. 2009;58:1312–1320. doi: 10.2337/db08-1651. [DOI] [PMC free article] [PubMed] [Google Scholar]
- van Deursen JM. The role of senescent cells in ageing. Nature. 2014;509:439–446. doi: 10.1038/nature13193. [DOI] [PMC free article] [PubMed] [Google Scholar]
- Van Schravendijk CF, Kiekens R, Pipeleers DG. Pancreatic beta cell heterogeneity in glucose-induced insulin secretion. J Biol Chem. 1992;267:21344–21348. [PubMed] [Google Scholar]
- Weir GC, Aguayo-Mazzucato C, Bonner-Weir S. Beta-cell dedifferentiation in diabetes is important, but what is it? Islets. 2013;5:233–237. doi: 10.4161/isl.27494. [DOI] [PMC free article] [PubMed] [Google Scholar]
- Weir GC, Bonner-Weir S. Islet beta cell mass in diabetes and how it relates to function, birth, and death. Ann NY Acad Sci. 2013;1281:92–105. doi: 10.1111/nyas.12031. [DOI] [PMC free article] [PubMed] [Google Scholar]
- Westermark GT, Westermark P. Islet amyloid polypeptide and diabetes. Curr Protein Pept Sci. 2013;14:330–337. doi: 10.2174/13892037113149990050. [DOI] [PubMed] [Google Scholar]
- Xin Y, Kim J, Okamoto H, Ni M, Wei Y, Adler C, Murphy AJ, Yancopoulos GD, Lin C, Gromada J. RNA sequencing of single human islet cells reveals type 2 diabetes genes. Cell Metabolism. 2016;24:608–615. doi: 10.1016/j.cmet.2016.08.018. [DOI] [PubMed] [Google Scholar]
- Yi P, Park JS, Melton DA. Betatrophin: a hormone that controls pancreatic beta cell proliferation. Cell. 2013;153:747–758. doi: 10.1016/j.cell.2013.04.008. [DOI] [PMC free article] [PubMed] [Google Scholar] [Retracted]
Associated Data
This section collects any data citations, data availability statements, or supplementary materials included in this article.