

Abstract
Background
Fatty acid composition of muscle is an important trait contributing to meat quality. Recently, genome-wide association study (GWAS) has been extensively used to explore the molecular mechanism underlying important traits in cattle. In this study, we performed GWAS using high density SNP array to analyze the association between SNPs and fatty acids and evaluated the accuracy of genomic prediction for fatty acids in Chinese Simmental cattle.
Results
Using the BayesB method, we identified 35 and 7 regions in Chinese Simmental cattle that displayed significant associations with individual fatty acids and fatty acid groups, respectively. We further obtained several candidate genes which may be involved in fatty acid biosynthesis including elongation of very long chain fatty acids protein 5 (ELOVL5), fatty acid synthase (FASN), caspase 2 (CASP2) and thyroglobulin (TG). Specifically, we obtained strong evidence of association signals for one SNP located at 51.3 Mb for FASN using Genome-wide Rapid Association Mixed Model and Regression-Genomic Control (GRAMMAR-GC) approaches. Also, region-based association test identified multiple SNPs within FASN and ELOVL5 for C14:0. In addition, our result revealed that the effectiveness of genomic prediction for fatty acid composition using BayesB was slightly superior over GBLUP in Chinese Simmental cattle.
Conclusions
We identified several significantly associated regions and loci which can be considered as potential candidate markers for genomics-assisted breeding programs. Using multiple methods, our results revealed that FASN and ELOVL5 are associated with fatty acids with strong evidence. Our finding also suggested that it is feasible to perform genomic selection for fatty acids in Chinese Simmental cattle.
Electronic supplementary material
The online version of this article (doi:10.1186/s12864-017-3847-7) contains supplementary material, which is available to authorized users.
Keywords: Fatty acid, Genome-wide association study, Genomic prediction, High-density genotypes, Simmental cattle
Background
Fatty acids are required by daily normal metabolism, and can be obtained from food and meat. Improving nutritional value of meat products for human health has attracted extensive attention in current society [1, 2]. Fat content and fatty acid composition in beef products are associated with meat taste and flavor, and these are considered as main sensory properties in consumer’s selection and acceptance [3].
Fatty acids are important indicators of beef meat quality, and previous studies have been conducted to examine fatty acids for various cattle breeds in different feeding environments [4]. Fatty acid composition are often lowly or moderately heritable traits in various populations with different genetic architecture [5]. Several studies have revealed that the level of heritability and genetic correlation theoretically allow for genetic improvement of fatty acid composition by selection of both major candidate genes and genomic selection strategies [6–10]. Therefore, application of molecular genetics approaches can provide an opportunity for genetic improvement for fatty acid composition of beef cattle [11–13].
During the last decades, tremendous works have been done to elucidate the genetic mechanism of fatty acids using candidate gene [14–21] and linkage mapping approaches [22–24]. In recent years, genome-wide association studies (GWAS) have been widely used to study the molecular mechanism underlying important traits in beef and dairy cattle [25–29]. Previous GWAS and genomic predictions have identified candidate markers associated with various fatty acid composition and evaluated the accuracy of genomic prediction for these traits [8, 30–34]. However, many studies were conducted in populations with relatively low density SNP arrays. Despite recent GWAS for fatty acid composition have been investigated using the high density BovineHD (770 K) SNP array, those studies were mostly limited in Nellore cattle [35, 36]. On the other hand, extensive attention has been paid to investigate the accuracies of genomic prediction using multiple methods in different populations [32, 33]. A recent study in Nellore cattle indicated that the accuracies of genomic prediction were moderate to high and it was feasible to apply genomic selection in cattle. However, their results were limited to carcass traits in Nellore population [37]. Therefore, understanding the molecular mechanisms underlying fatty acid composition and evaluating the accuracy of genomic predictions in other important cattle breeds still need further investigation.
The objectives of the current study were to explore the associated genomic regions and estimate the predictive accuracies for fatty acid composition using the BovineHD SNP array in Chinese Simmental population. In this study, we identified several potential candidate markers and genes associated with fatty acid composition. Our findings will facilitate the elucidation of the molecular mechanism and help us design optimal genomic selection strategies for fatty acid composition in cattle and other farm animals.
Results
Descriptive statistics of fatty acid composition and their estimates of heritability
We measured six saturated fatty acids (SFA), four monounsaturated fatty acids (MUFA) and eleven polyunsaturated fatty acids (PUFA) using gas chromatography. Descriptive statistics and estimates of heritability for 21 individual fatty acids were presented in Table 1. We observed that the most abundant individual saturated fatty acids were C16:0 (23.8%) and C18:0 (20.2%), while for monounsaturated and polyunsaturated fatty acids, relatively high proportions of individual fatty acids were C18:1 cis-9 (32.0%) and C18:2 n-6 (12.9%). In contrast, we found saturated fatty acids (C20:0, C22:0, C24:0), monounsaturated fatty acids (C14:1 cis-9 and C20:1 cis-11), and polyunsaturated fatty acids (C18:2 t-9c-11, C18:2 t-12c-10, C18:3 n-6, C18:3 n-3, C20:2 n-6, C20:4 n-6, C20:5 n-3, C22:5 n-3, C22:6 n-3) accounted for relatively low proportion (<1% each) of the total fatty acids. In this study, our results found the estimated heritability varied noticeably for these fatty acids. Among 21 individual fatty acids, we found only C14:0 showed a relatively high heritability at 0.54 and five fatty acids including C18:0, C20:0, C14:1 cis-9, C16:1 cis-9 and C18:1 cis-9 showed a moderate heritability, while most of heritability estimates for others fatty acids (15 out of 21) were below 0.2 (Table 1). For the eight groups of fatty acids, we found MUFA, n-6/n-3 and health index (HI) showed moderate heritabilities (0.27, 0.22 and 0.24), while the estimated heritability for SFA, PUFA, total of omega 3 (n-3), total of omega 6 (n-6) were 0.12, 0.16, 0.15, and 0.16, respectively.
Table 1.
Summary statistics of mean (%), standard deviation (SD, %) and heritability estimates (h 2), additive genetic variance and coefficient of variation (CV%)
| Traita | Name | Mean ± SD | Additive genetic variance | Residual variance | CV% | h2 ± SE |
|---|---|---|---|---|---|---|
| IMF | Intramuscular fat | 4.09 ± 2.24 | 0.8132 | 3.4668 | 54.77 | 0.19 ± 0.10 |
| Saturated | ||||||
| C14:0 | Myristic | 1.58 ± 0.45 | 0.0694 | 0.0599 | 28.48 | 0.54 ± 0.14 |
| C16:0 | Palmitic | 23.79 ± 8.75 | 4.5292 | 43.1737 | 36.78 | 0.09 ± 0.04 |
| C18:0 | Stearic | 20.23 ± 3.47 | 2.4048 | 4.5660 | 17.15 | 0.34 ± 0.12 |
| C20:0 | Arachidic | 0.38 ± 0.29 | 0.0397 | 0.1257 | 76.32 | 0.24 ± 0.06 |
| C22:0 | Behenic | 0.13 ± 0.12 | 0.0009 | 0.0109 | 92.31 | 0.08 ± 0.07 |
| C24:0 | Methyl tetracosanoate | 0.36 ± 0.17 | 0.0014 | 0.0275 | 47.22 | 0.05 ± 0.06 |
| Monounsaturated | ||||||
| C14:1 cis-9 | Methyl myristoleate | 0.41 ± 0.24 | 0.0101 | 0.0373 | 58.54 | 0.21 ± 0.08 |
| C16:1 cis-9 | Methyl palmitoleate | 2.08 ± 1.07 | 0.2100 | 0.6590 | 51.44 | 0.24 ± 0.07 |
| C18:1 cis-9 | Oleic | 31.98 ± 6.69 | 4.9380 | 16.6498 | 20.92 | 0.23 ± 0.09 |
| C20:1 cis-11 | Cis-11-eicosenoic acid methyl ester | 0.26 ± 0.13 | 0.0008 | 0.0161 | 48.16 | 0.05 ± 0.07 |
| Polyunsaturated | ||||||
| C18:2 n-6 | Linoleic | 12.93 ± 5.84 | 3.8965 | 18.2536 | 45.17 | 0.18 ± 0.10 |
| C18:2 t-9c-11 | cis-9 and trans-11 octadecadienoic acid methyl esters | 0.42 ± 0.27 | 0.0065 | 0.0663 | 63.15 | 0.09 ± 0.08 |
| C18:2 t-12c-10 | cis-10 and trans-12 octadecadienoic acid methyl esters | 0.16 ± 0.13 | 0.0009 | 0.0161 | 81.25 | 0.05 ± 0.04 |
| C18:3 n-6 | Methyl γ-linoleate | 0.41 ± 0.32 | 0.0054 | 0.0630 | 78.05 | 0.08 ± 0.05 |
| C18:3 n-3 | Linolenic | 0.68 ± 0.32 | 0.0085 | 0.0711 | 47.06 | 0.11 ± 0.06 |
| C20:2 n-6 | Cis-11,14-eicosadienoic acid methyl ester | 0.17 ± 0.13 | 0.0132 | 0.1522 | 75.76 | 0.08 ± 0.05 |
| C20:3 n-3 | Cis-11,14,17-eicosatrienoic acid methyl ester | 2.75 ± 1.42 | 0.2328 | 1.2310 | 51.64 | 0.16 ± 0.08 |
| C20:4 n-6 | Cis-5,8,11,14-eicosatetraenoic acid methyl ester | 0.03 ± 0.02 | 2.4e-5 | 3.76e-4 | 66.67 | 0.06 ± 0.04 |
| C20:5 n-3 | Cis-5,8,11,14,17-eicosapentaenoic acid methyl ester | 0.32 ± 0.21 | 0.0036 | 0.0233 | 65.63 | 0.13 ± 0.06 |
| C22:5 n-3 | Cis-7,10,13,16,19-docosapentaenoic methyl ester | 0.73 ± 0.43 | 0.0240 | 0.1609 | 58.85 | 0.13 ± 0.07 |
| C22:6 n-3 | Cis-4,7,10,13,16,19-docosahexaenoic acid methyl ester | 0.20 ± 0.18 | 0.0013 | 0.0311 | 93.20 | 0.04 ± 0.06 |
| Fatty acid groups | ||||||
| SFA | Sum of saturated fatty acid | 46.47 ± 8.23 | 6.9372 | 50.8728 | 17.71 | 0.12 ± 0.08 |
| MUFA | Sum of monounsaturated fatty acid | 34.73 ± 6.97 | 6.1980 | 16.7576 | 20.07 | 0.27 ± 0.10 |
| PUFA | Sum of polyunsaturated fatty acid | 18.8 ± 8.72 | 7.5442 | 39.6071 | 46.38 | 0.16 ± 0.09 |
| PUFA/SFA | Ration between PUFA and SFA | 0.4 ± 0.23 | 0.0092 | 0.04249 | 56.48 | 0.18 ± 0.09 |
| n-3 | Sum of omega 3 fatty acids | 4.68 ± 2.64 | 0.7182 | 4.0698 | 56.41 | 0.15 ± 0.08 |
| n-6 | Sum of omega 6 fatty acids | 13.54 ± 6.28 | 3.8914 | 20.4299 | 46.38 | 0.16 ± 0.08 |
| n-6/n-3 | Ratio between n-6 and n-3 PUFA | 2.89 ± 0.64 | 0.074 | 0.257 | 22.21 | 0.22 ± 0.11 |
| HI | Health index | 1.78 ± 0.37 | 0.2894 | 0.9165 | 20.83 | 0.24 ± 0.10 |
aThe concentrations of fatty acids were expressed as a percentage of total fatty acid methyl esters quantified
Phenotypic and genetic correlations
Phenotypic and genetic correlations among 21 individual fatty acids were presented in Fig. 1. The estimated phenotype correlation of these fatty acids (Fig. 1a) generally displayed different patterns compared to genetic counterparts (Fig. 1b). We observed that high positive phenotypic and genetic correlations existed between several pairs of individual fatty acids. For instance, the estimated genetic correlations between C20:0 and C20:1 cis-11, C20:0 and C18:2 t-12c-10, C20:0 and C20:2 n-6 and C20:0 and C20:4 n-6 were 0.89, 0.95, 0.92 and 0.86, respectively. In contrast, we found clear negative correlations between C14:0 and C18:2 n-6, C14:0 and C20:3 n-3, C18:1 cis-9 and C18:2 n-6, C18:1 cis-9 and C20:5 n-3 (Additional file 1: Table S1).
Fig. 1.
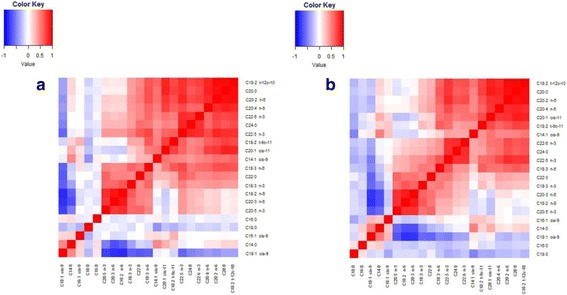
Heatmap of phenotypic (a) and genetic correlation (b) across 21 individual fatty acid compositions
Bayesian based GWAS and candidate regions
We performed GWAS using the BayesB method for 11 individual fatty acids that showed estimated genomic heritability ≥ 0.10, including 3 saturated fatty acids (C14:0, C18:0 and C20:0), 3 monounsaturated fatty acids (C14:1 cis-9, C16:1 cis-9 and C18:1 cis-9) and 5 polyunsaturated fatty acids (C18:2 n-6, C18:3 n-3, C20:3 n-3, C20:5 n-3 and C22:5 n-3). To identify potential regions associated with fatty acids, we divided the genome into 100 kb windows, leading to 24,900 regions across the genome. Regions that explain more than 1% of additive genetic variances were considered as candidates and subject to further analyses to identify the associated genes within these regions. Summary statistics including genetic variances explained, position for the 100 kb windows, flanking rs number ID for these regions, and candidate genes of saturated fatty acid, monounsaturated fatty acid and polyunsaturated fatty acids were represented in Tables 2 and 3, respectively.
Table 2.
Genomic regions associated with the saturated fatty acids in Chinese Simmental cattle using BayesB method
| FA Trait | Chr | Associated Window | nSNP | rs_ID_start | rs_ID_end | Genetic variance for 100 kb window | Positional/putative candidate gene | Gene name |
|---|---|---|---|---|---|---|---|---|
| C14:0 | chr25 | 15100001:15200000 | 37 | rs134854144 | rs136080067 | 0.014154507 | ||
| chr23 | 25100001:25200000 | 47 | rs132630789 | rs109109903 | 0.014619034 | ELOVL5 | Bos taurus Elongation of very long chain fatty acids protein 5 | |
| chr22 | 59100001:59200000 | 47 | rs41638475 | rs109645438 | 0.074590648 |
HDAC11
NUP210 |
Bos taurus histone deacetylase 11 Bos taurus nucleoporin 210 |
|
| chr19 | 51300001:51400000 | 22 | rs41921222 | rs41919992 | 0.100435511 | FASN | Bos taurus fatty acid synthase | |
| C18:0 | chr6 | 104300001:104400000 | 37 | rs43482940 | rs134151071 | 0.011996761 | DMP1 | Bos taurus dentin matrix acidic phosphoprotein 1 |
| chr6 | 70900001:71000000 | 33 | rs108998288 | rs137260120 | 0.012677451 | |||
| chr6 | 41100001:41200000 | 19 | rs134035533 | rs43461220 | 0.018256368 | SLIT2 | Bos taurus slit guidance ligand 2 | |
| C20:0 | chr2 | 11700001:11800000 | 31 | rs134430461 | rs109568935 | 0.028998035 | ||
| chr4 | 107500001:107600000 | 23 | rs132935788 | rs135713587 | 0.012116165 |
CASP2
CLCN1 FAM131B ZYX |
Bos taurus caspase 2, apoptosis-related cysteine peptidase Bos taurus chloride voltage-gated channel 1 Bos taurus family with sequence similarity 131 member B Bos taurus zyxin |
|
| chr6 | 24100001:24200000 | 20 | rs110959363 | rs110137781 | 0.018578393 | |||
| chr7 | 111100001:111200000 | 31 | rs133722129 | rs43539829 | 0.013985525 | PJA2 | Bos taurus praja ring finger 2, E3 ubiquitin protein ligase | |
| chr12 | 13800001:13900000 | 36 | rs132809847 | rs109642481 | 0.012955962 | |||
| chr12 | 71200001:71300000 | 2 | rs137175740 | rs42873431 | 0.022999321 | |||
| chr14 | 35500001:35600000 | 24 | rs136365597 | rs137334521 | 0.062770091 | |||
| chr15 | 47400001:47500000 | 16 | rs42670335 | rs41772249 | 0.032833294 | FAM160A2 | Bos taurus family with sequence similarity 160 member A2 | |
| chr23 | 11400001:11500000 | 16 | rs133114050 | rs110729743 | 0.015925179 |
Table 3.
Genomic regions associated with the monounsaturated and polyunsaturated fatty acids in Chinese Simmental cattle using BayesB method
| FA Trait | Chr | Associated Window | nSNP | rs_ID_start | rs_ID_end | Genetic variance for 100 kb window | Positional/putative candidate gene | Gene name |
|---|---|---|---|---|---|---|---|---|
| C14:1 cis-9 | chr2 | 14700001:14800000 | 24 | rs109872420 | rs42238053 | 0.016989227 | SSFA2 | Bos taurus sperm specific antigen 2 |
| chr19 | 51300001:51400000 | 22 | rs41921222 | rs41919992 | 0.064947269 | FASN | Bos taurus fatty acid synthase | |
| chr22 | 40200001:40300000 | 50 | rs43704022 | rs134738297 | 0.012042417 | PTPRG | Bos taurus protein tyrosine phosphatase, receptor type, G | |
| C16:1 cis-9 | chr5 | 62300001:62400000 | 23 | rs109883934 | rs135394103 | 0.023992534 | ||
| chr14 | 9400001:9500000 | 21 | rs110610151 | rs133268603 | 0.039269923 | TG | Bos taurus thyroglobulin | |
| C18:1 cis-9 | chr12 | 76800001:76900000 | 43 | rs42705033 | rs133235260 | 0.013243828 |
CLDN10
DZIP1 |
Bos taurus claudin 10 Bos taurus DAZ interacting zinc finger protein 1 |
| chr14 | 30100001:30200000 | 14 | rs133107941 | rs109885660 | 0.022457664 | |||
| chr14 | 30300001:30400000 | 27 | rs135047094 | rs41733749 | 0.194380284 | |||
| C18:2 n-6 | chr4 | 83500001:83600000 | 34 | rs42446310 | rs42501954 | 0.023282701 | LSM8 | Bos taurus LSM8 homolog, U6 small nuclear RNA associated |
| chr20 | 23500001:23600000 | 14 | rs109459626 | rs110757204 | 0.049524271 | SLC38A9 | Bos taurus solute carrier family 38 member 9 | |
| C18:3 n-3 C20:3 n-3 |
chr14 | 30300001:30400000 | 27 | rs135047094 | rs41733749 | 0.028254641 | ||
| chr4 | 83500001:83600000 | 34 | rs42446310 | rs42501954 | 0.010587293 | LSM8 | Bos taurus LSM8 homolog, U6 small nuclear RNA associated | |
| chr17 | 68400001:68500000 | 27 | rs110865754 | rs136952413 | 0.017868447 |
TFIP11
TPST2 |
Bos taurus tuftelin interacting protein 11 Bos taurus tyrosylprotein sulfotransferase 2 |
|
| C20:5 n-3 | chr3 | 55400001:55500000 | 27 | rs137055781 | rs135699972 | 0.017277515 | ||
| chr5 | 110800001:110900000 | 35 | rs41593844 | rs109225081 | 0.010709916 |
CBY1
TOMM22 JOSD1 GTPBP1 SUN2 |
Bos taurus chibby homolog 1 (Drosophila). Bos taurus translocase of outer mitochondrial membrane 22 Bos taurus Josephin domain containing 1 Bos taurus GTP binding protein 1 Bos taurus Sad1 and UNC84 domain containing 2 |
|
| chr12 | 22800001:22900000 | 42 | rs134078558 | rs135218498 | 0.014090239 | LHFP | Bos taurus lipoma HMGIC fusion partner | |
| C22:5 n-3 | chr2 | 11700001:11800000 | 31 | rs134430461 | rs109568935 | 0.012031548 | ||
| chr5 | 36200001:36300000 | 20 | rs137189970 | rs134607051 | 0.011137951 | TMEM117 | Bos taurus transmembrane protein 117 | |
| chr9 | 47500001:47600000 | 19 | rs137052587 | rs137140432 | 0.024563868 |
Saturated fatty acids
We detected a total of 16 candidate regions that explain more than 1% of genetic variance for saturated fatty acids. These regions were distributed on BTA2, BTA4, BTA6, BTA7, BTA12, BTA14, BTA15, BTA19, BTA22, BTA23 and BTA25 (Table 2). Among them, we found four, three and nine candidate regions for C14:0, C18:0 and C20:0, respectively (Additional file 2). Intriguingly, the detected window with the largest genetic variance (10.04%) near 51.3 Mb on BTA19 for C14:0, containing gene fatty acid synthase (FASN) that is related to fatty acid synthesis. We also found one region explaining about 1.46% of genetic variance for C14:0 and located at 25.1 Mb on BTA23. This region overlapped with the elongation of very long chain fatty acids protein 5 (ELOVL5) whose function involves in fatty acid elongase activity (Fig. 2). In addition, we identified 10 candidate genes that are likely to be related to fatty acids composition embedded in these candidate regions (Table 2).
Fig. 2.
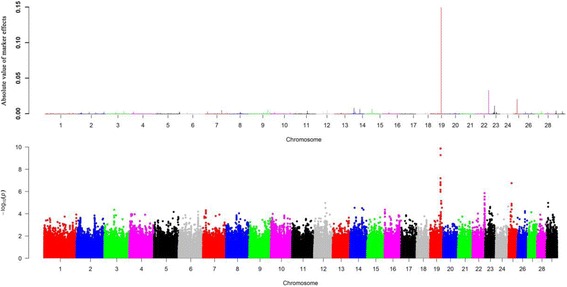
a Manhattan plot of absolute value of SNP effects estimated using BayesB for C14:0. b Manhattan plots showing P-values of association for each SNP using the GRAMMAR-GC, where the y-axis was defined as -Log 10 (P)
Monounsaturated fatty acids
For monounsaturated fatty acids, we detected 8 candidate regions, each of which captured more than 1% of the total genetic variance across six chromosomes (Additional file 3). Notably, we detected the same region at 51.3 Mb on BTA19 overlapping with FASN, which explains 6.49% of the genetic variance for C14:1 cis-9 (Fig. 3), and this region was also associated with C14:0. The top associated region was detected near 30.3 Mb on BTA14, which explains 19.44% of genetic variance for C18:1 cis-9 (Fig. 4), while no known gene was observed near this region. Overall, there are three, two and three regions identified to be associated with C14:1 cis-9, C16:1 cis-9 and C18:1 cis-9, respectively (Table 3).
Fig. 3.

a Manhattan plot of absolute values of SNP effects estimated using BayesB for C14:1 cis-9. b Manhattan plots showing P-values of association for each SNP using the GRAMMAR-GC, where the y-axis was defined as -Log 10 (P)
Fig. 4.
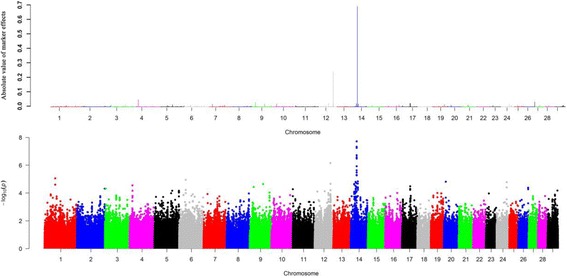
a Manhattan plot of absolute values of SNP effects estimated using BayesB for C18:1 cis-9. b Manhattan plots showing P-values of association for each SNP using GRAMMAR-GC, where the y-axis was defined as -Log 10 (P)
Polyunsaturated fatty acids
We detected 11 associated regions for five polyunsaturated fatty acids, including C18:2 n-6, C18:3 n-3, C20:3 n-3, C20:5 n-3 and C22:5 n-3 (Additional file 4). Of these regions, we observed one candidate region for C18:3 n-3 that was located at BTA14, two regions associated with C18:2 n-6 at BTA4 and BTA20, two regions associated with C20:3 n-3 at BTA4 and BTA17, three regions associated with C20:5 n-3 at BTA3, 5, 12, and three regions associated with C22:5 n-3 at BTA2, 5, 9 respectively (Table 3). Notably, we found 12 genes imbedded in the identified regions and these genes were likely involved in the function of fatty acid synthesis and metabolism. Of these 12 genes, two genes were associated with C18:2 n-6, three genes with C20:3 n-3, six genes with C20:5 n-3, and one gene with C22:5 n-3, respectively. The top four regions explaining more than 2% of the genetic variance were identified at BTA20 associated with C18:2 n-6 (4.95%), BTA14 with C18:3 n-3 (2.83%), BTA9 with C22:5 n-3 (2.46%) and BTA4 with C18:2 n-6 (2.33%).
Fatty acid groups
To systematically explore the genetic mechanism underlying fatty acid composition beyond individual fatty acid, we also conducted GWAS using BayesB method on eight fatty acid groups, including SFA, MUFA, PUFA, PUFA/SFA, n-3, n-6, n-6/n-3, and HI (Additional file 5). We found three associated regions for HI located at BTA4, BTA10 and BTA15, two regions for MUFA at BTA12 and BTA14, one for n-3 at BTA4 and one for n-6/n-3 at BTA20 (Table 4). Intriguingly, we observed two regions accounting for ~10% of the genetic variance for MUFA, while two regions located at BTA4 and BTA20 accounting for 1.25% and 4.66% of genetic variance for n-3 and n-6/n-3, respectively. One region located at BTA12 overlapped with two genes claudin 10 (CLDN10) and DAZ interacting zinc finger protein 1 (DZIP1). For health index (HI), the genetic variances contributed by three identified regions were 1.52%, 1.19% and 2.03%, which located at BTA4, BTA10 and BTA15, respectively. These regions overlapped with sarcoglycan epsilon (SGCE), paternally expressed 10 (PEG10) and DEAD-box helicase 10 (DDX10).
Table 4.
Genomic regions associated with the fatty acid groups in Chinese Simmental cattle using BayesB method
| FA Trait | Chr | Associated Window | nSNP | rs_ID_start | rs_ID_end | Genetic variance for 100 kb window | Positional/putative candidate gene | Gene name |
|---|---|---|---|---|---|---|---|---|
| MUFA | chr14 | 30300001:30400000 | 27 | rs135047094 | rs41733749 | 0.09885106 | ||
| chr12 | 76800001:76900000 | 43 | rs42705033 | rs133235260 | 0.104124564 |
CLDN10
DZIP1 |
Bos taurus claudin 10 Bos taurus DAZ interacting zinc finger protein 1 |
|
| n-3 | chr4 | 89200001:89300000 | 28 | rs110084128 | rs133410381 | 0.012452369 | ||
| n-6/n-3 | chr20 | 22500001:22600000 | 26 | rs110568039 | rs137611969 | 0.046649777 | ||
| HI | chr15 | 18900001:19000000 | 34 | rs134293788 | rs110280875 | 0.020338987 | DDX10 | Bos taurus DEAD-box helicase 10 |
| chr4 | 11900001:12000000 | 26 | rs137053488 | rs110825076 | 0.015207173 |
SGCE
PEG10 |
Bos taurus sarcoglycan epsilon Bos taurus paternally expressed 10 |
|
| chr10 | 8200001:8300000 | 28 | rs136862543 | rs137767957 | 0.011854547 |
Identification of associated loci using GRAMMAR-GC
We further conducted GWAS using GRAMMAR-GC implemented in GenABEL package for 11 individual fatty acids and eight fatty acid groups, each of which has a genomic heritability of high than 0.10. To ensure the power and accuracy of GWAS for these traits, we utilized genomic control approach to correct for possible population stratifications in GRAMMAR-GC test. After this correction, we found the inflation factor λ was close to one, suggesting that our approach has successfully accounted for population stratification, and thus no further adjustment was required. We identified a total of 44 and 8 significant SNPs associated with nine fatty acid composition and two fatty acid groups, respectively. The suggestive P value (0.05/163,473 = 3.06E-7) was used as the cut off threshold for significance, which approximately considered the number of “independent” SNPs by counting 1 SNP per LD block, plus all SNPs outside of blocks (interblock SNPs). We observed 14, 5, 8, 1, 3, 4, 3, 3 and 3 significant associated SNPs surpassing the suggestive threshold (P <3.06E-7) for C14:0, C14:1 cis-9, C18:1 cis-9, C18:3 n-6, C20:0, C20:1 cis-11, C20:2 n-6, C20:4 n-6 and C18:2 t-9c-11, respectively. The top four significant SNPs for C14:0 (P =1.39E-10) were located at 51.3 Mb on BTA19. Totally, we identified 17 associated SNPs for saturated fatty acid (C14:0 and C20:0), 17 SNPs for monounsaturated fatty acids (C14:1 cis-9, C18:1 cis-9 and C20:1 cis-11), 10 SNPs for polyunsaturated fatty acids (C18:3 n-6, C20:2 n-6, C20:4 n-6 and C18:2 t-9c-11). Notably, we found the majority of SNPs were located at BTA19 (18 SNPs) and BTA14 (19 SNPs), which indicated these regions are potential candidate for fatty acid composition. Fig. 2, 3 and 4 show the genome-wide plots of C14:0, C14:1 cis-9 and C18:1 cis-9 for P-values and the absolute values of marker effects against the genomic position. We found one associated SNP located at 51.3 Mb on BTA19 for both C14:0 and C14:1 cis-9 (P = 5.19E-10 and P = 1.82E-07), and this SNP was also located at ~4 kb upstream of the FASN gene.
Region-based association test and LD analyses
To explore potential associated loci which might fail to be identified due to the strict threshold for high density SNPs, we investigated two 100 kb associated regions on BTA19 and BTA23 (BTA19:51.3–51.4 Mb and BTA23: 25.1–25.2 Mb) using region-based association tests implemented in R package FREGAT. The two regions contain two candidate genes FASN and EVOL5 involved in fatty acid synthesis. For the region at 51.3 Mb on BTA19, we found 19 SNPs showing significant association with C14:0 (P < 0.01), and among them, five SNPs were identified within FASN, and one SNP near FASN with the strongest association signal (P = 5.17E-10). We found that the P value for region-based test for FASN was 0.0048, which indicated that FASN may be considered as a candidate gene for C14:0. Moreover, the LD and haploblock analyses revealed that this region showed high LD level with multiple haploblocks, which may imply a potential selection signature involved in fatty acids within this region in Chinese Simmental cattle population (Fig. 5a). For region at 25.1 Mb on BTA23, two SNPs were detected with P < 0.01, and the top SNP (BovineHD2300006955) was detected at 25.1 Mb showing significant association (P = 3.1E-5). This region partly overlapped with gene ELVOL5. Therefore, we next examined the 500 kb upstream and downstream of the region. However, no other SNPs were found which were significantly associated with C14:0 (Fig. 5b).
Fig. 5.

Regional plots of the two major candidate regions on BTA19 and BTA23. Results were shown for C14:0 at 50.8-51.8 Mb on BTA19 (a) and for C20:0 around 24.6-25.6 Mb on BTA23 (b). In the upper panels, the top SNPs were highlighted by blue solid circles. Different levels of linkage disequilibrium (LD) between the lead SNP and surrounding SNPs were indicated in different colors
Genomic prediction for fatty acid composition
We performed genomic selection for fatty acid composition using GBLUP and BayesB. The predictive accuracies ranged from 0.03 (C18:2 t-12c-10) to 0.51 (C18:3 n-3) using GBLUP, and from 0.1 (C18:2 t-9c-11) to 0.53 (C14:0) using BayesB. The averaged predictive accuracies across all fatty acids using GBLUP and BayesB were 0.24 and 0.29, respectively. These results suggested that genomic prediction using BayesB was slightly superior over GBLUP for fatty acids in Chinese Simmental cattle.
For each individual fatty acid trait, we found that the relatively high predictive accuracies were achieved for C14:0, C22:0, C14:1 cis-9, C18:3 n-3, C20:3 n-3 for both GBLUP and BayesB. Despite the fact that BayesB performed at least as well as GBLUP for most traits, we indeed found some traits where BayesB showed much higher predictive accuracies than GBLUP, such as C14:0 (0.48 for GBLUP and 0.53 for BayesB), C18:0 (0.17 vs. 0.24), C24:0 (0.11 vs. 0.23), C18:2 t-12c-10 (0.03 vs. 0.12), C18:3 n-6 (0.05 vs. 0.13), C20:2 n-6 (0.07 vs. 0.14) (Table 5). To investigate possible bias between the predicated and observed breeding values, we also calculated the regression coefficient of genomic estimated breeding values on adjusted phenotypes (Table 5). Our results revealed that the average regression coefficients for GBLUP and BayesB were 0.71 and 0.93, indicating that BayesB is less biased than GBLUP because the latter has a regression coefficient closer to unity.
Table 5.
Predictive accuracy (±SE) and regression coefficients (±SE) of genomic breeding value prediction for fatty acid composition
| Trait | GBLUP | BayesB | ||
|---|---|---|---|---|
| r | b | r | b | |
| C14:0 | 0.48 ± 0.08 | 0.58 ± 0.05 | 0.53 ± 0.06 | 0.94 ± 0.08 |
| C16:0 | 0.36 ± 0.06 | 0.72 ± 0.13 | 0.39 ± 0.1 | 1.08 ± 0.21 |
| C18:0 | 0.17 ± 0.09 | 0.68 ± 0.15 | 0.24 ± 0.09 | 0.78 ± 0.19 |
| C20:0 | 0.39 ± 0.1 | 0.62 ± 0.18 | 0.42 ± 0.06 | 1.09 ± 0.18 |
| C22:0 | 0.45 ± 0.05 | 0.74 ± 0.11 | 0.48 ± 0.07 | 1.21 ± 0.28 |
| C24:0 | 0.11 ± 0.07 | 0.89 ± 0.13 | 0.23 ± 0.08 | 0.63 ± 0.14 |
| C14:1 cis-9 | 0.41 ± 0.06 | 0.81 ± 0.09 | 0.45 ± 0.08 | 1.02 ± 0.12 |
| C16:1 cis-9 | 0.16 ± 0.04 | 0.63 ± 0.22 | 0.2 ± 0.04 | 0.69 ± 0.23 |
| C18:1 cis-9 | 0.25 ± 0.08 | 0.72 ± 0.24 | 0.28 ± 0.06 | 1.25 ± 0.41 |
| C20:1 cis-11 | 0.16 ± 0.06 | 0.88 ± 0.15 | 0.18 ± 0.06 | 1.26 ± 0.24 |
| C18:2 n-6 | 0.15 ± 0.07 | 0.87 ± 0.19 | 0.18 ± 0.07 | 1.16 ± 0.15 |
| C18:2 t-9c-11 | 0.04 ± 0.08 | 1.07 ± 0.12 | 0.1 ± 0.06 | 0.71 ± 0.34 |
| C18:2 t-12c-10 | 0.03 ± 0.07 | 1.08 ± 0.14 | 0.12 ± 0.05 | 0.82 ± 0.32 |
| C18:3 n-6 | 0.05 ± 0.08 | 0.33 ± 0.25 | 0.13 ± 0.06 | 0.92 ± 0.12 |
| C18:3 n-3 | 0.51 ± 0.06 | 1.08 ± 0.17 | 0.53 ± 0.08 | 1.18 ± 0.21 |
| C20:2 n-6 | 0.07 ± 0.05 | 0.12 ± 0.11 | 0.14 ± 0.05 | 0.06 ± 0.21 |
| C20:3 n-3 | 0.42 ± 0.06 | 0.76 ± 0.28 | 0.47 ± 0.08 | 1.54 ± 0.62 |
| C20:4 n-6 | 0.26 ± 0.09 | 0.56 ± 0.17 | 0.31 ± 0.06 | 0.65 ± 0.32 |
| C20:5 n-3 | 0.16 ± 0.06 | 0. 40 ± 0.32 | 0.2 ± 0.09 | 0.96 ± 0.41 |
| C22:5 n-3 | 0.22 ± 0.05 | 0.45 ± 0.28 | 0.25 ± 0.07 | 0.83 ± 0.36 |
| C22:6 n-3 | 0.24 ± 0.06 | 0.51 ± 0.24 | 0.25 ± 0.05 | 0.89 ± 0.29 |
Discussion
Fatty acid is an important indicator of meat quality and taste, and its strongly influences consumer’s preferences [3, 38]. Previous genome-wide association studies have been conducted for fatty acid composition in multiple cattle breeds, including Angus, Japanese Black, Nellore and other crossbreds [8, 30, 32, 35, 36]. To our knowledge, this study is the first attempt to investigate molecular mechanism underling fatty acid composition using high density SNP array and evaluate the accuracy of genomic predictions in Chinese Simmental cattle population.
Genomic wide scan identified candidate regions and loci
We investigated 21 individual fatty acids including 6 saturated fatty acids, 4 monounsaturated fatty acids, 11 polyunsaturated fatty acids and 8 fatty acid groups. Despite the fact that single-SNP based GWAS methods have been widely used in many studies, these methods may not be powerful for studying the complex traits with low or moderate heritability. Due to the polygenic characteristics of fatty acid composition in cattle, GWAS using the Bayesian methods have enabled to identify many associated loci that have missed by the single-SNP regression approach [33, 35, 36]. BayesB has been widely used for GWAS of complex trait in farm animals [39–42]. In this study, we utilized BayesB and GRAMMAR-GC to identify candidate regions associated with fatty acids in Chinese Simmental cattle population. We detected a total of 35 candidate regions on 16 autosomes associated with fatty acid composition using BayesB. However, these identified regions may not include all potentially significant associated SNPs due to use of 100 kb window-based strategy in BayesB. Therefore, we conducted GWAS using the single locus GRAMMAR-GC method implemented in GenABLE package. With this approach, we detected a total of 44 and 8 significant associated SNPs for individual fatty acids and fatty acid groups using a suggestive adjust threshold. The suggested threshold was set to avoid overestimation of the significant SNPs caused by high LD level in the high density SNPs array [43]. In current study, we found a total of 24 candidate SNPs overlapping with these regions identified by BayesB. For instance, the same candidate peaks for C14:1, C14:1 cis-9 and C18:1 cis-9 were identified using both methods (Figs. 2–4). Utilization of multiple complementary methods is an effective way to detect candidate regions or SNPs and helps elucidate genetic architecture of complex traits in farm animals [33, 44].
Candidate genes for fatty acid composition
Several genes were identified as potential candidates contributing to the genetic architecture of fatty acids in this study. Among them, we observed FASN at 51 Mb on BTA19 overlapped with a 100 kb associated region, which explains 10% and 6.5% of the genetic variances for C14:0 and C14:1 cis-9, respectively. Notably, we also found multiple significant SNPs around this gene that were associated with C14:0 using the GRAMMAR-GC method. A region-based association test revealed strong evidence of association for multiple SNPs within this gene. Furthermore, we found strong LD at the upstream of FASN (Fig. 5). This gene encodes a multifunctional protein enzyme to catalyze the synthesis of palmitate (C16:0) from acetyl-CoA and malonyl-CoA, in the presence of NADPH. Previous studies based on candidate gene approaches had revealed polymorphisms within FASN that were related to fatty acid composition in multiple beef cattle populations [45–49] and milk fat content in dairy cattle [50, 51]. For instance, several studies were conducted to explore and evaluate the association between fatty acid composition and candidate SNPs using GWAS in Japanese beef cattle [8, 30, 52]. These studies provided multiple evidences that several SNPs near or within FASN may be regarded as responsible mutations for fatty acid composition and contribute largely to meat quality in the Japanese Black cattle population. Saatchi et al performed GWAS using BovineSNP50 in Angus beef cattle and reported FASN located at 51 Mb on BTA19 (from 51,384,922 to 51,403,614 bp) was associated with fatty acids [32]. Chen et al. found SNP rs41921177 (BTA19:51,326,750) located near FASN. This SNP rs41921177 had relative large effects on multiple fatty acids in both subcutaneous adipose and longissimus lumborum muscle tissues of crossbred beef cattle [33]. However, investigation of genetic architecture of fatty acids in the Nellore cattle showed no significant associations for several polymorphisms within or near FASN [35, 36]. Despite previous studies have indicated that FASN has a conserved role across genetic backgrounds, there are several different variants that may be responsible for the different FASN effects in different breeds, and different FASN alleles appear to be segregating in different populations [8, 49].
Another gene called ELOVL5 encodes a multi-pass membrane protein which is involved in the elongation of long-chain polyunsaturated fatty acids. This gene was identified in the associated region at 25.1 Mb on BTA23 accounting for 1.5% of the genetic variance for C14:1 cis-9. ELOVL5 plays an important role in de novo synthesis of specific MUFA species in mammalian cells, ELOVL5 knockdown decreased the elongation of C16:1 cis-9, n-7, and ELOVL5 overexpression increased synthesis of C18:1 cis-9, n-7 [53]. Also, previous study using mice models revealed that a reduced ELOVL5 activity can lead to hepatic steatosis, and endogenously synthesized PUFAs are critical regulators of fatty acid synthesis [54]. Lemos et al. reported a candidate region embedded in ELOVL5 can explain 4% of the genetic variance for C20:4 n-6 using ssGBLUP based on window association test in Nellore cattle [35]. The consistent role of ELOVL5 gene involved in fatty acid synthesis and composition was also extensively investigated in diverse pig populations [55–57].
Moreover, previous studies suggested that ELOVL5 are involved in the production of multiple acids including C16:0, C16:1, C18:0 and C18:1 in cattle [58]. Also, ELOVL5 was found associated with C20:1n9/C18:1n9 and C20:2n6/C18:2n6 in a F2 population derived from Erhulian pig [55]. As a result, ELOVL5 may have pleiotropic effects on multiple fatty acid composition and also appear to exhibit pleiotropic effects in multiple metabolic steps. However, we only identified ELOVL5 that was associated with C14:0 in Chinese Simmental cattle. In addition, several previous studies have suggested variants within SCD gene and the expression level of SCD gene should be significantly associated with fatty acids [18, 20, 30, 32, 47, 48, 59, 60], the SCD gene was not detected in this study, probably due to heterogeneous genetic architecture of fatty acids differ across different populations.
Genomic prediction for fatty acid composition
Previous studies have investigated predictive abilities of genomic selection for fatty acid composition in American Angus [32], Japanese Black cattle [61] and Canadian beef cattle [33]. In the current study, we explored, for the first time, genomic prediction for fatty acid composition in Chinese Simmental cattle. We found that the accuracies of genomic prediction for most of fatty acids were relatively low (<0.30) using both GBLUP and BayesB, which was consistent with a previous report by Chen et al. [33]. This finding may be explained by the relatively low and inaccurate estimates of heritability for the measured fatty acid composition [62]. Our studies also revealed that BayesB provided slightly higher average regression coefficients as compared to GBLUP. Considering the complex architecture of fatty acid composition, this finding implied that BayesB which allows a fraction of SNPs to be allocated with relatively large effects is superior over GBLUP which assumes the same genetic variance for each SNP. Fatty acid composition are commonly recognized as complex traits with a polygenic nature and, to some extent, they are difficult to measure, thus the application of genomic selection for fatty acids will be valuable in future selection breeding programs. With increasing public understanding of the relationships between diet and health, much attention should be paid to the studies of some important fatty acids related to human health [63]. As consumer become more health conscious, they have increased preference for better tasting and healthier products in their diet such as unsaturated fatty acid levels. Further investigation of causal mutations will promote our understanding of lipid metabolism, fat deposition and application of selection for fatty acids in cattle.
Conclusions
We identified several significant associated regions and loci as the potential candidate markers for genomics-assisted breeding programs. Using multiple methods, our results revealed that FASN and ELOVL5 associated with fatty acids with strong evidences. Our analyses also suggested that it is feasible to perform genomic selection for fatty acids in the Chinese Simmental cattle population.
Methods
Ethics statement
All animals used in the study were treated following the guidelines established by the Council of China Animal Welfare. Protocols of the experiments were approved by the Science Research Department of the Institute of Animal Sciences, Chinese Academy of Agricultural Sciences (CAAS) (Beijing, China).
Animals and phenotypes
A total of 723cattleborn between 2010 and 2013 were used in this study, and these cattle were originated from Ulgai, Xilingol League and Inner Mongolia of China. After weaning, the cattle were moved to JinweifurenCo.,Ltd for fattening, all animals sharing the same feeding and management conditions. More detailed description of breeding and management has been described previously [64, 65]. The cattle were slaughtered at an average of 20 months. During the period of slaughtering, we measured traits in strict accordance with the guidelines proposed by the Institutional Meat Purchase Specifications for fresh beef. Meat samples were removed from the longissimus lumborum (LL) muscleafter stored for 48 h between the 12th and 13th ribsfrom each animal, and then samples were vacuum packed and chilled at -80 °C. And approximate 10 g of sample were taken for subsequent fatty acid analyses. Total lipid was extracted from the sample according to protocols described previously [66]. About 2 mg extracted lipid was re-dissolved in 2 ml of n-hexane and 1 ml of KOH (0.4 M) for saponification and methylation. A total of 21 individual fatty acid composition were measured using gas chromatography (GC-2014 CAFsc, Shimadzu Scientific Instruments) including six saturated fatty acids, four monousaturated fatty acids, and eleven polyunsaturated fatty acids. Each fatty acid was quantified as a weight of percentage of total fatty acids. In addition, fatty acids were indexed as groups of saturated, monounsaturated, polyunsaturated fatty acid, total of saturated fatty acid (SFA), total monounsaturated (MUFA), total of polyunsaturated (PUFA), total of omega 3 (n-3) and total of omega 6 (n-6). The calculation of various fatty acid groups are described as follows: SFA = C14:0 + C16:0 + C18:0 + C20:0 + C22:0 + C24:0; MUFA = C14:1 cis-9 + C16:1 cis-9 + C18:1 cis-9 + C20:1 cis-11; PUFA = C18:2 n-6 + C18:2 t-9c-11 + C18:2 t-12c-10 + C18:3 n-6 + C18:3 n-3+ C20:2 n-6 + C20:3 n-3 + C20:4 n-6 + C20:5 n-3 + C22:5 n-3 + C22:6 n-3; n-3 = C18:3 n-3 + C20:3 n-3 + C20:5 n-3 + C22:5 n-3 + C22:6 n-3; n-6 = C18:2 n-6 + C18:3 n-6 + C20:2 n-6 + C20:4 n-6; PUFA/SFA: ratio between PUFA and SFA; n-6/n-3: ratio between n-6 and n-3; HI = (MUFA + PUFA)/(4 × C14:0 + C16:0).
Genotyping and quality control
In total, 723 Simmental cattle were genotyped for the Illumina BovineHD BeadChip. Before statistical analysis, SNPs were pre-processed using PLINK v1.07 [67]. SNPs were selected based on minor allele frequency (>0.05), proportion of missing genotypes (<0.05), and Hardy-Weinberg equilibrium (P > 10E-6). Moreover, individuals with more than 10% missing genotypes were excluded. After these quality controls, the final data consisted of 685 individuals and 595,715 autosomal SNPs.
Heritability and genetic correlation estimation
Phenotypic and genetic (co) variances of fatty acids were estimated using the pairwise bivariate animal model implemented in the ASReml v3.0 software package [68]. The model is
where y1 and y2 are vectors of phenotypic values of trait 1 and 2, respectively; ×1 and × 2 are incidence matrices for fixed effects; b 1 and b 2 are the vectors of the fixed effects; Z1 and Z2 are incidence matrices relating the phenotypic observations to vectors of the polygenic (a) effects for two traits; e 1 and e 2 are random residuals for two traits. The polygenic effects were treated as random and assumed to be mutually independent.
Variances of the random effects are defined as V(a) = G σ 2a for the polygenes and V(e) = I σ 2e for the residuals, where G is the additive genetic relationship matrix, I is the identity matrix, σ 2a is the additive genetic variance and σ 2e is the residual variance. Matrix G matrix was inferred from the SNP markers according to the study of VanRaden [69]. Fixed effects in the model included effects of gender, farm and year. In addition, ages at slaughter, days between slaughter and fatty acid extraction, hot carcass weight and marbling score were considered as covariates in the model. Genomic heritability of each trait was estimated using
Pairwise bivariate analyses were performed for each combination of fatty acids to estimate the (co) variance components, phenotypic and genetic correlations as well as the heritability.
Genome-wide association study using BayesB
Fatty acid composition was adjusted for fixed effects and covariates using a linear mixed model, and fixed effects and covariates were defined above. We conducted genome-wide association analyses using BayesB, which analyzed all autosomal SNP simultaneously and assumed different genetic variance for each SNP [40, 70]. The model is described as follows,
| 1 |
where y i is the adjusted phenotypic value for the i th individual, u is the mean (after removing fixed effects and all covariants), M is the number of SNP loci, Z ij is the j th SNP genotype of animal i coded as the number of B alleles in the genotype, α j is the average effect of allele substitution for SNP j, and is assumed to be normally distributed N (0, σ 2j), δ j is an indicator variable to show the presence (δ j = 1) and absence (δ j = 0) of marker j, and the presence is given a prior probability, and e i is the residual error with an assumed normal distribution N (0, σ 2e). The prior distribution of variance σ 2j (or σ 2e) is assumed to be a scaled inverse Chi-square with degrees of freedom v α = 4 (or v e = 10) and scale parameter S 2α (or S 2e). The scale parameter was usually derived from an assumed additive-genetic variance [71]. π was set to 0.9998, which meant that about 100–150 SNPs were fitted simultaneously in each MCMC iteration. The Markov chains were run for 50,000 cycles of iterations with the first 10,000 iterations being discarded as burn-in followed by additional 40,000 iterations to form the posterior sample. All SNPs effects were estimated from the posterior sample. We performed GWAS for all the 21 fatty acids but only reported the results for the traits with genomic heritability ≥ 0.10. We inferred the associations for fatty acids using a 100 kb window rather than single marker [35, 36]. There were 24,900 SNP windows across the 29 autosomes. The variance for each window was estimated using the genetic value of all adjacent SNPs within 100 kb window, and proportion of genetic variance explained by each window was obtained by dividing the variance of window breeding value by the variance of the whole genome breeding value. Genome windows with the highest posterior mean proportion of genetic variance ≥1% were considered as the most important regions associated with the traits. Positional candidate genes were investigated for the 100 kb windows using the UCSC Genome Browser, which allowed visualization of SNP based on the Bos taurus genome assembly UMD 3.1.
Genome wide association study using GRAMMAR
We also performed genome-wide association study using GRAMMAR-GC implemented in an R package GenABEL v1.8-0 [72]. The method accounts for population stratification and covariance structure of individuals inferred from all by SNPs. Bonferroni corrected threshold of 8.39E-08 (0.05/595,715) was adopted for the top 5% genome-wide significance. This correction was highly conservative for GWAS using high density SNPs array. To avoid the “overcorrection” for SNPs that may not truly independent due to LD across genome, we used a suggestive P value (P = 0.05/163,473) as thresholds proposed by Duggal et al., considering approximate the number of “independent” SNPs by counting 1 SNP per LD block, plus all SNPs outside of the LD blocks (interblock SNPs) [43].
Region-based association test and haploblock analyses
Region-based association test is a more powerful approach of gene mapping than the association test of an individual genetic variant. In this study, we performed the region-based association test for several target 100 kb regions identified using BayesB. SNPs in these regions and the adjusted fatty acid composition were investigated with this region-based association test using R package FREGAT [73]. The LD of these regions were estimated using PLINK v1.7 software [67].
Genomic prediction
Genomic best linear unbiased prediction (GBLUP) and BayesB were used for genomic prediction. Five-fold cross validation was used to evaluate the accuracy of genomic prediction. The data were split into five approximately equal-sized groups. For each cross validation, four groups were used as the training sample to estimate parameters and the remaining group was used as the test sample. The linear model is written as,
| 2 |
where y is the vector of adjusted phenotypic values in the training sample, μ is the overall mean, a is the vector of breeding values for all animals, e is the vector of residuals errors and Z is the incidence matrix for the random effects. For the BayesB, SNP effects were estimated based on the training population using the statistical model described in the GWAS analyses. The GEBV for animal i in the validation population was predicted by summing up SNP effects over all loci as follows: GEBV i = ∑Mj = 1 Z ij α j, where α j is the estimated effect for SNP j. Predictive accuracy was measured as the correlation between the estimated breeding values and the adjusted phenotypic values divided by the square root of heritability separately for each of the 5-fold cross-validation replicates.
Additional files
Estimates of phenotypic correlations (upper diagonals) and genetic correlation (lower diagonals) between 21 phenotypes in Chinese Simmental beef cattle. (DOCX 19 kb)
Summary statistics of the 100 kb regions for 3 saturated fatty acids. Results include trait name, chromosome, 100 kb windows on the UMD3.1 genome assembly, window variances, and percentage of genetic variance using BayesB. (CSV 2102 kb)
Summary statistics of the100 kb regions for three monounsaturated fatty acids (MUFA). Results include trait name, chromosome, 100 kb windows on the UMD3.1 genome assembly, window variances, and percentage of total genetic variance using BayesB. (CSV 2074 kb)
Summary statistics of the 100 kb regions for five polyunsaturated fatty acids (PUFA). Results include trait name, chromosome, 100 kb windows on the UMD3.1 genome assembly, window variances, and percentage of genetic variance using BayesB. (CSV 2967 kb)
Summary statistics of 100 kb regions for four fatty acid groups. Results include trait name, chromosome, 100 kb windows on the UMD3.1 genome assembly, window variances, and percentage of genetic variance using BayesB. (CSV 2520 kb)
Acknowledgments
The authors would like to thank Shizhong Xu and George Liu for proofreading, and all staff at the cattle experimental unit in Beijing and Ulagai for animal care and sample collection.
Funding
This study was supported by the National High Technology Research and Development Program of China (863 Program 2013AA102505-4), Cattle Breeding Innovative Research Team (cxgc-ias-03), Chinese Academy of Agricultural Sciences Foundation (2014ywf-yb-4), Beijing City Board of Education Foundation (PXM2016_014207_000012) and the National Natural Science Foundations of China (31372294 and 31472079) for the design of the study and collection. The project was also partly supported by Chinese Academy of Agricultural Sciences of Technology Innovation Project-Cattle Breeding (ASTIP-IAS03 and ASTIP-IAS-TS-9) for the data analysis and interpretation of the study. L.Y.X was supported by the Elite Youth Program in Chinese Academy of Agricultural Sciences.
Availability of data and materials
Datasets are available from the Dryad Digital Repository (doi:10.5061/dryad.4qc06).
Authors’ contributions
JYL and LYX conceived and designed the study. BZ and LYX performed statistical analyses. BZ and LYX wrote the paper. BZ, LYX, HJG, ZZW and YHL participated in data analyses. HN, XG, WGZ, LG, YC and PG carried out quantification of fatty acids. LPZ, YG and HMN participated in the design of the study and contributed to acquisition of data. LYX performed SNP and gene annotation. All authors read, commented and approved the final manuscript.
Competing interests
The authors declare that they have no competing interests.
Consent for publication
Not applicable.
Ethics approval and consent to participate
All animals used in the study were treated following the guidelines for the experimental animals established by the Council of China Animal Welfare. Protocols of the experiments were approved by the Science Research Department of the Institute of Animal Sciences, Chinese Academy of Agricultural Sciences (CAAS) (Beijing, China). Blood and meat samples from Chinese Simmental cattle were collected with consent of the Jinweifuren Co., Ltd (BeiJing).
Publisher’s Note
Springer Nature remains neutral with regard to jurisdictional claims in published maps and institutional affiliations.
Abbreviations
- BTA
Bos taurus chromosome
- GBLUP
Genomic best linear unbiased prediction
- GWAS
Genome-wide association study
- HI
Health index
- MUFA
Sum of monounsaturated fatty acids
- n-3
Sum of omega 3 acids
- n-6
Total of omega 6 acids
- n-6/n-3
Ratio between n-6 and n-3 PUFA
- PUFA
Sum of polyunsaturated fatty acid
- QTL
Quantitative trait loci
- SE
Standard error
- SFA
Sum of saturated fatty acids
- SNP
Single nucleotide polymorphism
Footnotes
Electronic supplementary material
The online version of this article (doi:10.1186/s12864-017-3847-7) contains supplementary material, which is available to authorized users.
Contributor Information
Bo Zhu, Email: zhubo525@126.com.
Hong Niu, Email: nhnh0304@126.com.
Wengang Zhang, Email: zhangwengang_19@sina.com.
Zezhao Wang, Email: wangzezhao1@163.com.
Yonghu Liang, Email: yonghul1990@sina.com.
Long Guan, Email: guanlong82@163.com.
Peng Guo, Email: super_guopeng@163.com.
Yan Chen, Email: chenyan0204@163.com.
Lupei Zhang, Email: zhanglupei@caas.cn.
Yong Guo, Email: y63guo@126.com.
Heming Ni, Email: nihemin@aliyun.com.
Xue Gao, Email: gaoxue76@126.com.
Huijiang Gao, Email: gaohj111@sina.com.
Lingyang Xu, Phone: 86-10-62812769, Email: xulingyang@163.com.
Junya Li, Phone: 86-10-62812769, Email: jl1@iascaas.net.cn.
References
- 1.Woodside JV, Kromhout D. Fatty acids and CHD. Proc Nutr Soc. 2005;64(4):554–564. doi: 10.1079/PNS2005465. [DOI] [PubMed] [Google Scholar]
- 2.Wood JD, Enser M, Fisher AV, Nute GR, Sheard PR, Richardson RI, Hughes SI, Whittington FM. Fat deposition, fatty acid composition and meat quality: a review. Meat Sci. 2008;78(4):343–358. doi: 10.1016/j.meatsci.2007.07.019. [DOI] [PubMed] [Google Scholar]
- 3.Vahmani P, Mapiye C, Prieto N, Rolland DC, McAllister TA, Aalhus JL, Dugan ME. The scope for manipulating the polyunsaturated fatty acid content of beef: a review. J Anim Sci Biotechnol. 2015;6(1):29. doi: 10.1186/s40104-015-0026-z. [DOI] [PMC free article] [PubMed] [Google Scholar]
- 4.Venkata Reddy B, Sivakumar AS, Jeong DW, Woo YB, Park SJ, Lee SY, Byun JY, Kim CH, Cho SH, Hwang I. Beef quality traits of heifer in comparison with steer, bull and cow at various feeding environments. Anim Sci J. 2015;86(1):1–16. doi: 10.1111/asj.12266. [DOI] [PubMed] [Google Scholar]
- 5.Pitchford WS, Deland MP, Siebert BD, Malau-Aduli AE, Bottema CD. Genetic variation in fatness and fatty acid composition of crossbred cattle. J Anim Sci. 2002;80(11):2825–2832. doi: 10.2527/2002.80112825x. [DOI] [PubMed] [Google Scholar]
- 6.Ekine-Dzivenu C, Chen L, Vinsky M, Aldai N, Dugan ME, McAllister TA, Wang Z, Okine E, Li C. Estimates of genetic parameters for fatty acids in brisket adipose tissue of Canadian commercial crossbred beef steers. Meat Sci. 2014;96(4):1517–1526. doi: 10.1016/j.meatsci.2013.10.011. [DOI] [PubMed] [Google Scholar]
- 7.De Stefaan S, Katleen R, Daniel D. Meat fatty acid composition as affected by fatness and genetic factors: a review. Anim Res. 2004;53(2):81–98. doi: 10.1051/animres:2004003. [DOI] [Google Scholar]
- 8.Uemoto Y, Abe T, Tameoka N, Hasebe H, Inoue K, Nakajima H, Shoji N, Kobayashi M, Kobayashi E. Whole-genome association study for fatty acid composition of oleic acid in Japanese black cattle. Anim Genet. 2011;42(2):141–148. doi: 10.1111/j.1365-2052.2010.02088.x. [DOI] [PubMed] [Google Scholar]
- 9.Malau-Aduli AEO, Edriss MA, Siebert BD, Bottema CDK, Deland MPB, Pitchford WS. Estimates of genetic parameters for triacylglycerol fatty acids in beef castle at weaning and slaughter. J Anim Physiol Anim Nutr. 2000;83(4-5):169–180. doi: 10.1046/j.1439-0396.2000.00256.x. [DOI] [Google Scholar]
- 10.Nogi T, Honda T, Mukai F, Okagaki T, Oyama K. Heritabilities and genetic correlations of fatty acid compositions in longissimus muscle lipid with carcass traits in Japanese black cattle. J Anim Sci. 2011;89(3):615–621. doi: 10.2527/jas.2009-2300. [DOI] [PubMed] [Google Scholar]
- 11.Dekkers JC, Hospital F. The use of molecular genetics in the improvement of agricultural populations. Nat Rev Genet. 2002;3(1):22–32. doi: 10.1038/nrg701. [DOI] [PubMed] [Google Scholar]
- 12.Goddard ME, Hayes BJ. Mapping genes for complex traits in domestic animals and their use in breeding programmes. Nat Rev Genet. 2009;10(6):381–391. doi: 10.1038/nrg2575. [DOI] [PubMed] [Google Scholar]
- 13.Dunner S, Sevane N, Garcia D, Leveziel H, Williams JL, Mangin B, Valentini A. Genes involved in muscle lipid composition in 15 European Bos taurus breeds. Anim Genet. 2013;44(5):493–501. doi: 10.1111/age.12044. [DOI] [PubMed] [Google Scholar]
- 14.Barton L, Kott T, Bures D, Rehak D, Zahradkova R, Kottova B. The polymorphisms of stearoyl-CoA desaturase (SCD1) and sterol regulatory element binding protein-1 (SREBP-1) genes and their association with the fatty acid profile of muscle and subcutaneous fat in Fleckvieh bulls. Meat Sci. 2010;85(1):15–20. doi: 10.1016/j.meatsci.2009.11.016. [DOI] [PubMed] [Google Scholar]
- 15.Han C, Vinsky M, Aldai N, Dugan ME, McAllister TA, Li C. Association analyses of DNA polymorphisms in bovine SREBP-1, LXRalpha, FADS1 genes with fatty acid composition in Canadian commercial crossbred beef steers. Meat Sci. 2013;93(3):429–436. doi: 10.1016/j.meatsci.2012.10.006. [DOI] [PubMed] [Google Scholar]
- 16.Hoashi S, Hinenoya T, Tanaka A, Ohsaki H, Sasazaki S, Taniguchi M, Oyama K, Mukai F, Mannen H. Association between fatty acid compositions and genotypes of FABP4 and LXR-alpha in Japanese black cattle. BMC Genet. 2008;9:84. doi: 10.1186/1471-2156-9-84. [DOI] [PMC free article] [PubMed] [Google Scholar]
- 17.Hoashi S, Ashida N, Ohsaki H, Utsugi T, Sasazaki S, Taniguchi M, Oyama K, Mukai F, Mannen H. Genotype of bovine sterol regulatory element binding protein-1 (SREBP-1) is associated with fatty acid composition in Japanese black cattle. Mamm Genome. 2007;18(12):880–886. doi: 10.1007/s00335-007-9072-y. [DOI] [PubMed] [Google Scholar]
- 18.Ohsaki H, Tanaka A, Hoashi S, Sasazaki S, Oyama K, Taniguchi M, Mukai F, Mannen H. Effect of SCD and SREBP genotypes on fatty acid composition in adipose tissue of Japanese black cattle herds. Anim Sci J. 2009;80(3):225–232. doi: 10.1111/j.1740-0929.2009.00638.x. [DOI] [PubMed] [Google Scholar]
- 19.Zhang S, Knight TJ, Reecy JM, Wheeler TL, Shackelford SD, Cundiff LV, Beitz DC. Associations of polymorphisms in the promoter I of bovine acetyl-CoA carboxylase-alpha gene with beef fatty acid composition. Anim Genet. 2010;41(4):417–420. doi: 10.1111/j.1365-2052.2009.02006.x. [DOI] [PubMed] [Google Scholar]
- 20.Taniguchi M, Utsugi T, Oyama K, Mannen H, Kobayashi M, Tanabe Y, Ogino A, Tsuji S. Genotype of stearoyl-CoA desaturase is associated with fatty acid composition in Japanese black cattle. Mamm Genome. 2004;15. [DOI] [PubMed]
- 21.Orru L, Cifuni GF, Piasentier E, Corazzin M, Bovolenta S, Moioli B. Association analyses of single nucleotide polymorphisms in the LEP and SCD1 genes on the fatty acid profile of muscle fat in Simmental bulls. Meat Sci. 2010;87(4):344–348. doi: 10.1016/j.meatsci.2010.11.009. [DOI] [PubMed] [Google Scholar]
- 22.Morris CA, Bottema CD, Cullen NG, Hickey SM, Esmailizadeh AK, Siebert BD, Pitchford WS. Quantitative trait loci for organ weights and adipose fat composition in jersey and Limousin back-cross cattle finished on pasture or feedlot. Anim Genet. 2010;41(6):589–596. doi: 10.1111/j.1365-2052.2010.02058.x. [DOI] [PubMed] [Google Scholar]
- 23.Alexander LJ, Macneil MD, Geary TW, Snelling WM, Rule DC, Scanga JA. Quantitative trait loci with additive effects on palatability and fatty acid composition of meat in a Wagyu-Limousin F2 population. Anim Genet. 2007;38(5):506–513. doi: 10.1111/j.1365-2052.2007.01643.x. [DOI] [PubMed] [Google Scholar]
- 24.Gutierrez-Gil B, Wiener P, Richardson RI, Wood JD, Williams JL. Identification of QTL with effects on fatty acid composition of meat in a Charolais x Holstein cross population. Meat Sci. 2010;85(4):721–729. doi: 10.1016/j.meatsci.2010.03.031. [DOI] [PubMed] [Google Scholar]
- 25.Bolormaa S, Hayes BJ, Savin K, Hawken R, Barendse W, Arthur PF, Herd RM, Goddard ME. Genome-wide association studies for feedlot and growth traits in cattle. J Anim Sci. 2011;89(6):1684–1697. doi: 10.2527/jas.2010-3079. [DOI] [PubMed] [Google Scholar]
- 26.Bolormaa S, Pryce JE, Reverter A, Zhang Y, Barendse W, Kemper K, Tier B, Savin K, Hayes BJ, Goddard ME. A multi-trait, meta-analysis for detecting pleiotropic polymorphisms for stature, fatness and reproduction in beef cattle. PLoS Genet. 2014;10(3):e1004198. doi: 10.1371/journal.pgen.1004198. [DOI] [PMC free article] [PubMed] [Google Scholar]
- 27.Wu X, Fang M, Liu L, Wang S, Liu J, Ding X, Zhang S, Zhang Q, Zhang Y, Qiao L, et al. Genome wide association studies for body conformation traits in the Chinese Holstein cattle population. BMC Genomics. 2013;14:897. doi: 10.1186/1471-2164-14-897. [DOI] [PMC free article] [PubMed] [Google Scholar]
- 28.Abo-Ismail MK, Vander Voort G, Squires JJ, Swanson KC, Mandell IB, Liao X, Stothard P, Moore S, Plastow G, Miller SP. Single nucleotide polymorphisms for feed efficiency and performance in crossbred beef cattle. BMC Genet. 2014;15:14. doi: 10.1186/1471-2156-15-14. [DOI] [PMC free article] [PubMed] [Google Scholar]
- 29.Cole JB, Wiggans GR, Ma L, Sonstegard TS, Lawlor TJ, Jr, Crooker BA, Van Tassell CP, Yang J, Wang S, Matukumalli LK, et al. Genome-wide association analysis of thirty one production, health, reproduction and body conformation traits in contemporary U.S. Holstein cows. BMC Genomics. 2011;12:408. doi: 10.1186/1471-2164-12-408. [DOI] [PMC free article] [PubMed] [Google Scholar]
- 30.Ishii A, Yamaji K, Uemoto Y, Sasago N, Kobayashi E, Kobayashi N, Matsuhashi T, Maruyama S, Matsumoto H, Sasazaki S, et al. Genome-wide association study for fatty acid composition in Japanese black cattle. Anim Sci J. 2013;84(10):675–682. doi: 10.1111/asj.12063. [DOI] [PubMed] [Google Scholar]
- 31.Kelly MJ, Tume RK, Fortes M, Thompson JM. Whole-genome association study of fatty acid composition in a diverse range of beef cattle breeds. J Anim Sci. 2014;92(5):1895–1901. doi: 10.2527/jas.2013-6901. [DOI] [PubMed] [Google Scholar]
- 32.Saatchi M, Garrick DJ, Tait RG, Jr, Mayes MS, Drewnoski M, Schoonmaker J, Diaz C, Beitz DC, Reecy JM. Genome-wide association and prediction of direct genomic breeding values for composition of fatty acids in angus beef cattle. BMC Genomics. 2013;14:730. doi: 10.1186/1471-2164-14-730. [DOI] [PMC free article] [PubMed] [Google Scholar]
- 33.Chen L, Ekine-Dzivenu C, Vinsky M, Basarab J, Aalhus J, Dugan MER, Fitzsimmons C, Stothard P, Li C. Genome-wide association and genomic prediction of breeding values for fatty acid composition in subcutaneous adipose and longissimus lumborum muscle of beef cattle. BMC Genet. 2015;16(1):1–15. doi: 10.1186/1471-2164-16-S12-S1. [DOI] [PMC free article] [PubMed] [Google Scholar]
- 34.Ahlberg CM, Schiermiester LN, Howard TJ, Calkins CR, Spangler ML. Genome wide association study of cholesterol and poly- and monounsaturated fatty acids, protein, and mineral content of beef from crossbred cattle. Meat Sci. 2014;98(4):804–814. doi: 10.1016/j.meatsci.2014.07.030. [DOI] [PubMed] [Google Scholar]
- 35.Lemos MVA, Chiaia HLJ, Berton MP, Feitosa FLB, Aboujaoud C, Camargo GMF, Pereira ASC, Albuquerque LG, Ferrinho AM, Mueller LF, et al. Genome-wide association between single nucleotide polymorphisms with beef fatty acid profile in Nellore cattle using the single step procedure. BMC Genomics. 2016;17(1):1–16. doi: 10.1186/s12864-016-2511-y. [DOI] [PMC free article] [PubMed] [Google Scholar]
- 36.Cesar ASM, Regitano LCA, Mourao GB, Tullio RR, Lanna DPD, Nassu RT, Mudado MA, Oliveira PSN, do Nascimento ML, Chaves AS, et al. Genome-wide association study for intramuscular fat deposition and composition in Nellore cattle. BMC Genet. 2014;15(1):1–15. doi: 10.1186/1471-2156-15-39. [DOI] [PMC free article] [PubMed] [Google Scholar]
- 37.Fernandes Júnior GA, Rosa GJM, Valente BD, Carvalheiro R, Baldi F, Garcia DA, Gordo DGM, Espigolan R, Takada L, Tonussi RL, et al. Genomic prediction of breeding values for carcass traits in Nellore cattle. Genet Sel Evol. 2016;48(1):1–8. doi: 10.1186/s12711-016-0188-y. [DOI] [PMC free article] [PubMed] [Google Scholar]
- 38.Kallas Z, Realini CE, Gil JM. Health information impact on the relative importance of beef attributes including its enrichment with polyunsaturated fatty acids (omega-3 and conjugated linoleic acid) Meat Sci. 2014;97(4):497–503. doi: 10.1016/j.meatsci.2014.03.015. [DOI] [PubMed] [Google Scholar]
- 39.Daetwyler HD, Pong-Wong R, Villanueva B, Woolliams JA. The impact of genetic architecture on genome-wide evaluation methods. Genetics. 2010;185(3):1021–1031. doi: 10.1534/genetics.110.116855. [DOI] [PMC free article] [PubMed] [Google Scholar]
- 40.Habier D, Fernando RL, Kizilkaya K, Garrick DJ. Extension of the bayesian alphabet for genomic selection. BMC Bioinformatics. 2011;12:186. doi: 10.1186/1471-2105-12-186. [DOI] [PMC free article] [PubMed] [Google Scholar]
- 41.Gao N, Li J, He J, Xiao G, Luo Y, Zhang H, Chen Z, Zhang Z. Improving accuracy of genomic prediction by genetic architecture based priors in a Bayesian model. BMC Genet. 2015;16:120. doi: 10.1186/s12863-015-0278-9. [DOI] [PMC free article] [PubMed] [Google Scholar]
- 42.Wimmer V, Lehermeier C, Albrecht T, Auinger H-J, Wang Y, Schon C-C. Genome-wide prediction of traits with different genetic architecture through efficient variable selection. Genetics. 2013;195(2):573–587. doi: 10.1534/genetics.113.150078. [DOI] [PMC free article] [PubMed] [Google Scholar]
- 43.Duggal P, Gillanders EM, Holmes TN, Bailey-Wilson JE. Establishing an adjusted p-value threshold to control the family-wide type 1 error in genome wide association studies. BMC Genomics. 2008;9:516. doi: 10.1186/1471-2164-9-516. [DOI] [PMC free article] [PubMed] [Google Scholar]
- 44.Ros-Freixedes R, Gol S, Pena RN, Tor M, Ibanez-Escriche N, Dekkers JC, Estany J. Genome-wide association study singles Out SCD and LEPR as the Two main loci influencing intramuscular Fat content and fatty acid composition in Duroc pigs. PLoS One. 2016;11(3):e0152496. doi: 10.1371/journal.pone.0152496. [DOI] [PMC free article] [PubMed] [Google Scholar]
- 45.Oh D, Lee Y, La B, Yeo J, Chung E, Kim Y. Fatty acid composition of beef is associated with exonic nucleotide variants of the gene encoding FASN. Mol Biol Rep. 2012;39(4):4083–4090. [DOI] [PubMed]
- 46.Narukami T, Sasazaki S, Oyama K, Nogi T, Taniguchi M, Mannen H. Effect of DNA polymorphisms related to fatty acid composition in adipose tissue of Holstein cattle. Anim Sci J. 2011;82(3):406–411. [DOI] [PubMed]
- 47.Li C, Aldai N, Vinsky M, Dugan MER, McAllister TA. Association analyses of single nucleotide polymorphisms in bovine stearoyl-CoA desaturase and fatty acid synthase genes with fatty acid composition in commercial cross-bred beef steers. Anim Genet. 2012;43(1):93–97. [DOI] [PubMed]
- 48.Yokota S, Sugita H, Ardiyanti A, Shoji N, Nakajima H, Hosono M. Contributions of FASN and SCD gene polymorphisms on fatty acid composition in muscle from Japanese Black cattle. Anim Genet. 2012;43(6):790–792. [DOI] [PubMed]
- 49.Zhang S, Knight TJ, Reecy JM, Beitz DC. DNA polymorphisms in bovine fatty acid synthase are associated with beef fatty acid composition. Anim Genet. 2008;39(1):62–70. [DOI] [PubMed]
- 50.Roy L. Association of polymorphisms in the bovine FASN gene with milk-fat content. Anim Genet. 2006;40(3):215–218. [DOI] [PubMed]
- 51.Morris CA, Cullen NG, Glass BC, Hyndman DL, Manley TR, Hickey SM. Fatty acid synthase effects on bovine adipose fat and milk fat. Mamm Genome. 2007;18(1):64–74. [DOI] [PubMed]
- 52.Hayakawa K, Sakamoto T, Ishii A, Yamaji K, Uemoto Y, Sasago N, Kobayashi E, Kobayashi N, Matsuhashi T, Maruyama S, et al. The g.841G > C SNP of FASN gene is associated with fatty acid composition in beef cattle. Anim Sci J. 2015;86(8):737–746. doi: 10.1111/asj.12357. [DOI] [PubMed] [Google Scholar]
- 53.Green CD, Ozguden-Akkoc CG, Wang Y, Jump DB, Olson LK. Role of fatty acid elongases in determination of de novo synthesized monounsaturated fatty acid species. J Lipid Res. 2010;51(7):1871–1877. doi: 10.1194/jlr.M004747. [DOI] [PMC free article] [PubMed] [Google Scholar]
- 54.Moon Y-A, Hammer RE, Horton JD. Deletion of ELOVL5 leads to fatty liver through activation of SREBP-1c in mice. J Lipid Res. 2009;50(3):412–423. doi: 10.1194/jlr.M800383-JLR200. [DOI] [PMC free article] [PubMed] [Google Scholar]
- 55.Zhang W, Bin Y, Zhang J, Cui L, Ma J, Chen C, Ai H, Xiao S, Ren J, Huang L. Genome-wide association studies for fatty acid metabolic traits in five divergent pig populations. Sci Rep. 2016;6:24718. doi: 10.1038/srep24718. [DOI] [PMC free article] [PubMed] [Google Scholar]
- 56.Zhang W, Zhang J, Cui L, Ma J, Chen C, Ai H, Xie X, Li L, Xiao S, Huang L, et al. Genetic architecture of fatty acid composition in the longissimus dorsi muscle revealed by genome-wide association studies on diverse pig populations. Genet Sel Evol. 2016;48:5. doi: 10.1186/s12711-016-0184-2. [DOI] [PMC free article] [PubMed] [Google Scholar]
- 57.Ovilo C, Benitez R, Fernandez A, Nunez Y, Ayuso M, Fernandez AI, Rodriguez C, Isabel B, Rey AI, Lopez-Bote C, et al. Longissimus dorsi transcriptome analysis of purebred and crossbred Iberian pigs differing in muscle characteristics. BMC Genomics. 2014;15:413. doi: 10.1186/1471-2164-15-413. [DOI] [PMC free article] [PubMed] [Google Scholar]
- 58.Matsumoto H, Shimizu Y, Tanaka A, Nogi T, Tabuchi I, Oyama K, Taniguchi M, Mannen H, Sasazaki S. The SNP in the promoter region of the bovine ELOVL5 gene influences economic traits including subcutaneous fat thickness. Mol Biol Rep. 2013;40(4):3231–3237. doi: 10.1007/s11033-012-2398-x. [DOI] [PubMed] [Google Scholar]
- 59.Maharani D, Jung Y, Jung WY, Jo C, Ryoo SH, Lee SH. Association of five candidate genes with fatty acid composition in Korean cattle. Mol Biol Rep. 2012;39(5):6113–6121. [DOI] [PubMed]
- 60.Milanesi E, Nicoloso L, Crepaldi P. Stearoyl CoA desaturase (SCD) gene polymorphisms in Italian cattle breeds. J Anim Breed Genet. 2008;125(1):63–67. [DOI] [PubMed]
- 61.Onogi A, Ogino A, Komatsu T, Shoji N, Shimizu K, Kurogi K, Yasumori T, Togashi K, Iwata H. Whole-genome prediction of fatty acid composition in meat of Japanese black cattle. Anim Genet. 2015;46(5):557–559. doi: 10.1111/age.12300. [DOI] [PubMed] [Google Scholar]
- 62.Goddard M. Genomic selection: prediction of accuracy and maximisation of long term response. Genetica. 2009;136(2):245–257. doi: 10.1007/s10709-008-9308-0. [DOI] [PubMed] [Google Scholar]
- 63.Vahmani P, Mapiye C, Prieto N, Rolland DC, McAllister TA, Aalhus JL. The scope for manipulating the polyunsaturated fatty acid content of beef: a review. J Anim Sci Biotechnol. 2015;6(1):29. [DOI] [PMC free article] [PubMed]
- 64.Wu Y, Fan H, Wang Y, Zhang L, Gao X, Chen Y, Li J, Ren H, Gao H. Genome-wide association studies using haplotypes and individual SNPs in Simmental cattle. PLoS One. 2014;9(10):e109330. doi: 10.1371/journal.pone.0109330. [DOI] [PMC free article] [PubMed] [Google Scholar]
- 65.Fan H, Wu Y, Zhou X, Xia J, Zhang W, Song Y, Liu F, Chen Y, Zhang L, Gao X, et al. Pathway-based genome-wide association studies for Two meat production traits in Simmental cattle. Sci Rep. 2015;5:18389. doi: 10.1038/srep18389. [DOI] [PMC free article] [PubMed] [Google Scholar]
- 66.Folch J, Lees M, Stanley GHS. A simple method for the isolation and purification of total lipids from animal tissues. J Biol Chem. 1957;226(1):497–509. [PubMed]
- 67.Purcell S, Neale B, Todd-Brown K, Thomas L, Ferreira MA, Bender D, Maller J, Sklar P, de Bakker PI, Daly MJ, et al. PLINK: a tool set for whole-genome association and population-based linkage analyses. Am J Hum Genet. 2007;81(3):559–575. doi: 10.1086/519795. [DOI] [PMC free article] [PubMed] [Google Scholar]
- 68.Gilmour AR GB, Cullis BR, Thompson R. ASREML user guide release 3.0 in Hemel Hempstead, HP1 1ES. UK: VSN International Ltd; 2009. [Google Scholar]
- 69.VanRaden PM. Efficient methods to compute genomic predictions. J Dairy Sci. 2008;91(11):4414–4423. [DOI] [PubMed]
- 70.Meuwissen THE, Hayes BJ, Goddard ME. Prediction of total genetic value using genome-wide dense marker maps. Genetics. 2001;157(4):1819–1829. doi: 10.1093/genetics/157.4.1819. [DOI] [PMC free article] [PubMed] [Google Scholar]
- 71.Yang W, Tempelman RJ. A Bayesian antedependence model for whole genome prediction. Genetics. 2012;190(4):1491–1501. doi: 10.1534/genetics.111.131540. [DOI] [PMC free article] [PubMed] [Google Scholar]
- 72.Aulchenko YS, Ripke S, Isaacs A, van Duijn CM. GenABEL: an R library for genome-wide association analysis. Bioinformatics. 2007;23(10):1294–1296. doi: 10.1093/bioinformatics/btm108. [DOI] [PubMed] [Google Scholar]
- 73.Belonogova NM, Svishcheva GR, Axenovich TI. FREGAT: an R package for region-based association analysis. Bioinformatics. 2016;32(15):2392–2393. [DOI] [PubMed]
Associated Data
This section collects any data citations, data availability statements, or supplementary materials included in this article.
Supplementary Materials
Estimates of phenotypic correlations (upper diagonals) and genetic correlation (lower diagonals) between 21 phenotypes in Chinese Simmental beef cattle. (DOCX 19 kb)
Summary statistics of the 100 kb regions for 3 saturated fatty acids. Results include trait name, chromosome, 100 kb windows on the UMD3.1 genome assembly, window variances, and percentage of genetic variance using BayesB. (CSV 2102 kb)
Summary statistics of the100 kb regions for three monounsaturated fatty acids (MUFA). Results include trait name, chromosome, 100 kb windows on the UMD3.1 genome assembly, window variances, and percentage of total genetic variance using BayesB. (CSV 2074 kb)
Summary statistics of the 100 kb regions for five polyunsaturated fatty acids (PUFA). Results include trait name, chromosome, 100 kb windows on the UMD3.1 genome assembly, window variances, and percentage of genetic variance using BayesB. (CSV 2967 kb)
Summary statistics of 100 kb regions for four fatty acid groups. Results include trait name, chromosome, 100 kb windows on the UMD3.1 genome assembly, window variances, and percentage of genetic variance using BayesB. (CSV 2520 kb)
Data Availability Statement
Datasets are available from the Dryad Digital Repository (doi:10.5061/dryad.4qc06).