Abstract
Nonlinear photoacoustic effects, rarely seen in biomedical photoacoustic imaging of tissues, can manifest themselves strongly when plasmonic nanoparticles are used as imaging contrast agents. Specifically, nonlinear behavior of photoacoustic signal with modest laser fluences can occur when nanoparticles undergo cellular endocytosis and aggregation leading to thermal coupling and subsequent localized temperature enhancement. Our study demonstrated this effect using in vitro tissue models containing cells. While the photoacoustic signal amplitude was linearly proportional to the cell/nanoparticle concentration, the photoacoustic signal increased nonlinearly as the laser fluence increased. Our results, therefore, suggest that the nonlinear effects can be exploited in molecular/cellular photoacoustic imaging.
Over the past decade, photoacoustic imaging, with its high sensitivity for both endogenous and exogenous contrast agents and sufficient penetration depth, has become a valuable tool for visualizing functional and cellular/molecular processes. For instance, numerous in vivo and ex vivo studies have demonstrated that photoacoustic imaging can be applied to assess the functional state of hemoglobin. Other applications of photoacoustic imaging have involved utilizing molecular probes to target specific tissues [1]. Specifically, quantitative linear analysis of the photoacoustic signal from contrast agents has been considered to quantify the concentration of contrast agents [2]. Although photoacoustic imaging has been used in many biomedical applications for detection and quantitative analysis of nanoparticles targeted to cells, the physical and thermodynamic mechanisms of the photoacoustic pressure generated from endocytosed nanoparticles are complicated due to various factors [3–7]. Taking nonlinear photoacoustic effects into account may extend the understanding of these mechanisms.
When the mechanisms of photoacoustic pressure generation are generally considered, the rise of the local temperature by pulsed laser irradiation are often ignored with an assumption of constant thermophysical parameters (e.g., thermal expansion coefficient, density, speed of sound, and heat capacity). However, if the localized temperature rise is significant, it considerably alters the thermophysical parameters [3]. Among the parameters related to the photoacoustic response, the thermal expansion coefficient is most dramatically changed as temperature increases [3]. Based on this, there have been several studies to introduce the temperature-dependent thermal expansion coefficient to simulate and explain the nonlinearity in photoacoustics [4,5].
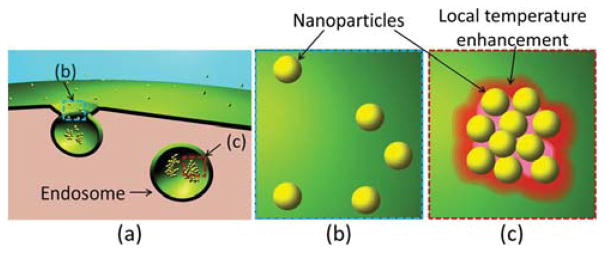
Many other studies have either simulated or observed that the clustering or aggregation of nanoparticles can significantly enhance the local temperature after laser irradiation due to thermal coupling [6,7]. Furthermore, cell endocytosis of nanoparticles leads to aggregation of the particles within endosomes [8]. Consequently, as shown in Fig. 1, significant changes of thermophysical parameters due to localized temperature enhancement after laser irradiation of the aggregated nanoparticles are expected, thus resulting in nonlinear photoacoustic signal increase. Given the size of aggregates and the corresponding temperature elevations, nonlinear photoacoustic phenomena from the endocytosed nanoparticles can be significant, and, if measured, can be exploited in molecular/cellular photoacoustic imaging.
Fig. 1.
(Color online) Diagrams of (a) endocytosis of nanoparticles, (b) disperse nanoparticles before endocytosis, and (c) the local temperature enhancement with thermal coupling around endocytosed nanoparticles.
In this study, we demonstrate the effect of nonlinearity in the photoacoustic signal from endocytosed gold nanoparticles. To achieve this, in vitro experiments using photoacoustic imaging were performed using a tissue-mimicking gelatin phantom containing inclusions of gold nanoparticles endocytosed in mesenchymal stem cells (MSCs). Changes in photoacoustic signal with regard to the cell/nanoparticle concentration and the laser fluence were measured to demonstrate the nature of the nonlinear increase in the photoacoustic signals.
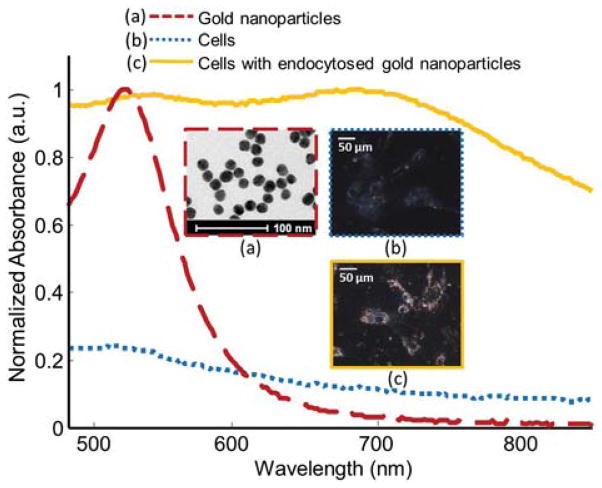
MSCs were loaded with gold nanoparticles as previously reported [9,10]. Briefly, the cell culture medium was prepared by mixing phenol red free cell culture medium with the solution of 20 nm gold nanospheres synthesized by citrate reduction of tetrachloroauric (III) acid (HAuCl4) [9,10]. Nanoparticle endocytosis was assessed by darkfield microscopy after 24 h of incubation. As shown in Fig. 2, the absorbance peak of the gold nanoparticles was broadened and redshifted because the gold nanoparticles were taken up by and aggregated inside the cells. Also, inductively coupled plasma mass spectrometry was performed to assess the average number of nanoparticles per cell (4.53 × 10⁵ particles/cell).
Fig. 2.
(Color online) Normalized absorbance spectra of gold nanoparticles, cells, and endocytosed gold nanoparticles (dashed red, dotted blue, and solid orange lines, respectively). Transmission electron microscopy image of the gold nanoparticles and dark field images of cells with and without nanoparticle loading (dashed red, dotted blue, and solid orange boxes, respectively).
Following nanoparticle loading of the cells, a tissue-mimicking phantom with cell inclusions was prepared for photoacoustic imaging. The cell suspension (10 μL) was mixed with gelatin solution (8% by weight after mixing) and placed on the base layer of the gelatin phantom (8% by weight). The concentrations of the cells in the inclusions were 1 × 10⁴ cells/mL, 5 × 10⁴ cells/mL, and 2 × 10⁵ cells/mL, which correspond to gold nanoparticle concentrations of 4.53 × 10⁹ particles/mL, 2.27 × 10¹⁰ particles/mL, and 1.13 × 10¹¹ particles/mL, respectively.
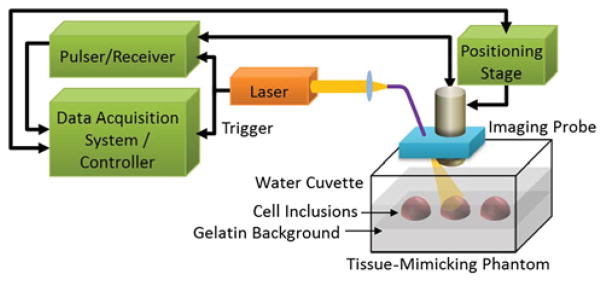
The photoacoustic signals from the tissue-mimicking-phantom were obtained using the photoacoustic imaging system described in Fig. 3. The imaging probe was composed of a 25 MHz focused single element ultrasound transducer (Panametrics, Inc.) and a multimode optical fiber (Thorlabs, Inc.). A laser irradiation (7 ns pulse duration, 10 Hz pulse repetition frequency) was generated by a tunable optical parametric oscillator laser system (Quanta-Ray, Spectra-Physics, Inc., and Premiscan, GWU, Inc.). The laser beam, delivered though the optical fiber, was aligned with the focal zone of the transducer (Fig. 3). The imaging probe was mechanically scanned over the tissue-mimicking phantom using the positioning stage (Zaber, Inc.). Once the generated photoacoustic signals were received by the imaging probe, the acquired A-line signals were amplified and recorded using an eight-bit 500 MHz digitizer. The recorded photoacoustic signals were postprocessed to reconstruct a two-dimensional cross-sectional photoacoustic image as previously described [10].
Fig. 3.
(Color online) Block diagram of the photoacoustic imaging system and the gelatin tissue-mimicking phantom with gold nanoparticle labeled cell inclusions.
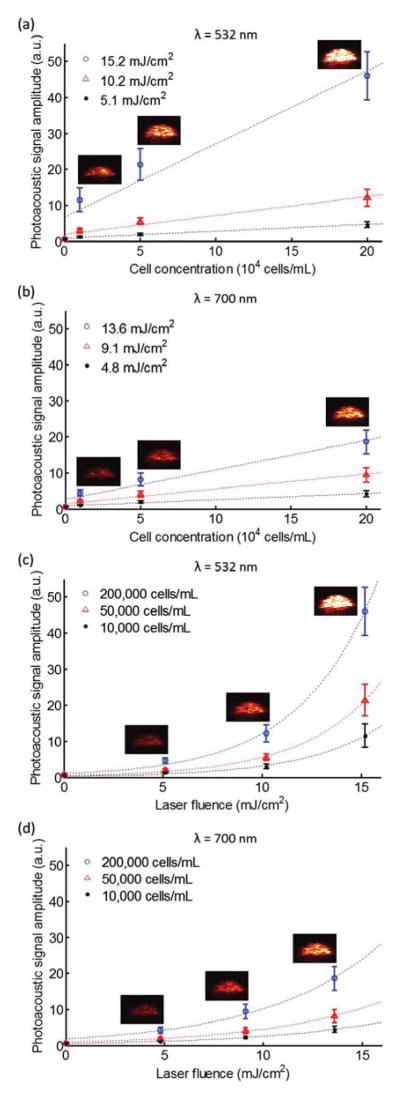
The photoacoustic signals from the endocytosed gold nanoparticles in the tissue-mimicking phantom were quantitatively analyzed (Fig. 4). To observe the photoacoustic signal amplitudes with regard to both the cell/nanoparticle concentration and the laser fluence, the photoacoustic signals from inclusions with three different cell concentrations (1 × 10⁴ cells/mL, 5×10⁴ cells/mL, and 2 × 10⁵ cells/mL) were acquired with a laser fluence of 0 mJ/cm2, 5.1 mJ/cm2, 10.2 mJ/cm2, and 15.2 mJ/cm2 at a wavelength of 532 nm and with a laser fluence of 0 mJ/cm2, 4.8 mJ/cm2, 9.1 mJ/cm2, and 13.6 mJ/cm2 at a wavelength of 700 nm. The means and the standard deviations of the photoacoustic signal amplitudes were calculated from the 10 subareas (0.24 mm × 0.77 mm) in the regions of interest (1.54 mm × 2.40 mm).
Fig. 4.
(Color online) Photoacoustic signal amplitudes from the endocytosed gold nanoparticles in the tissue-mimicking phantom with respect to the cell concentration at wavelengths of (a) 532 nm and (b) 700 nm and with respect to the laser fluence at wavelengths of (c) 532 nm and (d) 700 nm. The dotted lines represent the linear or nonlinear regression fit of the data. The photoacoustic images (5.76 mm × 3.93 mm) from the inclusions with the highest laser fluence in (a) and (b) and with the highest cell concentration in (c) and (d) were incorporated into the graphs.
Figures 4(a) and 4(b) show the photoacoustic signal amplitudes and the linear regression fit (dotted lines) with respect to the different concentrations of cells with endocytosed nanoparticles. As the cell concentration increases, the photoacoustic signal amplitudes linearly increase at both wavelengths (532 and 700 nm). This phenomenon of a linear increase in photoacoustic signal amplitude with increasing nanoparticle concentration was also generally observed in other studies [10–12].
However, as shown in Figs. 4(c) and 4(d), the photoacoustic signal amplitudes with respect to the laser fluence at wavelengths of 532 and 700 nm do not follow a linear regression fit. Instead, the photoacoustic signal has a nonlinear relationship with increasing laser fluence. This nonlinear behavior is probably caused by changes of the thermophysical parameters, such as the thermal expansion coefficient, due to local temperature enhancement with thermal coupling around the aggregated nanoparticles at the high laser fluence [3–7]. However, the exact mechanisms of generating photoacoustic waves from clusters of nanoparticles and the thermodynamics of the endocytosed nanoparticles are not fully understood and further studies are needed. Also, a more rapid increase of the photoacoustic amplitude with laser fluence is observed at a 532 nm wavelength than at a wavelength of 700 nm as the laser fluence increases. This may indicate that the closer the wavelength is to the absorption peak of the single nanoparticles, the more prominent are the nonlinear photoacoustic effects.
In conclusion, we demonstrated the nonlinearity in photoacoustic signal from endocytosed gold nanoparticles. The photoacoustic signals from the tissue-mimicking gelatin phantom containing inclusions of cells with endocytosed gold nanoparticles were quantitatively analyzed with respect to the cell/nanoparticle concentration and the laser fluence. The photoacoustic signal amplitude was linearly proportional to the cell/nanoparticle concentration, but the signal increased nonlinearly as the laser fluence increased. Among other factors, the nonlinear photoacoustic signal is likely attributed to the changes of thermophysical parameters due to localized temperature enhancement with thermal coupling near the aggregated nanoparticles. Although the nonlinear effects should be further investigated, our study suggests that the reported mechanism can be used in photoacoustic imaging to identify molecular/cellular interaction of plasmonic nanoparticles with cells.
Acknowledgments
This work was supported in part by National Institutes of Health under grants CA1497403, EB008101, and EB015007.
Footnotes
OCIS codes: 110.5120, 110.5125, 170.3880.
References
- 1.Emelianov SY, Li PC, O’Donnell M. Phys Today. 2009;62:34. doi: 10.1063/1.3141939. [DOI] [PMC free article] [PubMed] [Google Scholar]
- 2.Kim S, Chen YS, Luke GP, Emelianov SY. Biomed Opt Express. 2011;2:2540. doi: 10.1364/BOE.2.002540. [DOI] [PMC free article] [PubMed] [Google Scholar]
- 3.Gusev VĖ, Karabutov AA. Laser Optoacoustics. American Institute of Physics; 1993. [Google Scholar]
- 4.Oshurko VB. Tech Phys Lett. 2006;32:691. [Google Scholar]
- 5.Egerev SV, Oraevsky AA. Int J Thermophys. 2008;29:2116. [Google Scholar]
- 6.Sanchot A, Baffou G, Marty R, Arbouet A, Quidant R, Girard C, Dujardin E. ACS Nano. 2012;6:3434. doi: 10.1021/nn300470j. [DOI] [PubMed] [Google Scholar]
- 7.Govorov AO, Zhang W, Skeini T, Richardson H, Lee J, Kotov NA. Nano Res Lett. 2006;1:84. [Google Scholar]
- 8.Iversen TG, Skotland T, Sandvig K. Nano Today. 2011;6:176. doi: 10.1021/nn2021953. [DOI] [PubMed] [Google Scholar]
- 9.Ricles LM, Nam SY, Sokolov K, Emelianov SY, Suggs LJ. Int J Nanomed. 2011;6:407. doi: 10.2147/IJN.S16354. [DOI] [PMC free article] [PubMed] [Google Scholar]
- 10.Nam SY, Ricles LM, Suggs LJ, Emelianov SY. PLoS ONE. 2012;7:e37267. doi: 10.1371/journal.pone.0037267. [DOI] [PMC free article] [PubMed] [Google Scholar]
- 11.De la Zerda A, Zavaleta C, Keren S, Vaithilingam S, Bodapati S, Liu Z, Levi J, Smith BR, Ma TJ, Oralkan O, Cheng Z, Chen X, Dai H, Khuri-Yakub BT, Gambhir SS. Nat Nanotechnol. 2008;3:557. doi: 10.1038/nnano.2008.231. [DOI] [PMC free article] [PubMed] [Google Scholar]
- 12.Mallidi S, Larson T, Tam J, Joshi PP, Karpiouk A, Sokolov K, Emelianov S. Nano Lett. 2009;9:2825. doi: 10.1021/nl802929u. [DOI] [PMC free article] [PubMed] [Google Scholar]


