

Abstract
Objective
To develop a large animal model of spinal cord injury (SCI), for use in translational studies of spinal cord stimulation (SCS) in the treatment of spasticity. We seek to establish thresholds for the SCS parameters associated with reduction of post-SCI spasticity in the pelvic limbs, with implications for patients.
Study Design
The weight-drop method was used to create a moderate SCI in adult sheep, leading to mild spasticity in the pelvic limbs. Electrodes for electromyography (EMG) and an epidural spinal cord stimulator were then implanted. Behavioral and electrophysiological data were taken during treadmill ambulation in six animals, and in one animal with and without SCS at 0.1, 0.3, 0.5, and 0.9 V.
Setting
All surgical procedures were carried out at the University of Iowa. The gait measurements were made at Iowa State University.
Material and Methods
Nine adult female sheep were used in these institutionally approved protocols. Six of them were trained in treadmill ambulation prior to SCI surgeries, and underwent gait analysis pre- and post-SCI. Stretch reflex and H-reflex measurements were also made in conscious animals.
Results
Gait analysis revealed repeatable quantitative differences in 20% of the key kinematic parameters of the sheep, pre- and post-SCI. Hock joint angular velocity increased toward the normal pre-injury baseline in the animal with SCS at 0.9 V.
Conclusion
The ovine model is workable as a large animal surrogate suitable for translational studies of novel SCS therapies aimed at relieving spasticity in patients with SCI.
Keywords: Spinal cord injury, Animal models, Spinal cord stimulation, Gait analysis, Spasticity
Introduction
Spinal cord injury (SCI) is a major public health problem with an estimated incidence in the U.S. of approximately 12,000 new cases per year.1 The cost of care for spinal cord injured patients and their associated loss of productivity create a major financial burden on U.S. society of approximately $10 billion annually,2 with population-proportional similar costs in other countries such as Canada3 and Australia.4 Many complications follow SCI, including spasticity, which affects from 68 to 78% of those patients.5 The pathologically increased muscle tone and exaggerated reflexes of spasticity interfere with the normal activities of daily living, impeding the ability of patients with incomplete SCI to walk and care for themselves. Other sequelae include pain, fatigue and, over time, the risk of developing contractures, pressure ulcers and infections.
Clinicians and scientists have pursued a wide range of therapeutic strategies directed at reversing or mitigating the effects of SCI and the resulting spasticity, but clinically impactful progress to date has been modest. This is due in large part to the complex pathophysiology of SCI and the many challenges associated with devising and testing interventions that have the potential to restore aspects of normal spinal cord functions.
Progress in this field is critically dependent on the availability of suitable experimental animal models. These models enable researchers to address fundamental questions regarding the cellular and neural systems pathophysiology of SCI that cannot be answered using any other strategy.6 Similarly, experimental animal research plays a vital role in the development, testing and refinement of new SCI treatment concepts.7 Researchers have introduced a variety of SCI animal models to address these important needs, with each having attributes that are best suited to address specific types of scientific questions. Rodent models, for example, can be used to effectively study spinal cord neuronal activity at the single unit level8,9 and murine models are ideal for examining the effects of different genetic manipulations on SCI pathophysiology.10,11 The feline model has long been established as a standard for intracellular studies of spinal cord motoneurons and interneurons as well as motor unit recordings in the intact, acutely injured and chronically injured state.12,13
In this report, we describe our work developing a large animal model for experimental studies of SCI. Our goal is to use it in facilitating the design, testing and translational adaptation of novel implantable neurosurgical treatment systems that might eventually be employed in patients.14,15 Small animal models (e.g. rat and mouse) have technical limitations in applicability to humans, in part because of electrical artifacts produced by simultaneous stimulation and recording in a small anatomic space. In addition, a small animal model is typically incapable of supporting chronic implantation of clinical-scale stimulator leads or pulse generators, thus limiting the translational applicability. Sheep were selected for this study because the size and key anatomical features of their spine and spinal cord approximate those of humans,16 the electrophysiology of their central nervous system has been studied carefully for many years,17 and the results from these experiments will be directly compared to parallel, collaborative studies currently underway in cats that are designed to quantify the changes in reflex pathways following SCI. Sheep can also be readily trained to perform treadmill ambulation,18 cervical flexion and extension,19 and other behavioral tasks around which experimental protocols can be designed that provide valuable insights into the nature of SCI and its treatment.
In the next sections, we describe the devices and methods used to create a moderate SCI at the mid-thoracic level in sheep, with resulting spasticity in the pelvic limbs. We then present the results of the behavioral and neurophysiological testing that was done to validate this ovine model of SCI, including a preliminary use of it with and without spinal cord stimulation (SCS). The behavioral testing involved video-based gait analysis of the sheep walking on a treadmill, and stretch-reflex testing of the pelvic limbs. The neurophysiological testing centered on electromyography (EMG) recordings of multiple hind limb muscle groups and H-reflex testing. The details of the experimental arrangements follow below.
Materials and methods
This investigation was approved by the Institutional Animal Care and Use Committees (IACUC) of the University of Iowa (IACUC Approval No. 1308149) and Iowa State University (ISU) (IACUC Approval No. 2-12-7298-O). The experimental sheep were female Polypay or Suffolk breeds (age: ≈ 2 years; weight: ≈ 70 kg). Upon delivery, all animals were examined by a veterinarian and deemed non-pregnant and free of disease. The animals were fed a diet of hay supplemented with concentrate according to their requirements, and had free access to fresh water. Following the SCI and the EMG electrode implantation procedures, they received continuous post-operative veterinary monitoring and care. Terminal surgeries and euthanasia were carried out per protocol at the study's endpoint, and tissue samples were subsequently explanted for histology. The experimental work reported here was done in compliance with all mandatory laboratory health and safety procedures.
Pre-operative gait training
Gait analysis of quadrupeds with spinal cord injuries walking on treadmills can provide sensitive quantitative measures of kinematic parameters, e.g. hoof elevation and stride duration, that are important in evaluating the efficacy of potential therapeutic interventions.20–22 Therefore, we chose this type of behavioral assessment as the primary outcome modality. All animals involved in the gait analysis part of the study were thus trained in treadmill ambulation in the naïve state by personnel in the Department of Veterinary Clinical Sciences at Iowa State University. This was done in order to establish a baseline of performance against which their ambulation following SCI could then be compared, with and without intervention via SCS. The initial training typically required 6–10 sessions of habituating a sheep to walking on a treadmill (GopetUSA, model EB730, Ephrata, PA, USA), over a three-week period, with the goal being to have it walk at a steady pace of approximately 3.75 km/h for periods of about 5 minutes. During these sessions, 14 mm diameter optical markers were mounted non-invasively on their legs and hooves, and the movements of the limbs during the treadmill sessions were then recorded at 100 Hz frame-rates by the six infrared cameras of a video monitoring and analysis system (Vicon Motion Systems Ltd., Oxford, UK) that detected and tracked the movement of these markers.
The resulting video images, which contain the raw 3D position data for each reflective marker, were exported to a custom MATLAB® (Mathworks, Natick, MA, USA) program for analysis. Our gait analysis routines were built on those previously described by Safayi et al.,23 which among other gait parameters, extracted ranges of motion, joint angles, and hind-limb hoof elevations. For each of these metrics, the allowable total error, TE, defined as TE = 2σ/µ where σ is the standard deviation of the measured variable under study and µ is mean, was established from the pre-injury recordings for each animal. The TE values were then used to calculate animal-specific predicted ranges for each gait metric and, as discussed later, any post-injury gait metrics falling outside of these predicted ranges were considered significant and used in assessing post-injury outcome.
Anesthesia, surgical and injury-evaluation protocols
The procedure was done in two stages, with a two-week recovery between each surgery. In preparation for surgery, each animal was sedated with an intramuscular (IM) injection of medetomidine (0.001–0.007 mg/kg) and ketamine (5–15 mg/kg). Following sedation, a catheter was placed in the external jugular vein, cephalic vein, or in the lateral saphenous vein for maintenance anesthesia and fluids. The sheep was then intubated with a # 10, 11, or 12 ET tube and general anesthesia maintained with isoflurane (2–5%) delivered in 100% O2.
Immediately prior to surgery, the surgical incision area was prepped with betadine or chlorhexidine scrub followed by isopropyl alcohol (repeated at least 3 times each). A urinary catheter was manually inserted aseptically for post-injury bladder drainage. A closed system was used to collect urine while the catheter was in place. Mechanical ventilation was maintained at 12–20 breaths/minute and with tidal volume of 10–15 ml/kg. During the procedure, standard monitoring was performed for heart rate, respiratory rate, arterial blood pressure, end tidal carbon dioxide (mm Hg), inspired and expired isoflurane levels, and oxygen saturation. Hydration was maintained with IV lactated Ringer's solution (1.5–10 ml/kg/hr) or other balanced electrolyte solution and temperature was measured by either a rectal or esophageal temperature probe and maintained between 101.5° F and 104° F with a heating pad.
The EMG electrodes were implanted in the first stage. The exposed tips of insulated, stranded, twisted-pair stainless steel recording wires (38 AWG, AS 632, Cooner Wire, Chatsworth, CA, USA) were placed at the nerve entry points of the vastus lateralis, gluteobiceps, tibialis anterior and gastrocnemius muscles bilaterally. The insulation was stripped from the last 2 mm of each wire prior to placement at the nerve entry points. Nerve cuff stimulating electrodes are also placed on the peroneal and tibial nerves. All leads were tunneled and then connected to a custom-made titanium manifold attached to the sheep's back. During subsequent experimental sessions, the EMG signals were conveyed via a detachable ribbon cable to a high-bandwidth signal processor (Tucker Davis Technologies, Alachua, FL, USA) for recording and analysis. Each muscle was stimulated directly to test for EMG signals prior to closure.
After recovery from EMG electrode implantation, the animal was taken back to the operating room for SCI. The surgical procedure consisted of exposing the dorsal aspect of the vertebral column at thoracic level T8, followed by a laminectomy. A weight-drop tower used to create the SCI was then secured by bone screws to the residual lateral laminae of the vertebra. After the weight-drop procedure (the tower design and details of the procedure are given below), the drop tower was removed and the surgical wound closed.
In one of the sheep, at five months post-SCI, a follow-up laminectomy was carried out at L2, and an epidural spinal cord stimulator was placed to cover the T12–L1 region. Given the relationship of the spinal cord growth and the vertebral body group in sheep, the vertebral level correlated to the spinal cord level.24 A pulse generator was then implanted subcutaneously rostral to the level of the laminotomy. Because the dura in sheep is thin and the volume of CSF surrounding the cord at this level is minimal compared to humans we were able stimulate at low amplitudes, thus maximizing battery life between (wireless) recharging sessions.
During the post-operative recovery period, the animals were observed in their pens and the level of injury-induced deficit was assessed. The goal of the procedure was to create a moderate SCI that caused an incomplete neurological deficit that led to the development of hind limb spasticity. A more severe injury was avoided to ensure that the animal could survive chronically without specialized veterinary care. These assessments were carried out daily by the animal care staff using a slightly modified version of the TIBS scoring method of Lee et al.25 Per that scale, a score of 1 was assigned to a state of injury severe enough to prevent any hind limb movement, while at the other end, a score of 10 represented essentially normal walking behavior. Scores of 2 through 9 established specific levels of intermediate severity of injury based on quantitative and observational measures that included the number of reciprocating gait cycles, the degree of limb extension, and maintenance of trunk balance while walking. More specifically, scores of 1 through 3 focused on the ability to obtain rump elevation and initiate hind limb movement, 4 through 6 on the ability to take steps with partial limb extension, and 7 through 10 on states of balance during ambulation (for full details of the numerical gradations, see Figure 4 in their paper25 and the associated discussion there). The goal in our work was to obtain a cadre of SCI sheep with TIBS scores consistently in the range from 7 to 9, i.e. with spinal cord injuries mild enough to allow balance and ambulation but with spasticity of the hind limbs. We note that the BBB (Basso, Beattie and Bresnahan) rating scale,26 used routinely for assessing post-SCI hindlimb locomotor function in small animal (rodent) models, has recently been adapted for use in lambs.27 However, our work was begun before the revised BBB scale was available and, at that time, the TIBS rating scale had already been validated for large animal models. Hence, we adopted the latter for assessment in these preliminary studies with our experimental sheep but will consider use of the former in future studies, as it is ovine-specific.
Figure 4.

One of the sheep in the suspension sling with the stretch reflex device in place
SCI methodology
We create a contusive injury on the spinal cord in our ovine model using a modified version of a standard weight-drop technique28,29 which was first employed in sheep by Yeo and colleagues30–34 and used recently in swine.25 The configuration of our custom apparatus, designed to achieve a repeatable level of incomplete SCI, is shown in Figure 1. It is similar to that of Jones et al.,35 with the main difference being that the fall of their impactor was monitored by high-speed camera and co-moving load cell, whereas our system employs a linear variable differential transformer (LVDT) arrangement.
Figure 1.

(A) Tower apparatus used during weight drop surgeries. The LVDT portion of the tower is used to measure the impactor's position (and velocity through differentiation) as it is dropped. (B) The drop tower in position during a weight drop surgery
Per Figure 1a, the base consists of an aluminum mounting plate and standoff tube. The 5.5×3.2 cm mounting plate is 0.3 cm thick, with L-shaped corner holes to facilitate positional adjustments during fixture of the apparatus to the laminae of the vertebra. The standoff tube is 2.8 cm in outer diameter, 2.4 cm in inner diameter, and 12.8 cm long. It has four axial slots 3.8 cm long by 0.7 cm wide positioned at 90° intervals just above the mounting plate to allow visual access of the spinal canal within the drop zone. A Macro Sensors (Pennsauken, NJ, USA) model HSAR 750–1000 LVDT36 is used to track the impactor position. The cylindrical stainless steel body of the LVDT is 1.9 cm in outer diameter and 18.8 cm long. It is coaxially coupled to the standoff tube by a 5 cm long brass bushing, with close fits on both ends to insure mechanical stability. The electrical terminations on the LVDT are made through a radial connector, thus allowing free, through-bore passage within the measurement channel. The overall length of the assembled base/bushing/LVDT system is approximately 32 cm. The moveable core inside the measurement channel of the LVDT is of high permeability nickel-iron, 4.8 mm in diameter, 8.8 cm long, and with a mass of 11.6 g. The flat-tipped aluminum extension rods threaded into it are scaled to bring the total mass of the resulting impactor to 50 g at an overall length of 36 cm. The overall design is generally in keeping with the standard approach.29 All of these mechanical components are sterilized prior to use. Proper vertical orientation of the drop-tower is confirmed by bubble level prior to impactor release during the course of a procedure. Figure 1b shows the drop tower in place and ready for use in one of the experimental animals.
The LVDT sensor is coupled directly to a Macro Sensors model LVC-4000 signal conditioner with 500 Hz frequency response (–3 dB). The linearity error of the sensor is < ± 0.25% of full-scale reading, with negligible thermal drift (≈ 0.02% per C). The resulting analog output has a sensitivity of 2 V/cm with a ripple-limited resolution of ≈ 1 mVrms, for an intrinsic signal-to-noise ratio of approximately 2000:1. Prior to use, the LVDT system was calibrated per the manufacturer's recommended method,37 using a micropositioner with a linear positional resolution of 0.1μm (David Kopf Instruments, model 2662, Tujunga, CA, USA) to move the core within the transformer coils. During the weight drop experiments, the output signal is digitized and stored by laboratory computer for off-line analysis. Calculation of the first and second time derivatives of the low-pass filtered (4th order Butterworth, 200 Hz) data train yields the velocity and acceleration of the falling impactor, respectively.
Figure 2 shows the impact velocity measured during seven different weight drops during commissioning studies: four drops from 7.5 cm and three from 10 cm. The variations in impact velocity arise from residual frictional interactions of the impactor with the inner wall of the LVDT's measurement channel, thus emphasizing the importance of establishing tower verticality prior to making a weight drop. As the working range of the LVDT was ± 25 mm from mid-point of the internal transformer arrangement, only the lower 5 cm of the impactor's fall are monitored by this system during each weight-drop test. When inducing the experimental SCI, a typical drop consists of releasing the impactor from a height of 10 cm above the spinal cord, and then allowing it to remain in place on the pial surface for 4 to 5 seconds post-impact before lifting it off. However, in recent supplementary experiments on three sheep, we have also used the 7.5 cm drop height. The sheep's ventilation was paused during the weight drop to eliminate spinal cord movements due to respiration. An example of this characteristic drop profile as monitored by the LVDT is shown in Figure 3. After sheep have recovered from the acute stage of the SCI they participate in a series of behavior and electrophysiological tests described below at different chronic post-injury time points.
Figure 2.

Impact velocity from testing of the weight drop method: four drops at 7.5 cm and three from 10 cm
Figure 3.
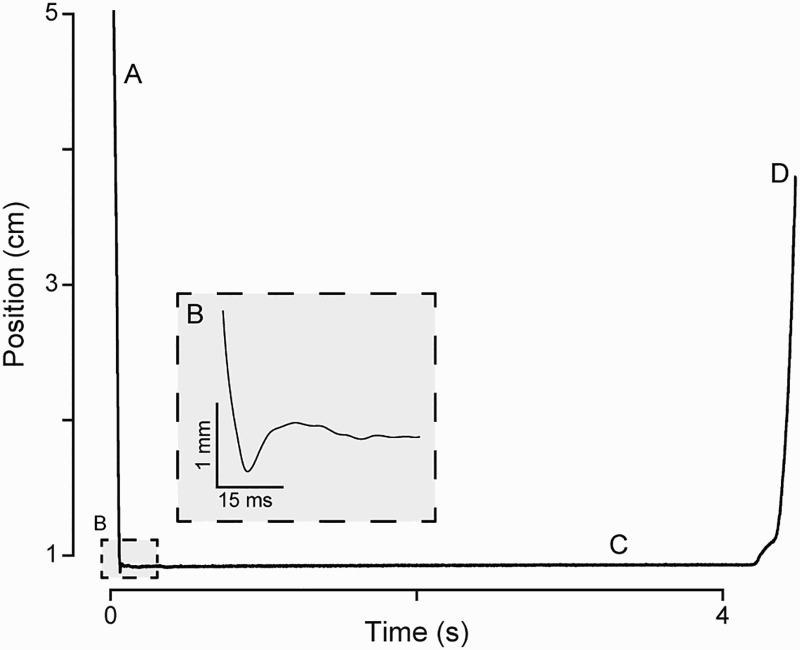
Position of the impactor as it (A) drops, (B) impacts, (C), rests on, and (D) is removed from the spinal cord during a weight drop surgery. The inset displays the region used for impact velocity calculations
Post-Injury gait testing and gait-based assessment of injury severity
Once the animal was again capable of walking on the treadmill, each sheep in that cadre participated in post-SCI treadmill gait recording sessions at regularly spaced intervals over the range from 3 weeks to 34 weeks post-injury. The total number and timing of recording sessions was specific to each animal. These series of gait tests were performed to search for injury-induced changes in the kinematic variables described above, with the understanding that each animal's gait may be affected differently after injury due to the intrinsic high variability in SCI in vivo models. In order to quantify and compare the effects of SCI on each sheep's gait, the total number of gait metrics falling outside of their respective pre-injury ranges was computed for every post-injury recording.
For each gait recording, a total of 62 values were calculated: 19 for the back limbs (i.e. 38 for both), 11 for the front limbs (i.e. 22 for both), and 2 for the “universal” coordination metric described by Hamilton et al.20 For example, determining the stride length for each hoof results in 4 unique values. An animal's total number of significant gait metrics for a single recording session were compared to its post-injury TIBS scores in order to infer the severity of injury.
EMG recording procedures
In addition to the behavioral measures, EMG recordings were obtained as the sheep walked on the treadmill. An LED pulse from a trigger source (Tucker-Davis Technologies, model IZ-2, Alachua, FL, USA) was used to synchronize the kinematic gait and EMG recordings offline. The EMG data were sampled at 6.103 kHz, rectified, and filtered with a low-pass, fourth-order Butterworth filter with a cutoff frequency of 2000Hz. Stance onset times were determined from the kinematic data and used to separate the EMG recordings into individual portions of the gait cycles that were time-normalized to percent of each gait cycle component. Each recording session consisted of a minimum of 120 steps. Finally, the smoothed EMG signals were ensemble-averaged and normalized to each muscle's peak value. Our general approach reflects the methods of Zhong et al.,38 Wang et al.,39 and Ravera et al.40 By measuring and analyzing EMG recordings obtained simultaneously from antagonistic leg muscle groups it was possible to study patterns of gait-phase specific contractions that are abnormal in sheep with SCI induced spasticity. The effects of SCS on the gait and electrophysiological measures were then tested simultaneously by analyzing data obtained over single experimental sessions during epochs when the SCS was off versus on.
H-reflex testing procedure
Additional experiments involved recording H-reflex and M-wave responses via the EMG electrodes when electrical stimuli were delivered through the cuffs implanted on the peroneal and tibial nerves. The stimuli, 1 ms square wave pulses at 0.2 Hz with an intensity range from 10 to 250 μA, were delivered by an analog stimulus isolator (Model 2200, A-M Systems, Sequim, WA, USA) while the sheep were awake and standing in their transport cage. The H-reflex and M-wave responses were recorded from either the gastrocnemius muscle (tibial nerve stimulation) or tibialis anterior (peroneal nerve). After the initial establishment of the H-reflex, the nerves were stimulated in higher frequency pairs following the protocol described by Schindler-Ivens and Shields,41 in order to assess the degree of rate-sensitive waveform changes. For each trial, two 160 µA pulses were delivered to the nerve and the response in the corresponding muscle was recorded. Each trial was separated by 5 seconds (0.2 Hz). The objective was to develop a methodology for eventual use in obtaining reflex measurements from the animal in its naïve state and following SCI with and without spinal cord stimulation.
Stretch reflex testing procedure
Animals with SCI-induced spasticity will develop pathologic increases in the mechanical resistance to muscle movements and this resistance will increase with increased velocity of muscle stretch. Following the method of Bose et al.,42,43 we developed a method for recording hind limb reflex forces as the limb is manipulated using mechanical actuation while the sheep was fully awake and suspended comfortably in a sling. Measurements were obtained using a strain-gauge sensor in line with a steel rod attached below the sheep's hock joint (Fig. 4). Designed with the intention of replicating a clinical neurological examination test for spasticity, a handle at the base of the rod allowed for manual manipulations of the limb at various speeds. During certain experiments, depending on the particular sheep's comfort with the exam, we were also able to directly manipulate the limb by hand, thus reproducing actual clinical examinations of spasticity. The Vicon motion capture system was used to determine the rotational speed of the limb during these hand-powered session. The raw EMG was then rectified and low-pass filtered (2nd order Butterworth, 10 Hz cutoff) in order to later perform area-under-the-curve magnitude calculations. The ultimate goal of this part of the work is to investigate the effects of SCS on velocity-dependent reflex force measurements made on sheep with SCI during interleaved epochs when the spinal cord stimulator is either off or on.
SCS testing
In one of the animals a conventional paddle-type epidural spinal cord stimulator (SpecifyTM 5-6-5 Model 39565, Medtronic Inc., Minneapolis, MN, USA) with a rechargeable subcutaneous battery (RestoreUltra® Model 37712, Medtronic Inc., Minneapolis, MN, USA) was implanted 5 months post-SCI surgery. The stimulation intensity was increased, decreased, and turned on and off using a handheld programmer (MyStim® Model 97740, Medtronic, Inc., Minneapolis, MN, USA). The stimulus waveform consisted of a constant-voltage 40 Hz square pulse with a 120 µs pulse width.
Two gait-recording sessions with SCS for this animal were conducted at 32 and 34 weeks post-SCI-injury. An identical stimulation protocol was used for both sessions. First, following the procedure described above, a baseline gait session was recorded with no stimulation. Next, the maximum stimulation intensity was determined by delivering a square wave pulse at increasing intensities while the animal stood stationary on the treadmill. The maximum level was defined as when 1) the animal reacted to the stimulation (e.g. by holding up a limb or stomping its hooves) and 2) the animal was still capable of walking while the stimulation was applied. Once the maximum level was established, four separate two-minute gait recordings were collected, with stimulation applied at 0.1, 0.3, 0.5, and 0.9 volts, with 0.9 V being the maximum level both days. (We note that the maximum signal strength typically available in clinical spinal cord stimulation is 10 V.) The stimulator and treadmill were turned off between gait recordings while the stimulation intensity was increased using the handheld programmer. Once the stimulation level was adjusted, the stimulator and treadmill were turned on and a new recording was started. Stimulation was applied only during the two-minute recording sessions; at all other times, the stimulator was off. The Kruskal-Wallis test, a nonparametric version of the one-way ANOVA, was used to compare the effects of the different stimulation parameters on the various gait metrics.
Results
Injury creation and assessment
When the impactor was dropped from a height of 10 cm, the average measured velocity upon impact was 132 ± 5 cm/second, with deformation of the cord ranging from 3.7 to 4.7 mm, i.e. 61% to 78% of mean spinal cord diameter. When dropped from 7.5 cm, the average impact velocity was 110 ± 3 cm/second with cord deformation ranging from 2.1 to 3.0 mm, i.e. 24% to 49% of mean spinal cord diameter. Similar variabilities have also been seen in other large animal models of weight-drop SCI.25 Using this methodology, we were able to create a moderate level of incomplete SCI in our ovine model, though animal-to-animal variability in injury severity, as established by TIBS score, was observed. The details are shown in Figure 5, which presents the acute phase (Fig. 5A) and the chronic phase (Fig. 5B) results for the six sheep with 10 cm drops, and the acute phase (Fig. 5C) results from supplementary experiments on three sheep with 7.5 cm drops. On post-surgery day one, the TIBS scores for the 10 cm sheep ranged from 2 (severe) to 9 (mild) with a mean of 4, with part of the variation likely due to differences in response to the anesthesia. Because behavioral measures could only be made typically a week or so after SCI, the gathering of the more robust data on response to injury was thus slightly delayed. However, the final-outcome TIBS scores for them ranged from 8 to 10 with a mean of 9. From Figure 5c, the sheep that underwent the 7.5 cm weight drops had TIBS scores at the end of the acute phase that were similar to those in the cohort that underwent the 10 cm drops (Fig. 5a). While these were all encouraging results, and the chronic phase findings were thought to represent at least an approximate injury-recovery plateau for the animals. However, we note that the actual behavioral range for each numerical value of the TIBS scale is still relatively broad, leaving room for improvement in the resolution and inter-comparison of each animal's level of injury.
Figure 5.

(A) TIBS scores as recorded each day for the first 16 days post-SCI. A lower TIBS score corresponds to a more severe injury. Sheep 30003, 40011, and 40013 were assessed with the lowest initial TIBS scores and maintained lower TIBS scores during recovery as compared to the three other sheep. The outcome score was determined for each sheep 30 days post injury, after which the TIBS scores had stabilized. (B) Each sheep had its gait assessed at regular intervals post-injury. The number of gait metrics falling outside of a sheep's pre-injury predicted range serves as a gross assessment of severity of injury. Sheep 30003, 40011, and 40013 consistently had the most gait metrics falling outside of their predicted range post-injury, corresponding with the TIBS-based assessment of injury severity. The same three sheep are lacking earlier gait recordings due to their inability to walk on the treadmill during that stage of recovery. (C) TIBS scores as recorded each day for the first 16 days post-SCI for the three sheep that underwent the 7.5 cm weight drops. The findings are similar to those shown in (A).
Kinematic gait analysis
Kinematic gait data for the relevant metrics were collected from six sheep pre- and post-SCI. Following the procedure described above, the predicted ranges of 62 gait metrics were calculated for each animal. A set of representative results is shown for all four limbs of one of the sheep, pre- and post-SCI, in Table 1. Note that post-SCI values of 8 of the 19 metrics for the left-hind limb for this animal were found to be outside of the predicted range. (The comprehensive tabulations for each animal, beyond the scope of what can be included here, include the results from all of the post-SCI gait measurements, thus charting the progression of an injury over time.) The range of behavioral measures listed in Table 1 is consistent with those used in any of the standard approaches in the field of animal gait analysis.44
Table 1.
Representative gait metric data for one sheep before and after SCI. Data are shown for all four limbs, pre- and post-SCI. The naïve value is the result of averaging three pre-injury gait sessions from one day. The predicted range is also based on the three naïve recordings and is equivalent to a 95% confidence interval. For clarity of presentation, an abbreviated table is displayed here. A comprehensive table for each animal would contain the full results for each gait metric from additional post-SCI measurements made at later points in time. The asterisks indicate post-SCI values that were found to be outside of the predicted range
| Left forelimb |
Right forelimb |
|||||
|---|---|---|---|---|---|---|
| Naïve | Predicted range | SCI | Naïve | Predicted range | SCI | |
| Parameter | (Wk 9) | (Wk 9) | ||||
| Gait cycle duration (s) | 0.84 | 0.75 – 0.93 | 0.84 | 0.84 | 0.73 – 0.95 | 0.84 |
| Stance duration (s) | 0.51 | 0.43 – 0.60 | 0.43* | 0.49 | 0.40 – 0.59 | 0.47 |
| Swing duration (s) | 0.33 | 0.27 – 0.38 | 0.41* | 0.35 | 0.28 – 0.42 | 0.36 |
| Ratio of stance to stride (%) | 61 | 55 – 67 | 51* | 59 | 52 – 65 | 57 |
| Ratio of swing to stride (%) | 39 | 33 – 45 | 49* | 41 | 35 – 48 | 43 |
| Distance between contralateral limbs (cm) | 156.1 | 100.9 – 211.3 | 201.7 | 156.1 | 100.9 – 211.3 | 201.7 |
| Lateral deviation of hoof during swing (cm) | 4.60 | 0.43 – 8.78 | 10.17* | 5.59 | 1.55 – 9.63 | 7.84 |
| Forward velocity of hoof during swing (m/s) | 1.59 | 1.27 – 1.90 | 1.17* | 1.43 | 1.19 – 1.68 | 1.48 |
| Vertical velocity of hoof during swing (cm/s) | 1.65 | 0.58 – 2.72 | 0.89 | 1.60 | 0.89 – 2.30 | 1.48 |
| Range of hoof height during swing (cm) | 2.95 | 1.35 – 4.55 | 3.20 | 4.06 | 2.27 – 5.86 | 3.89 |
| Stride length (cm) | 51.84 | 42.66 – 61.03 | 48.06 | 49.96 | 41.29 – 58.63 | 53.17 |
| Left hindlimb | Right hindlimb | |||||
| SCI | SCI | |||||
| Naïve | Predicted range | (Wk 9) | Naïve | Predicted range | (Wk 9) | |
| Gait cycle duration (s) | 0.84 | 0.77 – 0.92 | 0.84 | 0.84 | 0.77 – 0.91 | 0.84 |
| Stance duration (s) | 0.49 | 0.42 – 0.56 | 0.44 | 0.49 | 0.42 – 0.57 | 0.47 |
| Swing duration (s) | 0.35 | 0.31 – 0.40 | 0.40* | 0.35 | 0.28 – 0.41 | 0.37 |
| Ratio of stance to stride (%) | 58 | 53 – 63 | 52* | 59 | 52 – 66 | 55 |
| Ratio of swing to stride (%) | 42 | 37 – 47 | 48* | 41 | 34 – 48 | 45 |
| Distance between contralateral limbs (cm) | 183.5 | 123.7 – 243.2 | 209.7 | 183.5 | 123.7 – 243.2 | 209.7 |
| Lateral deviation of hoof during swing (cm) | 4.55 | 0.49 – 8.61 | 6.69 | 4.28 | 0.58 – 7.97 | 5.91 |
| Forward velocity of hoof during swing (m/s) | 1.44 | 1.22 – 1.66 | 1.21* | 1.43 | 1.21 – 1.66 | 1.41 |
| Vertical velocity of hoof during swing (cm/s) | 1.07 | -0.14 – 2.28 | 1.13 | 1.13 | -0.62 – 2.88 | 0.48 |
| Range of hoof height during swing (cm) | 3.02 | 1.73 – 4.30 | 2.77 | 2.33 | 1.24 – 3.43 | 2.04 |
| Stride length (cm) | 50.38 | 43.65 – 57.10 | 49.33 | 50.47 | 43.88 – 57.07 | 52.00 |
| Min hock joint angle during stance (°) | 137.8 | 130.2 – 145.4 | 114.7* | 128.4 | 119.6 – 137.2 | 119.9 |
| Max hock joint angle during stance (°) | 166.5 | 157.8 – 175.3 | 140.7* | 159.7 | 150.6 – 168.8 | 149.2* |
| Full range of hock joint during stance (°) | 28.7 | 20.2 – 37.3 | 26.0 | 31.3 | 20.3 – 42.3 | 29.3 |
| Min hock joint angle during swing (°) | 121.0 | 113.1 – 129.0 | 100.4* | 113.9 | 106.0 – 121.9 | 101.1* |
| Max hock joint angle during swing (°) | 167.9 | 161.1 – 174.8 | 147.5* | 160.2 | 152.9 – 167.5 | 162.6 |
| Full range of hock joint during swing (°) | 46.9 | 38.6 – 55.2 | 47.1 | 46.3 | 37.9 – 54.7 | 61.5 |
| Hock joint angular velocity during swing (°/s) | 230.5 | 176.0 – 284.9 | 213.6 | 228.0 | 172.1 – 283.9 | 345.3 |
| Contralateral hoof timing [RFH-LBH], (s) | 0.23 | 0.16 – 0.30 | 0.37 | |||
| Contralateral hoof timing [LFH-RBH], (s) | 0.24 | 0.18 – 0.30 | 0.31 | |||
In general, the sheep adapted well to this form of testing and, after SCI, it proved feasible to consistently measure limb movements with high spatial fidelity and reliability. The richness of the limb-movement data sets made it possible to objectively analyze specific components of each gait cycle, such as hock joint angular velocity, which would likely be affected by injury-induced spasticity, thus potentially giving insights into underlying neural mechanisms. Our findings demonstrated that the specific patterns of neurological deficits reflected in abnormal gait patterns varied across animals. Natural trial-by-trial variability in gait performance in the same animal, independent of injury related factors, was also observed and was factored into our analytical approach. Because of these complexities of the model, we found that the most robust and rigorous analysis of gait metrics across all of the conditions encountered could be carried out with SCS interventions that occurred during the course of a single experimental session on the treadmill. In that sense, this model proved well suited for testing the effects of acute epidural SCS, using the stimulation-on versus stimulation-off paradigm repeatedly during an individual gait measurement session.
Moreover, even though not all of the gait metrics were routinely affected after SCI, the summation of significantly affected metrics proved to correspond with the TIBS scores. The three sheep with the highest number of gait metrics consistently falling outside of the predicted range also had the lowest TIBS scores the first day post-injury and at the final TIBS assessment. As shown in Figure 5B, for those three sheep (30003, 40011, 40013) at least 20% of the gait metrics fell outside of the predicted range during all of their gait recording sessions.
In the sheep that underwent epidural SCS using our stimulation-on versus stimulation-off paradigm during its treadmill ambulation sessions, a more in-depth statistical analysis revealed that this approach to real-time neuromodulation produced significant, observable effects on the animal's gait at the higher stimulation intensities as compared to the lower ones. Of particular note, this animal demonstrated clinical evidence of post-injury hind limb spasticity and during both SCS sessions the hock joint angular velocity increased (towards the normal pre-injury baseline) with increasing stimulation intensity (Fig. 6). The highest stimulation intensity, 0.9 V, resulted in hock joint angular velocities of 146 °/s for the left hind limb and 195 °/s for the right. The 0.9 V stimulation days had Kruskal-Wallis P-values less than 0.001 for both hind limbs when compared to the day's “SCS off” baseline recording. The forward velocity of the back hooves during swing was another metric significantly affected by SCS. During both SCS sessions, the forward velocity of both back hooves increased (towards the pre-injury baseline) at the highest stimulation intensity.
Figure 6.
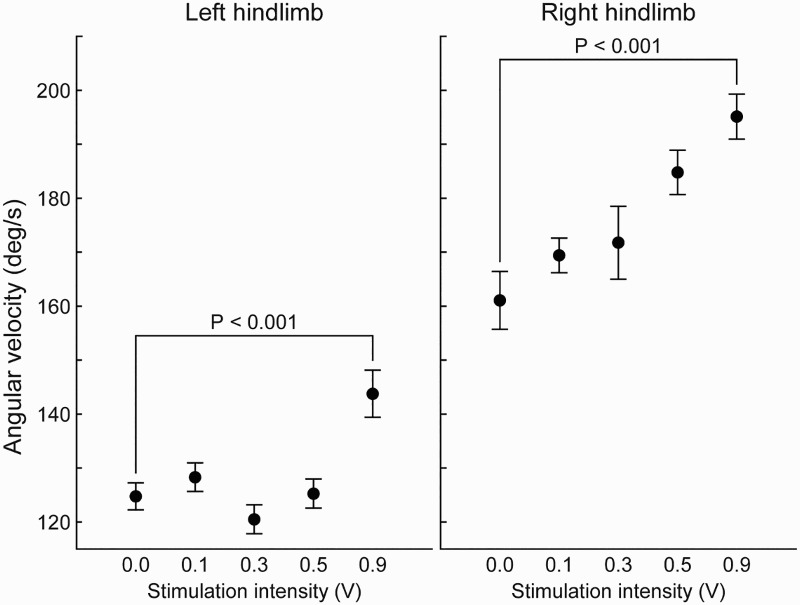
Effect of spinal cord stimulation during treadmill ambulation on the hock joint angular velocity in the sagittal plane of one sheep 34 weeks post SCI. P-values were calculated using the Kruskal-Wallis test. The pre-injury hock joint angular velocity during gait was approximately 300 °/s for both limbs. As SCS intensity is increased, the joint velocity for both limbs increases towards this pre-injury value
Ambulatory EMG measurements
Using the methods described above we are able to compare the relative timings and amplitudes of the various muscle groups during treadmill ambulation. Figure 7 shows representative chronic EMG data simultaneously recorded from multiple muscle groups in a naïve sheep during treadmill gait testing (the lead recording from the right vastus lateralis muscle was fractured). Figure 8 shows a comparison between two antagonistic muscle groups after the smoothing and averaging techniques were applied. As expected, and made clear by our analysis, the antagonistic muscles fire out of phase with each other during the gait cycle. Lead breakage over time can make it problematic to obtain full sets of pre- and post-injury recordings, but with care and persistence the issue is tractable.
Figure 7.

EMG signals recorded from 8 different muscles during treadmill ambulation. For both sides, the gastrocnemius and tibialis anterior (antagonists) fire out of phase from each other. Additionally, the contralateral limb muscles can be seen firing out of phase. Blue = left hind limb, red = right. Gas, gastrocnemius. VL, vastus lateralis. GB, gluteobiceps. TA, tibialis anterior.
Figure 8.

EMG measurements of the relative timing and amplitudes of antagonistic muscle actions over the time-normalized average of several gait cycles during treadmill ambulation.
H-reflex testing
We have performed this experiment in three sheep to date and have found that monosynaptic reflex responses are most consistently observed following stimulation of the peroneal nerve. H-reflex and M-wave responses were elicited and recorded using the procedure described above. In the preliminary data shown in Figure 9, stimulation of the peroneal nerve at an intensity level of 80 μA elicited an H-reflex recorded from the tibialis anterior muscle with an average latency of 10 ms. Sequentially increasing the stimulation intensity eventually led to abolishment of the H- reflex at a setting of ≈190 μA. Following the protocol described by Schindler-Ivens and Shields, 160 µA stimulation pulses were then delivered in pairs spaced 500 ms (2 Hz) apart in order to demonstrate rate-dependent depression. The stimulation pairs were delivered 5 seconds apart (0.2 Hz). The amplitude of the reflex wave in response to the second pulse (H2 in Fig. 10) was consistently lower than H1, demonstrating the rate-dependent depression expected in a normal subject. In our preliminary studies, including post-SCI testing, we have found that the monosynaptic reflex responses are most consistently observed following stimulation of the peroneal nerve.
Figure 9.

An example of an H-reflex response to stimulation in a naïve sheep. Stimulation pulses were 1 ms square waves delivered at a rate of 0.2 Hz. Stimulation intensity was increased from 80 to 210 µA, with the H-reflex abolished around 190 µA
Figure 10.

An example of H-reflex responses to 2 Hz stimulation pairs. The figure depicts 3 trials. Each trial consisted of two 160 µA stimulation pulses separated by 500 ms (2 Hz). Each trial was separated by 5 s (0.2 Hz). The magnitudes of the second H-reflexes (“H2″) in each trial are decreased, exhibiting rate-dependent depression
Stretch reflex testing
Multiple training sessions were required to acclimate the sheep to the suspension sling and the apparatus used to manipulate the hind limb. After being appropriately trained, the sheep reliably tolerated this testing for periods of ≈ 1 hr. As an example of the scale of forces observed, approximately 22 N (5 pounds) was required to rotate a spastic limb through 30° of motion at the hock joint. Figure 11A shows the presence of a speed-dependent resistive force in one of the testing sessions on a post-SCI sheep, thus suggesting the utility of the method for identifying spastic limb responses. However, as with the measurement of gait metrics, we note that there can also be high intrinsic variability in this approach across individual and multiple animals. Hence, we also made separate independent measurements in some of the animals via percutaneous EMG electrodes in the gastrocnemius which detected activity during hock joint rotations at higher velocities (Fig. 11B). These results too suggested the presence of post-SCI spasticity. Further, such measurements with additional animals will play an important role in confirming this observation.
Figure 11.

(A) Reaction force versus limb speed in a test of the stretch-reflex approach to evaluating spasticity in a post-SCI sheep. (B) Spontaneous EMG in the left gastrocnemius muscle during stretch reflex testing in the left hind limb. The joint was rotated at approximately 400 ° /s during this recording. The rectified, low-pass filtered (2nd order Butterworth, 10 Hz cutoff) EMG trace is shown at bottom
Improvements to the mechanical testing system and process are now being incorporated in order to increase the overall reliability of the method. In particular, more robust load cells able to withstand off-axis forces are being installed, and we are considering use of a linear-motor actuator to replace the rotational camshaft assembly and the manual techniques that were tested here for accelerating the animal's limb.
Discussion
In this report, we describe the development and testing of an ovine model of incomplete thoracic SCI. Our scientific motivation for creating this model is similar to that of other investigators who have carried out SCI research using large animal models.22,25,31,35 In contrast to rodent experimental preparations, the size of the spinal cord in large animals more closely approximates that of humans and this gross anatomical feature is an important variable that must be considered when testing the potential efficacy of new treatments intended for eventual clinical use in patients. When biologically active agents are delivered into the cerebrospinal fluid or through catheters implanted in the spinal cord parenchyma, the volumetric distribution of an agent will be influenced by the size of the spinal cord. Similarly, electrical stimuli delivered to the spinal cord will have markedly different patterns of neural activation depending on the relative locations and distances separating the stimulating electrodes and specific neural structures within the spinal cord.45,46 For these reasons, it is desirable if not essential that pre-clinical testing of SCS (including, eventually, intradural SCS) for applications of the type reported here be carried out in experimental animal models with spinal cords having a gross anatomical structure that is similar to those of humans. The adult sheep is particularly relevant in this regard. The nearly anthropomorphic diameter of its spinal cord makes it ideal for testing the performance of human-scale electrode arrays, and its correspondingly large vertebrae facilitate both acute and chronic evaluations of array fixation techniques.47
Other factors were also considered in addition to spinal cord size when developing this model. These include costs and veterinary care requirements, as well as the ability to obtain clinically meaningful behavior measures of spinal cord functions. Compared to other large experimental animal species we posited that sheep could be more readily trained to participate in a treadmill based gait analysis protocol and tolerate muscle reflex testing procedures without the requirement for sedation. Our experiences with the six sheep studied to date demonstrate the practical feasibility and potential scientific value of the model as well as a number of limitations and technical challenges.
The modified weight drop technique proved effective in creating an incomplete thoracic SCI. Based on initial experience gained from testing different impactor weights and sizes, as well as different drop heights above the spinal cord, a set of parameters were identified that proved most suitable for achieving the desired severity of injury. Using these optimized parameters, approximately two thirds of the injured sheep sustained a SCI that met the threshold needed to create measurable chronic neurological deficits, but not so severe as to preclude chronic survival without the need for long-term specialized veterinarian care. As has been reported in other studies of experimental SCI we also observed significant variability in the precise patterns of induced neurological deficit across animals even though the identical impactor device and injury parameters were used to create the injury.29,48,49 Hence the challenge we have addressed here, and which we will continue to further refine, is one of finding the threshold parameters for producing SCI that lead to sufficient spasticity, but not unrecoverable deficit. For all injured animals, close medical attention by skilled veterinary staff is required for approximately the first week after injury to avoid complications related to significantly reduced mobility. After recovery from the acute stage of the SCI, the animals begin their series of behavioral and electrophysiological tests that are carried out at different chronic post-injury time points. As the model is further refined, we will likely be able to define two (and possibly more) post-injury phases, e.g. sub-acute and chronic, into which significant changes can be grouped according to time intervals. Definitions vary50 but if there are significant, stable and observable differences, say in the first few weeks compared to months later, this would help achieve quantification of the neural plasticity during the recovery process following SCI. Such quantification would be useful in tailoring specific electrical stimulation protocols, for example by differentiating between the efficacies of tonic, burst and high frequency modes, as well as in the optimization of pharmacological therapies aimed at alleviating painful spasms.
Treadmill gait testing proved to be a particularly valuable research protocol for studying the behavioral effects of SCI. Prior to surgery sheep were readily trained to walk on a treadmill for extended time periods. They naturally assume a gait pattern that is highly regular with little variation in step-to-step limb movement mechanics.23 These movements could be precisely measured and quantified using the video image capture system thus generating large volumes of high quality data well suited for statistical analysis. Sheep continue to participate effectively in the treadmill protocol after induction of SCI. Even with significant new neurological injuries, sheep proved adept at entering into an altered, but regular gait pattern that allowed them to keep pace with the speed of the moving treadmill-walking surface. With further optimization of the SCI induction process, we anticipate that the resulting deficits will lead to higher percentages of kinematic metrics outside of the predicted ranges in greater numbers of sheep. They also tolerated walking while being attached to the EMG electrical lead bundle during gait testing and showed no evidence of being startled or distracted when electrical stimuli were delivered to the spinal cord. Measurement of the relative timing of front hoof and contralateral back hoof impact on the walking surface was included among the gait parameters studied, as this presumably reflects the consequences of dysfunction of spinal cord neural pathways that normally coordinate the relative timing of fore- and hind-limb movements.
Spasticity following SCI is a major public health problem and our sheep model appears well suited to studying this condition and testing the effects of therapeutic interventions using clinically relevant objective measures. Spastic animals have abnormal patterns of firing of antagonistic muscle groups in the effected extremities. Instead of sequentially altering the timing of muscle contractions during the different phases of limb movements, antagonistic muscle groups maintain pathologically increased levels of firing that persist throughout the gait cycle. In the sheep experimental preparation we demonstrated that antagonistic muscle group firing can be measured using chronic EMG electrodes as the sheep walks on the treadmill. The preliminary EMG findings are from normal sheep. Our initial attempts to perform recordings in the same animals several weeks to months following SCI were hampered by technical difficulties, particularly lead breakage. This problem has been addressed with improved lead designs that will be used in future experiments. We also use reflex testing to obtain objective measures of spasticity in effected extremities. With this approach, it is feasible to repeatedly quantify the relationship between the velocity of limb movement and the magnitude of resistive forces in the awake animal. We observed that with minimal training and acclimation sheep are remarkably tolerant of this form of testing.
Lastly, it has been our goal to be as quantitative as possible in both the assessment of the severity of SCI in the ovine model and in evaluating its response to potential therapeutic interventions and SCS in particular. The modified TIBS score, as described above, provides one means for assessment of SCI severity based on repeated observations of the functional abilities of the animal by skilled veterinary personnel. While those observations are translated into numerical scores which represent well-defined physical capabilities, there is always room for improved methodology and especially so when the sought-for motor deficits are intended to be relatively mild in nature. As this ovine model evolves with future work, an important question will be whether or not the TIBS approach or any similar such observational method is sufficient to resolve differences between degrees of SCI severity that might appear to be clustered together by functional ability, but that might nevertheless represent different states of injury. This is one of the reasons why we have been actively incorporating tools like the measurement of stretch reflex into our armamentarium. A useful analogy in that regard is the assessment of clonus in patients. A skilled clinician can easily identify the presence of spasticity in the limb of an individual with SCI upon physical examination, but evaluation of the degree of severity may vary somewhat from physician to physician. We expect that as our ovine model evolves, the results from measurements of response force versus limb actuation speed offered by stretch reflex testing will be combined with the kinematic parameters determined by gait analysis to yield finer gradations of SCI severity, both in the acute and plateau regimes of the injury timeline. Within that framework, the functional observation scales would continue to serve the primary role of guiding workers in terms of monitoring an animal's recovery from SCI surgery, readiness for participation in experiments, and long-term evolution of the injury, but would be augmented by quantitative assessments of physiological performance. This should also lead to greater insight into the variability reported in contusion injury models, and less dependence on it as an umbrella for explanation of the range of injuries encountered.
The overarching objective of the current study was to determine whether this ovine model of SCI is well suited to testing therapeutic interventions, particularly direct neuromodulation of the spinal cord using electrical stimulation. The results to date have been highly encouraging in that sheep can be easily trained for gait analysis, tolerate ambulatory EMG, H-reflex and stretch-reflex testing, and exhibit no apparent discomfort when the SCS is turned on and off during treadmill sessions. This ability to selectively manipulate one variable during a single experimental session introduces the possibility of investigating the effects associated with just that variable, thus minimizing the complications that can arise when tests are performed over different experimental sessions. This ability to selectively manipulate one variable during a single experimental session introduces the possibility of investigating the effects associated with just that variable, thus minimizing the complications that can arise when tests are performed over different experimental sessions. Our data, for example, clearly demonstrated that pathologically reduced hock joint angular velocity in a spinal cord injured sheep was significantly increased in a stimulus intensity dependent manner during spinal cord electrical stimulation. In future studies it will be feasible to electrically stimulate select pathways within the spinal cord and precisely measure the effects of this intervention of multiple behavioral and electrophysiological measures. For instance, joint angular velocities as measured in the tonic stretch reflex approach were introduced several years ago as a quantitative means of evaluating degree of spasticity,51 and form the basis for the Montreal Stretch Reflex Threshold (MSRT) scale.52 The work reported here with our ovine model begins the process of adapting that kind of measurement into a new experimental paradigm in which quantitative assessment of potential improvements can be made directly as a function of SCS test parameters.
Conclusions
In this report, we describe our experiences and results developing an ovine SCI model specifically designed to facilitate pre-clinical testing of new clinical SCI treatments. As with other large animal SCI models, the gross anatomy of the spinal cord more closely approximates that of humans than is the case with rodent and other small animal models. The particular advantage of the sheep model compared to other non-rodent species is the ease with which sheep can be trained to participate reliably in a gait experimental protocol before and after SCI, with and without SCS, and tolerate reflex testing without the need for pharmacological sedation. The main limitation of the model, as is the case with other reported SCI preparations produced using a weight drop technique, is the variability in severity of injury across injured animals. Although this occurs despite optimal control of relevant experimental variables, we will seek to minimize it by the constant improvement of experimental technique that comes from working with an ever increasing number of animals, the exploration of lower energy impact regimes and, in future work, the possible implementation of an auxiliary approach to spinal cord injury involving hemi-section of the spinal cord parenchyma.
Disclaimer statements
Contributors All authors have contributed significantly to the design of the study, the experimental work, the analysis of the data, and the preparation of this manuscript. The contents represent original work and have not been published elsewhere.
Conflicts of interest None.
Ethics approval The Institutional Animal Care and Use Committees at each site reviewed and approved this project.
Funding No external funding sources.
References
- 1.Spinal Cord Injury Facts and Figures at a Glance, Birmingham, Alabama: The National Spinal Cord Injury Statistical Center; 2012. [Google Scholar]
- 2.French DD, Campbell RR, Sabharwal S, Nelson AL, Palacios PA, Gavin-Dreschnack D.. Health care costs for patients with chronic spinal cord injury in the Veterans Health Administration. J Spinal Cord Med 2007;30(5):477–81. doi: 10.1080/10790268.2007.11754581 [DOI] [PMC free article] [PubMed] [Google Scholar]
- 3.Krueger H, Noonan VK, Trenaman LM, Joshi P, Rivers CS.. The economic burden of traumatic spinal cord injury in Canada. Chron Dis Inj Can 2013;33(3):113–22. [PubMed] [Google Scholar]
- 4.Access Economics Pty, Ltd The economic cost of spinal cord injury and traumatic brain injury in Australia. The Victorian Neurotrauma Initiative, June 2009, 115 pps. https://www.tac.vic.gov.au/about-the-tac/our-organisation/research/tac-neurotrauma-research/vni/the20economic20cost20of20spinal20cord20injury20and20traumatic20brain20injury20in20australia.pdf. [Google Scholar]
- 5.Adams MM, Hicks AL.. Spasticity after spinal cord injury. Spinal Cord 2005;43(10):577–86. doi: 10.1038/sj.sc.3101757 [DOI] [PubMed] [Google Scholar]
- 6.Sharif-Alhoseini M, Rahimi-Movaghar V.. Animal models in traumatic spinal cord injury. In: Dionyssiotis Y, ed., Topics in Paraplegia (InTech Press, Rijeka, Croatia, 2014), Chapter 10, 209–228. http://cdn.intechopen.com/pdfs-wm/46005.pdf [Google Scholar]
- 7.Kwon BK, Hillyer J, Tetzlaff W.. Translational research in spinal cord injury: a survey of opinion from the SCI community. J Neurotrauma 2010;27(1):21–33. doi: 10.1089/neu.2009.1048 [DOI] [PubMed] [Google Scholar]
- 8.James ND, Bartus K, Grist J, Bennett DLH, McMahon SB, Bradbury EJ.. Conduction failure following spinal cord injury: functional and anatomical changes from acute to chronic stages. J Neuroscience 2011;31(50):18543–55. doi: 10.1523/JNEUROSCI.4306-11.2011 [DOI] [PMC free article] [PubMed] [Google Scholar]
- 9.Zhao FY, Jeggo R, Wei H, Whyment A, Fang X, Spanswick D.. In vivo electrophysiological recording techniques for the study of neuropathic pain in rodent models. Curr Protoc Pharmacol 2014;66:11.15.1–11.15.26. [DOI] [PubMed] [Google Scholar]
- 10.Danilov CA, Steward O.. Conditional genetic deletion of PTEN after a spinal cord injury enhances regerative growth of CST axons and motor function recover in mice. Exp Neurol 2015;266:147–60. doi: 10.1016/j.expneurol.2015.02.012 [DOI] [PMC free article] [PubMed] [Google Scholar]
- 11.Hong PW, Jiang M, Li HD.. Functional requirement of Dicer1 and miR-17–5p in reactive astrocyte proliferation after spinal cord injury in the mouse. Glia 2014;62(12):2044–60. doi: 10.1002/glia.22725 [DOI] [PubMed] [Google Scholar]
- 12.Johnson MD, Kajtaz E, Cain C, Heckman CJ.. Motoneuron intrinsic properties, but not their receptive fields, recover in chronic spinal injury. J Neuroscience 2013;33(48):18806–13. doi: 10.1523/JNEUROSCI.2609-13.2013 [DOI] [PMC free article] [PubMed] [Google Scholar]
- 13.Frigon A, Johnson MD, Heckman CJ.. Differential modulation of crossed and uncrossed reflex pathways by clonidine in cats following complete spinal cord injury. J Physiol 2012;590.4; 973–989. doi: 10.1113/jphysiol.2011.222208 [DOI] [PMC free article] [PubMed] [Google Scholar]
- 14.Flouty OE, Oya H, Kawasaki H, Wilson S, Reddy CG, Jeffery ND, et al. A new device concept for directly modulating spinal cord pathways: initial in vivo experimental results. Physiol Meas 2012;33(12):2003–15. doi: 10.1088/0967-3334/33/12/2003 [DOI] [PubMed] [Google Scholar]
- 15.Dalm BD, Viljoen SV, Dahdaleh NS, Reddy CG, Brennan TJ, Oya H, et al. Revisiting intradural spinal cord stimulation: an introduction to a novel intradural spinal cord stimulation device. Innovative Neurosurgery 2014;2(104):13–20. [Google Scholar]
- 16.Gibson-Corley KN, Oya H, Flouty O, Fredericks DC, Jeffery ND, Gillies GT, et al. Ovine tests of a novel spinal cord neuromodulator and dentate ligament fixation method. J Invest Surg 2012;25(6):366–74. doi: 10.3109/08941939.2012.677967 [DOI] [PubMed] [Google Scholar]
- 17.Flouty OE, Oya H, Kawasaki H, Reddy CG, Fredericks DC, Gibson-Corley KN, et al. Intracranial somatosensory responses with direct spinal cord stimulation in anesthetized sheep. PLOS One 2013;8(2):e56266. doi: 10.1371/journal.pone.0056266 [DOI] [PMC free article] [PubMed] [Google Scholar]
- 18.Safayi S, Jeffery ND, Shivapour SK, Zamanighomi M, Zylstra T, Bratsch-Prince J, et al. Assessing neuromodulation in vivo by computerized gait analysis. Abstract NM-172, Minnesota Neuromodulation Symposium, Minneapolis April 16–17, 2015. http://neuromodulation.umn.edu/2015NMProgram.pdf.
- 19.Safayi S, Jeffery ND, Fredericks DC, Viljoen S, Dalm BD, Reddy CG, et al. Biomechanical performance of an ovine model of intradural spinal cord stimulation. J Med Eng Technol 2014;38(5):269–73. doi: 10.3109/03091902.2014.914257 [DOI] [PubMed] [Google Scholar]
- 20.Hamilton L, Franklin RJ, Jeffery ND.. Development of a universal measure of quadrupedal forelimb-hindlimb coordination using digital motion capture and computerized analysis. BMC Neuroscience 2007;8:77. doi: 10.1186/1471-2202-8-77 [DOI] [PMC free article] [PubMed] [Google Scholar]
- 21.Hamilton L, Franklin RJ, Jeffery ND.. Quantification of deficits in lateral paw positioning after spinal cord injury in dogs. BMC Vet Res 2008;4:47. doi: 10.1186/1746-6148-4-47 [DOI] [PMC free article] [PubMed] [Google Scholar]
- 22.Granger N, Blamires H, Franklin RJ, Jeffery ND.. Autologous olfactory mucosal cell transplants in clinical spinal cord injury: a randomized double-blinded trial in a canine translational model. Brain 2012;135(Pt 11):3227–37. doi: 10.1093/brain/aws268 [DOI] [PMC free article] [PubMed] [Google Scholar]
- 23.Safayi S, Jeffery ND, Shivapour SK, Zamanighomi M, Zylstra TJ, Bratsch-Prince J, et al. Kinematic analysis of the gait of adult sheep during treadmill locomotion: parameter values, allowable total error, and potential for use in evaluating spinal cord injury. J Neurol Sci 2015;358(1–2):107–12. doi: 10.1016/j.jns.2015.08.031 [DOI] [PubMed] [Google Scholar]
- 24.Ghazi SR, Gholami S.. Allometric growth of the spinal cord in relation to the vertebral column during prenatal and postnatal life in the sheep (Ovis aries). J Anat 1994;185(Part 2):427–31. [PMC free article] [PubMed] [Google Scholar]
- 25.Lee JH, Jones CF, Okon EB, Anderson L, Tigchelaar S, Kooner P, et al. A novel porcine model of traumatic thoracic spinal cord injury. J Neurotrauma 2013;30(3):142–59. doi: 10.1089/neu.2012.2386 [DOI] [PubMed] [Google Scholar]
- 26.Basso DM, Beattie MS, Bresnahan JC.. A sensitive and reliable locomotor rating scale for open field testing in rats. J Neurotrauma 1995;12(1):1–21. doi: 10.1089/neu.1995.12.1 [DOI] [PubMed] [Google Scholar]
- 27.Brown EG, Keller BA, Pivetti CD, Sitkin NA, Wang A, Farmer DL, et al. Development of a locomotor rating scale for testing motor function in sheep. J Pediatr Surg 2015;50(4):617–21. doi: 10.1016/j.jpedsurg.2015.01.002 [DOI] [PubMed] [Google Scholar]
- 28.Allen AR. Surgery of experimental lesion of spinal cord equivalent to crush injury of fracture dislocation of spinal column: a preliminary report. JAMA 1911;57(11):878–80. doi: 10.1001/jama.1911.04260090100008 [DOI] [Google Scholar]
- 29.Molt JT, Nelson LR, Poulos DA, Bourke RS.. Analysis and measurement of some sources of variability in experimental spinal cord trauma. J Neurosurg 1979;50(6):784–91. doi: 10.3171/jns.1979.50.6.0784 [DOI] [PubMed] [Google Scholar]
- 30.Yeo JD, Collins L.. The place of isotope myelography in the definition of spinal cord swelling following trauma: an experimental study. Aust N Z J Surg 1974;44(3):292–8. doi: 10.1111/j.1445-2197.1974.tb04423.x [DOI] [PubMed] [Google Scholar]
- 31.Yeo JD, Payne W, Hinwood B, Kidman AD.. The experimental contusion injury of the spinal cord in sheep. Paraplegia 1975;12(4):275–96. doi: 10.1038/sc.1974.45 [DOI] [PubMed] [Google Scholar]
- 32.Yeo JD, Stabback S, McKenzie B.. Central necrosis following contusion to the sheep's spinal cord. Paraplegia 1977;14(4):276–85. doi: 10.1038/sc.1976.45 [DOI] [PubMed] [Google Scholar]
- 33.Hinwood BG, Yeo JD, Kidman AD.. Monoamine and tissue fluid levels in contused spinal cord of sheep. J Neurochem 1980;35(4):786–91. doi: 10.1111/j.1471-4159.1980.tb07074.x [DOI] [PubMed] [Google Scholar]
- 34.Yeo JD, Hales JR, Stabback S, Bradly S, Fawcett AA, Kearns R.. Effects of a contusion injury on spinal cord blood flow in the sheep. Spine 1984;9(7):676–80. doi: 10.1097/00007632-198410000-00004 [DOI] [PubMed] [Google Scholar]
- 35.Jones CF, Lee JHT, Kwon BK, Cripton PA.. Development of a large-animal model to measure dynamic cerebrospinal fluid pressure during spinal cord injury. J Neurosurg Spine 2012;16(6):624–35. doi: 10.3171/2012.3.SPINE11970 [DOI] [PubMed] [Google Scholar]
- 36. Macro Sensors, Pennsauken, NJ, http://www.macrosensors.com/HSA_HSAR_750.html. Accessed 24 September 2016.
- 37. Macro Sensors, Pennsauken, NJ, http://www.macrosensors.com/downloads/manuals/LVC-4000%20User%20Manual%20-%20Rev%20H.pdf. Accessed 24 September 2016. [Google Scholar]
- 38.Zhong H, Roy RR, Nakada KK, Zdunowski S, Khalili N, de Leon RD, Edgerton VR.. Accommodation of the spinal cat to a tripping perturbation. Front Physiol 2012;3:112. doi: 10.3389/fphys.2012.00112 [DOI] [PMC free article] [PubMed] [Google Scholar]
- 39.Wang P, Low KH, McGrego AH, Tow A.. Detection of abnormal muscle activations during walking following spinal cord injury (SCI). Res Dev Disabil 2013;34(4):1226–35. doi: 10.1016/j.ridd.2012.12.013 [DOI] [PubMed] [Google Scholar]
- 40.Ravera EP, Catalfamo PA, Crespo MJ, Braidot AAA.. Electromyography as an important parameter for a proper assessment of dynamic muscles strength in gait analysis. Am J Biomed Eng 2012;2(6):269–77. doi: 10.5923/j.ajbe.20120206.06 [DOI] [Google Scholar]
- 41.Schindler-Ivens S, Shields RK.. Low frequency depression of H-reflexes in humans with acute and chronic spinal-cord injury. Exp Brain Res 2000;133(2):233–41. doi: 10.1007/s002210000377 [DOI] [PMC free article] [PubMed] [Google Scholar]
- 42.Bose PK, Parmer R, Thompson FJ.. Velocity-dependent ankle torque in rats after contusion injury of the midthoracic spinal cord: time course. J Neurotrauma 2002;19(10):1231–49. doi: 10.1089/08977150260338029 [DOI] [PubMed] [Google Scholar]
- 43.Bose PK, Hou J, Parmer R, Reier PJ, Thompson FJ.. Altered patterns of reflex excitability, balance, and locomotion following spinal cord injury and locomotor training. Front Physiol 2012;3:258. doi: 10.3389/fphys.2012.00258 [DOI] [PMC free article] [PubMed] [Google Scholar]
- 44.Agostinho FS, Rahal SC, Araújo FAP, Conceição RT, Hussni CA, El-warrak AO, et al. Gait analysis in clinically healthy sheep from three different age groups using a pressure-sensitive walkway. BMC Vet Res 2012;8:87. doi: 10.1186/1746-6148-8-87 [DOI] [PMC free article] [PubMed] [Google Scholar]
- 45.Holsheimer J. Which neuronal elements are activated directly by spinal cord stimulation. Neuromodulation 2002;5(1):25–31. doi: 10.1046/j.1525-1403.2002._2005.x [DOI] [PubMed] [Google Scholar]
- 46.Huang Q, Oya H, Flouty OE, Reddy CG, Howard MA III, Gillies GT, Utz M.. Comparison of spinal cord stimulation profiles from intra-and extradural electrode arrangements by finite element modelling. Med Biol Eng Comput 2014;52(6):531–8. doi: 10.1007/s11517-014-1157-7 [DOI] [PubMed] [Google Scholar]
- 47.Oya H, Safayi S, Jeffery ND, Viljoen S, Reddy CG, Dalm BD, et al. Soft-coupling suspension system for an intradural spinal cord stimulator: biophysical performance characteristics. J Appl Phys 2013;114(16):164701. doi: 10.1063/1.4827195 [DOI] [Google Scholar]
- 48.Koozekanani SH, Vise WM, Hashemi RZ, McGhee RB.. Possible mechanisms for observed pathophysiological variability in experimental spinal cord injury by the method of Allen. J Neurosurg 1976;44(4):429–34. doi: 10.3171/jns.1976.44.4.0429 [DOI] [PubMed] [Google Scholar]
- 49.De La Torre JC. Spinal cord injury models. Prog Neurobiol 1984;22(4):289–344. doi: 10.1016/0301-0082(84)90004-2 [DOI] [PubMed] [Google Scholar]
- 50.Kirshblum SC, Burns SP, Biering-Sorensen F, Donovan W, Graves DE, Jha A, Johansen M, Jones L, Krassioukov A, Mulcahey MJ, Schmidt-Read M, Waring W.. International standards for neurological classification of spinal cord injury (revised 2011). J Spinal Cord Med 2011;34(6):535–46. doi: 10.1179/204577211X13207446293695 [DOI] [PMC free article] [PubMed] [Google Scholar]
- 51.Calota A, Levin MF.. Tonic stretch reflex threshold as a measure of spasticity: implications for clinical practice. Top Stroke Rehabil 2009;16(3):177–88. doi: 10.1310/tsr1603-177 [DOI] [PubMed] [Google Scholar]
- 52.Levin MF, Feldman AG, Mullick AA, Rodrigues M.. A new standard in the objective measurement of spasticity. J Med Devices 2013;7(3):030909. doi: 10.1115/1.4024488 [DOI] [Google Scholar]