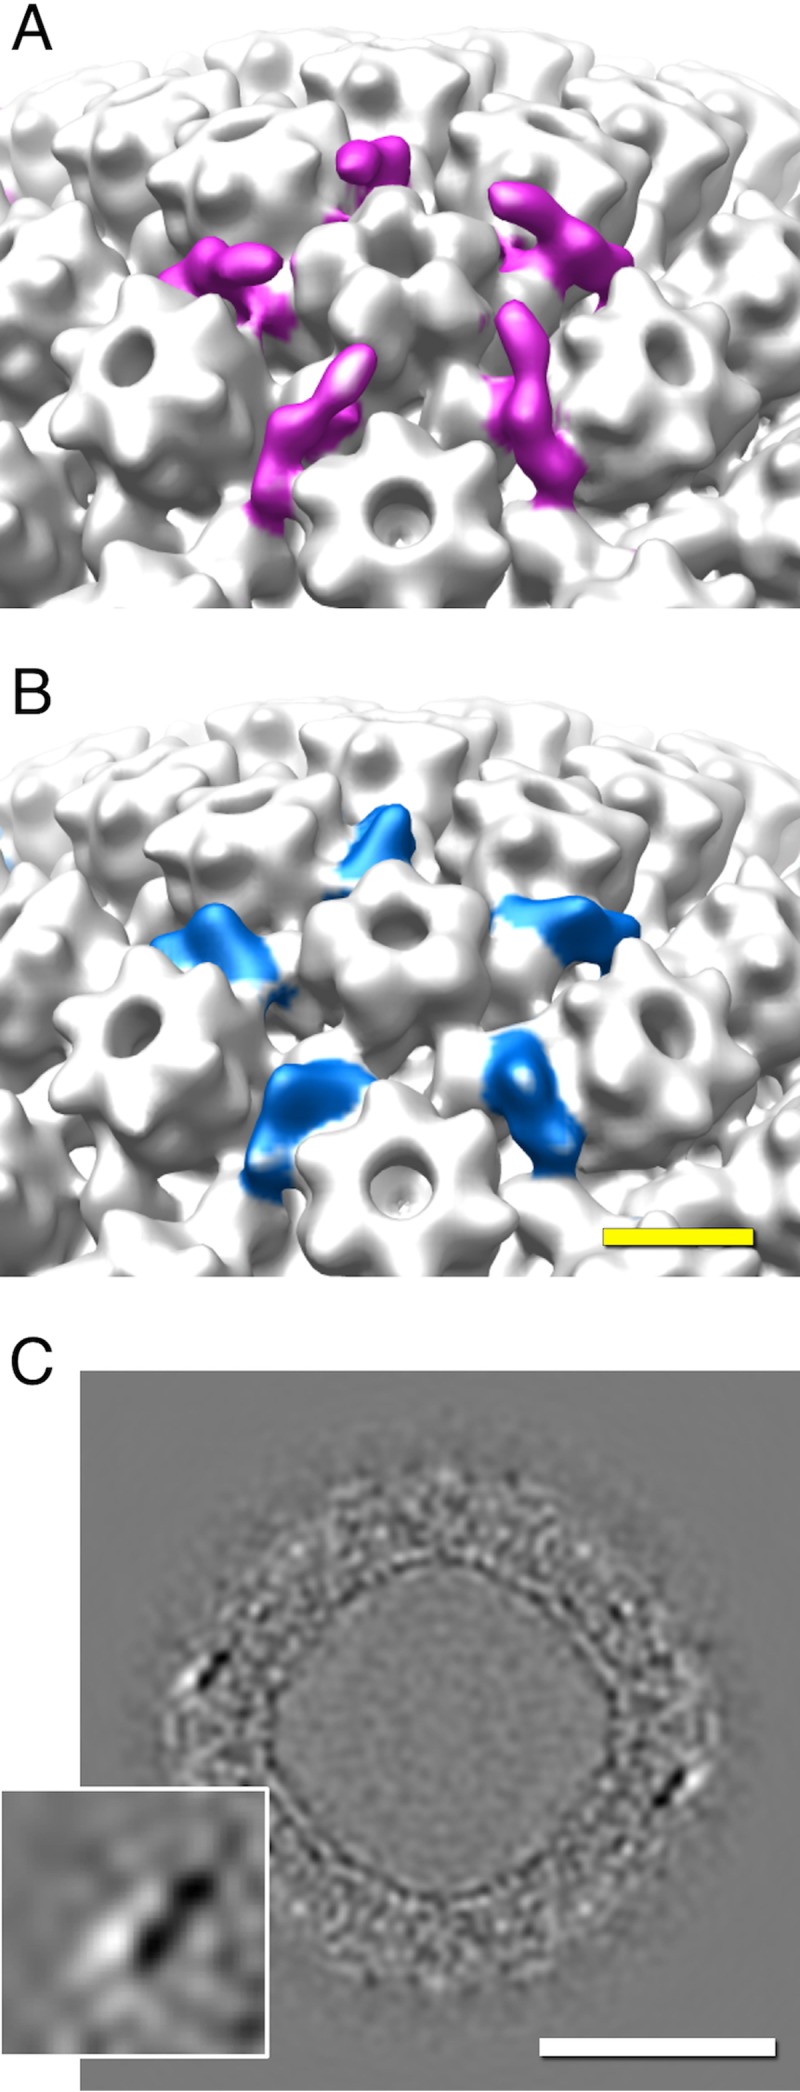
FIG 4 .

Structural changes in the CCSC upon being incorporated into a PEV. (A and B) Surface renderings of the surroundings of a vertex-located pUL19 penton with the CCSCs on a C-capsid (magenta in panel A) and a PEV (blue in panel B). (C) Grayscale section from the difference map, illustrating the change undergone by the CCSC (shown in the magnified inset at bottom left). Black, positive difference density; white, negative difference density. Scale bar = 50 nm.
