Abstract
RNA plays an important role in life processes. Imaging of messenger RNAs (mRNAs) and micro-RNAs (miRNAs) not only allows us to learn the formation and transcription of mRNAs and the biogenesis of miRNAs involved in various life processes, but also helps in detecting cancer. High-performance RNA imaging probes greatly expand our view of life processes and enhance the cancer detection accuracy. In this review, we summarize the state-of-the-art high-performance RNA imaging probes, including exogenous probes that can image RNA sequences with special modification and endogeneous probes that can directly image endogenous RNAs without special treatment. For each probe, we review its structure and imaging principle in detail. Finally, we summarize the application of mRNA and miRNA imaging probes in studying life processes as well as in detecting cancer. By correlating the structures and principles of various probes with their practical uses, we compare different RNA imaging probes and offer guidance for better utilization of the current imaging probes and the future design of higher-performance RNA imaging probes.
Graphical abstract

1 Introduction
RNA plays an important role in gene expression and regulation. For gene expression, mRNAs are the templates, while tRNAs and rRNAs are the transporters of amino acids and the catalysts, respectively. For gene regulation, siRNA (small interfering RNA), miRNA (microRNA) and shRNA (small hairpin RNA) can modulate gene expression in different ways. Learning gene expression and regulation not only increases the understanding of various life processes, but also helps in disease diagnosis and therapy1–3.
Visualization of gene expression and regulation can be implemented by imaging various RNAs4–9, mostly mRNAs4 and miRNAs5, 10, 11. The mRNAs play a central role in gene expression and regulation, and therefore learning the transcription6, localization7, transport8 and translation9 offers a lot of information on gene expression. The miRNAs are endogenous regulating RNAs that control the gene expression of mRNAs, and therefore the imaging of miRNAs tells a lot about the gene regulation of the corresponding mRNAs5, 10, 11.
In nature, RNAs themselves do not give out specific signals to enable imaging. Instead, imaging probes are specially designed to allow researchers to “see” the RNAs. Generally, most imaging probes have two necessary parts: the RNA-binding part and the imaging part. The RNA-binding part is mostly composed of RNA or DNA sequences that can bind to target RNAs or be inserted into target RNA sequences. On the other hand, the imaging part is much less constricted. All the imaging probes, such as fluorescence dyes, fluorescence proteins, bioluminescence dyes and fluorescence NPs, can be used as imaging parts only if they are stably conjugated to the RNA-binging part. In some cases, to improve the signal to noise ratio, a third part that can enhance the entire imaging signal or reduce the background signal is added.
RNA imaging probes can be divided into two types: probes imaging exogenous RNAs and probes imaging endogenous RNAs. They are quite different in structure and principle and are explained separately in this review. In the former type of RNA imaging probes, the target RNAs are not natural endogenous RNAs, but are RNAs with the external insertion of certain protein binding sequences, dye-binding sequences or dye-expressing sequences. The imaging probes then specifically interact with the inserted RNA sequence (except for the dye-expressing sequence), illuminating target RNAs. Currently, probes imaging exogenous RNAs include the RBP-FP (RNA binding protein-fluorescent protein) system, bimolecular fluorescence complementation (BiFC), RNA aptamer/fluorophore system and reporter gene system. However, in the latter type of RNA imaging probes, the endogenous RNAs are natural endogenous RNAs and do not need extra pre-treatment before imaging. The imaging probes generally bind to the target RNAs through base-pair complementation. This type of probe includes fluorescence in situ hybridization (FISH) probes, molecular beacons (MBs) and nano molecular beacons (Nano-MBs) and quencher-free probes. Fig. 1 summarizes the two types of general high-performance RNA imaging probes and their brief applications, as discussed in this review.
Fig. 1.
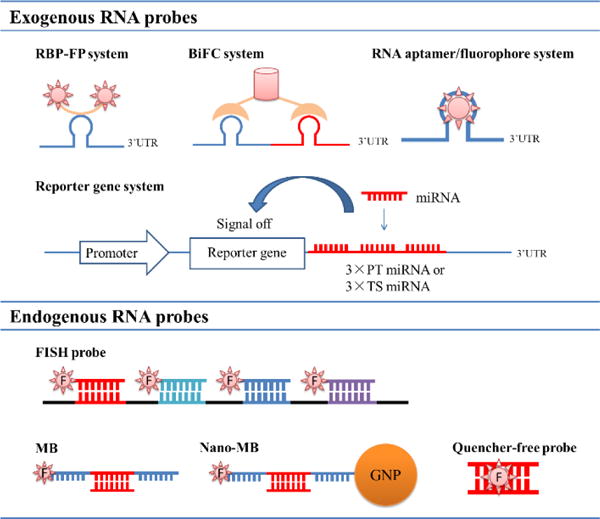
Graphical illustrations of various exogenous and endogenous RNA imaging probes binding to target RNAs, as discussed in this paper.
It is worth noting that this review mainly focuses on fluorescent and bioluminsescent RNA imaging probes, but there are several promising RNA nanoprobes with other optical methods such as surface-enhanced Raman scattering (SERS)12–15 and dark field16–18 methods. SERS-based RNA imaging probes have two distinct types: label-free SERS probes13–15 and nanotag-containing SERS probes17, 18. The former utilizes the distinct SERS signals of four miRNA bases upon adsorption to SERS substrates such as gold and silver. The nanotags in the latter type of Raman probe are generally Raman-active compounds and recognition nucleotide sequences, which image target RNAs through base-pairing and are structurally similar to the Nano-MBs in this study. Dark-field based RNA imaging probes16 are generally GNPs modified with recognition nucleotide sequences, which have plasmon coupling and change scattering signals in the presence of target RNAs. Both SERS-based and dark-field based RNA imaging probes are highly specific, highly sensitive and multiplexed and their applications mainly focus on the detection of miRNA tumour markers. Moreover, DNA-modified GNP based bio-barcode assay, which used a conventional gel electrophoresis platform and potassium cyanide chemistry, can also detect miRNA tumour markers with high specificity and sensitivity19. In contrast, fluorescent and bioluminescent RNA imaging probes have similar advantages, but have wider applications due to their more versatile structures. In this review, we first introduce the probes imaging exogenous RNAs, followed by probes imaging endogenous RNAs. After that, we analyze the application of the RNA imaging techniques in tracking RNA processes and cancer diagnosis. Finally, we briefly summarize this review and give some suggestions on the design of RNA imaging probe in different cases. Furthermore, we provide an outlook for the development of RNA imaging in vivo with even more sensitive imaging probes and advanced imaging technologies. There are also some other related excellent reviews, including RNA detection on a chip20, live-cell RNA imaging21–27, probes for biomolecular detection28–31 and miRNA imaging.32, 33
2 Probes imaging exogenous RNAs
Exogenous RNAs are RNAs with the external insertion of a certain protein-binding sequence, dye-binding sequence or dye-expressing sequence. Currently, probes imaging exogenous RNAs can be classified into four types: RBP-FP system, bimolecular fluorescence complementation (BiFC) system, RNA aptamer/fluorophore system and reporter gene system. For the RBP-FP system, the imaging probes specifically interact with the inserted protein-binding sequence and then illuminate target RNAs. For BiFC, the imaging probes are divided into two non-fluorescent parts and specifically interact with two different inserted protein-binding sequences in the same target RNAs. The BiFC probe will illuminate target RNAs only when the two parts of the imaging probes reunite correctly and it has much lower background than the RBP-FP system. For the RNA aptamer/fluorophore system, the imaging fluorophore interacts directly with the inserted RNA aptamer (dye-binding sequence) and illuminates the target RNA. This system images much faster than the RBP-FP system and BiFC system and can therefore be used in real-time imaging. For the reporter gene system, the inserted dye-expressing sequence can express fluorophores (such as GFP) or luciferase. After insertion into 3′UTR of reporter genes, the regulating miRNA can be indirectly imaged. Since all these probes must work in cooperation with their corresponding RNAs with proper pre-treatment, they are classified as probes imaging exogenous RNAs.
2.1 RNA binding protein-fluorescent protein system (RBP-FP system)
As shown in Fig. 2a34, the RBP is an MS2 coat protein (MCP) that can specifically bind to MBS (MS2 binding sequence, an RNA sequence) and the FP is GFP. To image target mRNA, the mRNA was pre-treated to contain six units of MBS in the 3′-UTR (untranslated region), and then the MCP-GFP fusion protein was added into the cells containing pre-treated mRNA. The MCP-GFP fusion protein then binds to the target mRNA and illuminates the target mRNAs. Fig. 2a shows the binding of MCP-GFP fusion protein to six units of MBS in the 3′-UTR of target mRNAs through the interaction between MCP and MBS. With this system, the localization and transport of ASH1 mRNA particles in living yeast was tracked34.
Fig. 2.
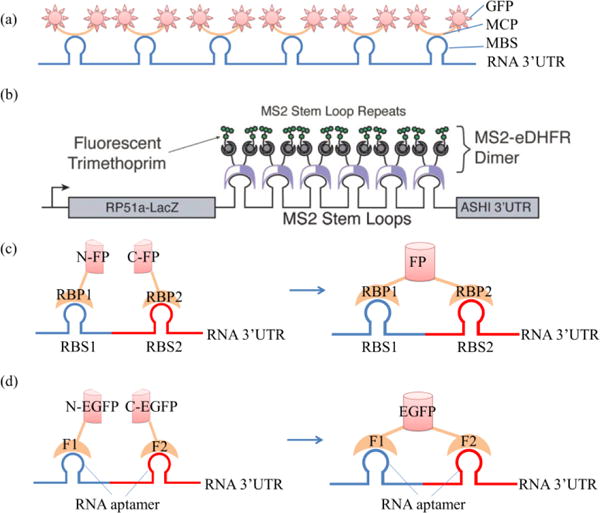
(a) Structure of the MS2-GFP based RBP-FP system: MCP, MS2 coat protein; MBS, MS2 binding sequence; UTR, untranslated region; (b) structure of MS2-eDHFR based RBP-FP system, adapted with permission from Carrocci and Hoskins37; (c) structure of the BiFC system: RBP, RNA binding protein; FP, fluorescent protein; RBS, BRP binding sequence; (d) structure of the aptamer-protein based BiFC system38.
The increase of binding fluorophores can further enhance the signal in the RBP-FP system. Singer and his colleagues inserted 24 repeats of MBS in the 3′-UTR of one single mRNA molecule so that one mRNA molecule could bind 24 molecules of MCP-YFP35. After combing with FISH probes, they realized the detection and localization of single β-actin mRNA molecules in various tissues of a mouse35. Furthermore, Park et al.36 used the MS2-GFP system to develop a transgenic mouse model where all β-actin mRNA (containing MBS in the 3′-UTR) were fluorescently labelled.
MCP-GFP and MCP-YFP combinations, as well as other RBP-FP combinations can be used to image RNAs. Horcine et al.39 realized the dual colour imaging of two MDN1 alleles by applying two RBP-FP pairs. Specifically, they applied two RBP-FPs (green PCP-2yEGFP and red MCP-mCherry) to image two alleles: MDN1-24PP7 (MDN1 with insertion of 24 PP7 binding sequences) and MDN1-24MS2 (MDN1 with insertion of 24 MS2 binding sequences)39. Furthermore, a more versatile RBP-FP system was developed by combining small molecule fluorophores with fusion proteins of MS2 and dihydrofolate reductase (MS2-eDHFR) (Fig. 2b) or the SNAP tag (MS2-SNAP). In this system, MS2-eDHFR or MS2-SNAP first binds to target RNA sequences with the insertion of MBS and the RNA remains non-fluorescent. Then, related small molecule fluorophores are added to image the RNA, since the MS2-eDHFR and MS2-SNAP can interact with a wide range of small molecule fluorophores37. Since the MS2-eDHFR or MS2-SNAP based system can accommodate a wide range of small molecule fluorophores, red fluorophores can be easily added into this system to reduce cell autofluorescence, which generally has emission wavelengths shorter than 600 nm. The RBP-FP system and its modification systems can image mRNA with high resolution and even track single mRNA movement, and are therefore very suitable for imaging the mRNAs of housekeeping genes whose 3′-UTR is well known and conveniently edited. However, the main disadvantage of this system is that there is always background fluorescence. The reason is that excess RBP-FPs are usually added to the cells or tissues to increase binding efficiency to reporter mRNAs. The unbound RBP-FPs are also fluorescent and therefore contribute to the background. In some cases, background signals can be eliminated by special mathematical methods. For example, the signals of non-mRNA-binding fluorescent proteins can be distinguished from those that are mRNA-binding, according to different diffusion coefficients40.
2.2 Bimolecular fluorescence complementation system
To reduce the background signal from the RBP-FP system, bimolecular fluorescence complementation (BiFC)41 was incorporated into RNA imaging42–44. In BiFC, FPs are split into two complementary non-fluorescent parts: N-terminal FPs (N-FPs) and C-terminal FPs (C-FPs). Since neither N-FPs nor C-FPs is fluorescent, the background from free protein becomes negligible.
As shown in Fig. 2c, the BiFC system uses two different RBPs conjugated to two halves of split FPs, namely, RBP1-N-FP and RBP2-C-FP. In the MCP-PCP based BiFC system45, the two RBPs are MCP and PCP (PP7 bacteriophage coat protein). To image target RNAs, the RNAs are pre-treated with the insertion of MBS and PBS (PP7 binding sequence). First, the N-FP-MCPs and C-FP-PCPs bind to MBS and PBS in the target RNAs, respectively. Next, the bound N-FP and C-FP will be in close proximity and spontaneously fuse to form complete fluorescent FPs45, imaging the target RNAs.
There is another type of BiFC system in which the interaction between RBP and RNA is based on the aptamer protein interaction, named the aptamer-protein based BiFC system (Fig. 2d). Valencia-Burton et al. fused two fragments of eukaryotic initiation factor 4A (eIF4A) to two halves of the split EGFP. The fusion proteins were then bound to target RNA with the eIF4A interactive aptamer sequence inserted in the 3′-UTR of the gene. Binding two fragments of eIF4A to the aptamers brings the EGFR fragments into close proximity to reconstitute a functional FP38. As an alternative to the eIF4A based BiFC system, a small viral peptide based BiFC system, was developed. Yiu et al. fused HTLV-Rex peptide and lN peptide to two halves of EGFP and successfully imaged target RNA sequences with HTLV-Rex aptamer and lN aptamer in bacteria cells46.
The abovementioned three types of BiFC system (MCP-PCP based, PUMHD based and aptamer-protein based BiFC system) all apply fusion proteins of RBPs and split FPs and have similar imaging principles, and therefore have lower background compared to RBP-FP systems. However, the BiFC system still has some limitations45: (1) it has a diffusive background since free N-FPs and C-FPs at high concentration fuse spontaneously to form FPs in the absence of reporter RNAs; (2) it takes time for N-FP and C-FP to fuse together, and therefore this method is only suitable for the visualization of long-lived RNAs; (3) the fusion of N-FP and C-FP is irreversible and therefore the method is not suitable for visualizing real-time transcription.
2.3 RNA aptamer/fluorophore system
Fig. 3a shows the structure of a RNA aptamer/fluorophore system. The RNA aptamer is pre-inserted in the 3′-UTR of target RNAs and the fluorescence of the fluorophore significantly increases in the presence of target RNA, compared to that in the absence of target RNA. RNA aptamer/fluorophore systems utilize the aptamer-fluorophore interaction, instead of the RNA-RBP interaction in the RBP-FP systems or BiFC systems. The binding between the aptamer and small molecule fluorophore is fast, and therefore this system enables real-time imaging. In this system, RNA aptamers are screened so that they can greatly enhance the fluorescence of fluorophores. The most studied fluorophore is difluoro-4-hydroxybenzylidene imidazolinone (DFHBI) (Fig. 4b), which is a commercial dye mimicking the structure of eGFP.
Fig. 3.
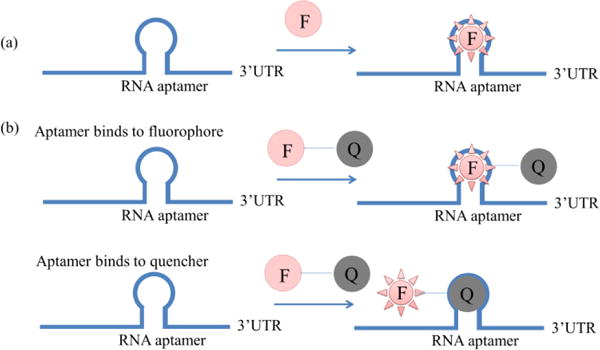
Different structures of RNA aptamer/fluorophore systems: (a) the initial RNA aptamer/fluorophore system,47 where the RNA aptamer is pre-inserted into the 3′UTR of the target RNA and after the binding of fluorophore (F) to the RNA aptamer, the fluorescence of F will greatly increase; (b) two types of RNA aptamer/fluorophore system with quencher, one with aptamer binding to fluorophore54 and one with aptamer binding to quencher55.
Fig. 4.
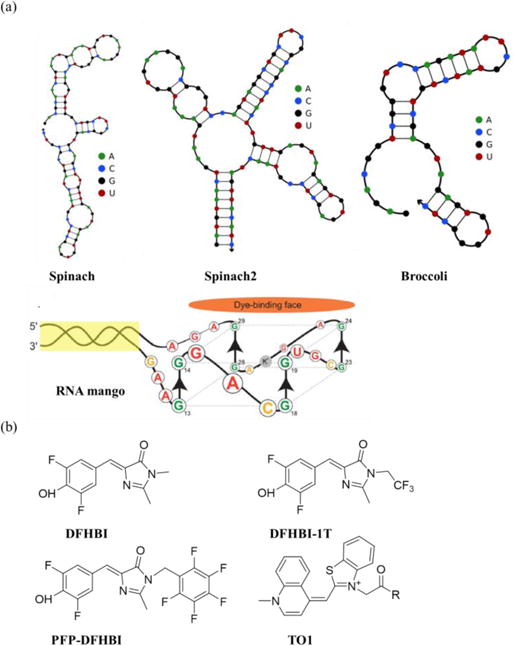
(a) Secondary structures of RNA aptamers in the RNA aptamer/fluorophore system: Spinach47, Spinach249, Broccoli52 and RNA mango56; structures of Spinach, Spinach2 and Broccoli were generated using the NUPACK online tool, and the structure of RNA mango was adapted with permission (ACS chemical biology 2014, 9 (10), 2412–2420, DOI: 10.1021/cb500499x),56 Copyright (2014) American Chemical Society. (b) Chemical structures of fluorophores in the RNA aptamer/fluorophore systems: DFHBI, DFHBI-1T57, PFP-DFHBI58, TO156.
Spinach aptamer, selected by the SELEX method, is a DFHBI-binding aptamer that enhances the fluorescence of DFHBI 2000 times (Fig. 4a)47. Therefore, DFHBI can bind to Spinach aptamer-fused 5S RNAs and image their live-cell dynamics47. Furthermore, a tandem Spinach array shows up to about 17-fold higher fluorescence by accommodating 8–64 repeats of Spinach aptamers in target RNAs48. However, the Spinach aptamer-DFHBI system suffers from limited folding efficiency and thermal instability. The Spinach2 aptamer-DFHBI system can partly solve the problems (Fig. 4a)49 since both Spinach and Spinach2 aptamers bind to DFHBI depending on the G4 quadruplex structure,50, 51 which relies on temperature and salt concentration. To overcome the salt-dependency of the Spinach and Spinach2-DFHBI systems, researchers developed the Broccoli aptamer-DFHBI system, which shows brighter fluorescence and less magnesium dependency52. The reason is that the Broccoli aptamer (Fig. 4a) does not need extra tRNA arms to fold and does not contain the salt-sensitive G4 quadruplex structure. The more advanced selection method, the microfluidic assisted In Vitro Compartmentalization (mIVC) procedure, leads to the selection of the iSpinach aptamer, which is able to work at high temperature and in a potassium free environment53.
In addition to DFHBI, there are other alternative fluorophores for RNA aptamer/fluorophore systems, such as DFHBI-1T, PFP-DFHBI, and TO1 (Thiazole Orange) (Fig. 4b). DFHBI-1T exhibits lower background fluorescence than DFHBI when incubated with cells57. Spinach2-DFHBI-1T exhibits increased fluorescence when imaged with GFP filter cubes due to improved excitation of the complex and lower background fluorescence57. PFP-DFHBI exhibits 5-fold higher binding affinity to Spinach2 than DFHBI. Therefore, Spinach2-PFP-DFHBI shows 3–4-fold brighter fluorescence and less salt concentration dependency58. TO1 can greatly enhance its fluorescence by binding to G4 quadruplexes containing aptamers. RNA Mango aptamer-TO1 (Fig. 4) exhibits 1,100-fold fluorescence, compared to free TO1, and successfully images the binding and release of 6S RNA in vitro56.
After conjugation to quenchers, the fluorophores with high background fluorescence can also be applied in RNA aptamer/fluorophore systems (Fig. 3b). Fluorophore-quencher conjugates have low background and can image target RNAs containing fluorophore aptamers. In Sunbul’s study, the fluorophore sulforhodamine B (SR) was first conjugated to the quencher dinitroaniline (DN) to form SR-DN conjugates. After binding to the SRB-2 aptamer, the quantum yield of SR-DN increased 25-fold54. Alternatively, fluorophore-quencher conjugates can also image target RNAs containing quencher aptamers. In Arora’s study55, the quencher DN was conjugated to a wide range of fluorophores, including fluorescein-dinitroaniline (FL-DN), rhodamine green-dinitroaniline (RG-DN), tetramethylrhodaminedinitroaniline (TMR-DN), sulforhodamine-dinitroaniline (SR-DN) and TexasRed-dinitroaniline (TR-DN). These fluorophores span the entire range of the visible spectrum. After combination with the DN-binding aptamers (DNB aptamers), the fluorophore-DNs can be used to image RNAs in a wide spectral range. Furthermore, two fluorophores with FRET effect can image target RNAs containing fluorophore aptamers, in which the acceptor fluorophores are non-fluorescent in the absence of target RNAs. In Shin’s study, Cy3 and Cy5 were used in the live-cell imaging of polymerase II transcriptional activity in real time59 with their aptamers inserted in target polymerase II mRNA.
In all, RNA aptamer/fluorophore systems have three advantages. First, the fluorescence in this system emerges more rapidly than in the RBP-FP system and BiFC system since the fluorescence only needs transcription of the RNA aptamer and the formation of the fluorophore-RNA aptamer complex is much faster than that of RBP-FP binding to the RNA sequence in the RBP-FP system or that of fusion of N-FPs and C-FPs in BiFC; therefore, the RNA aptamer/fluorophore system is suitable for real-time tracking of RNAs. Second, the background of the RNA aptamer/fluorophore system is low, since the fluorophores have low fluorescence in the freestate or quenched state. Third, the system is resistant to photo-bleaching and is also suitable for long-time tracking of RNAs.
2.4 Reporter gene system
Reporter gene systems are specifically applied in miRNA imaging.32, 60–63 MiRNAs, which are generally 21–25 nt single-stranded RNAs, are sequence specific regulators that can control the regulation of various genes64, 65. Therefore, the reporter gene systems mostly focus on the imaging of the function of mature miRNAs,66–71 although imaging of pri-miRNA (primary miRNA) transcription, pri-miRNA cutting, ds-miRNA (miRNA-miRNA*) and miRNA function that destabilizes mRNA or inhibits target genes are also studied.60 In this section, we focus on the imaging of single-stranded miRNA function by reporter gene systems.
Fig. 5a shows the typical structure of a reporter gene system. A strong promoter (usually CMV) was inserted into the 5′-end of the reporter gene and three repeats of miRNA target sequences (3×TS_miRNA) or miRNA perfect targets (3×PT_miRNA) were inserted into the 3′-UTR of the reporter gene (CMV/Reporter gene/3×TS_miRNA). Genes of GFP or luciferase (Fluc, Gluc and Rluc) are often used as reporter genes, with the former expressing fluorescent proteins and the latter emitting bioluminescence in the presence of corresponding substrates (coelenterazine for Rluc or Gluc and D-luciferin for Fluc)63. In the presence of target miRNAs, the miRNAs will bind to the 3×TS_miRNA and inhibit the gene expression of reporter genes, leading to a reduction in fluorescence signal or bioluminescence signal. Bioluminescent reporter gene systems are more suitable for miRNA imaging in vivo than fluorescent reporter gene systems72 since the reporter gene system is a negative system and the background of the former is much less than that of the latter.
Fig. 5.
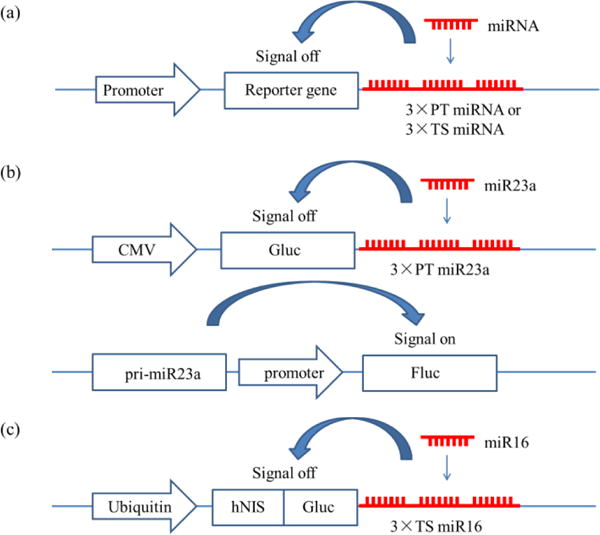
Structures of reporter gene systems: (a) the general structure of the reporter gene system, Promoter/Reporter gene/3×PT_miRNA or Promoter/Reporter gene/3×TS_miRNA60; (b) dual reporter gene systems with bioluminescence imaging,73 CMV/Gluc/3×PT_miR23a and primiR23a/promoter/FLuc; (c) dual reporter gene systems with PET and biolumine-scence imaging,74 ubiquitin/hNIS/Fluc/3×TS_miR16.
Kim et al.68 applied a CMV/Gluc/3×PT_miR221 reporter gene system and found overexpression of miR221 in papillary thyroid carcinoma (PTC), demonstrating that the reporter gene system can be used to quantify endogenous miRNAs in vitro and in vivo. Tu et al.69 applied a CMV/Gluc/3×PT_miR22 reporter gene system and observed overexpression of miR22 in cardiac hypertrophy. They further used antagomir-22 to knock down miR-22 and reversed the repressed Gluc activities in vitro and in vivo. Ko et al. applied a CMV/Gluc/3×PT_mi124a reporter gene system71, illustrating the miR124a-dependent decrease of Gluc reporter activity during neuronal differentiation70. Wang et al. developed a CMV/Fluc/3×TS_miR21 reporter system to image anti-miR2167. Once exogenous anti-miR-21 oligonucleotides carried by GO-PEG-dendrimer enter the cells, they inhibit the functions of miR-21, and therefore block miR-21 from binding to the 3′-UTR of luciferase, activating the luciferase reporter and inducing bioluminescence67.
The reporter gene systems can also be coupled with other reporter gene systems or other imaging methods to offer more information on miRNA imaging. Lee et al.73 (Fig. 5b) applied a CMV/Gluc/3×PT_miR23a reporter gene system and miR23a promoter/Fluc to monitor expression and posttranscriptional regulation of miR23a, which reveals information on transcription of pri-miR23a, which is very useful in tracking the behaviour of miR23 during differentiation. Wang et al.74 constructed a dual reporter gene system in one vector as ubiquitin/hNIS/Fluc/3×TS_miR16 (Fig. 5c). Using positron emission tomography (PET) imaging through hNIS and bioluminescence imaging through Fluc, the miR16 was quantified and the involvement of miR16 in the chemoresistance of gastric cancer was demonstrated.
The exogenous RNA imaging systems mentioned above have quite distinct structures and principles. Each imaging system works for certain RNA imaging. For RNA imaging by the RBP-FP system, BiFC system and RNA aptamer/fluorophore system, the RNAs need to accommodate corresponding RNA sequences without affecting the properties of RNAs. For short RNAs, like miRNAs, siRNAs, and shRNAs, these systems are not suitable, since the added sequence will significantly change the properties of the RNAs. For long RNAs, such as mRNAs, rRNAs and tRNAs, although extra RNA sequences can be easily inserted into the sequences, it is unknown whether these insertions will lead to malfunction of the RNAs. Therefore, the RBP-FP system, BiFC system and RNA aptamer/fluorophore system are more often used to image well-known mRNAs and rRNAs as well as tRNAs, whose lengths and non-functional sequences are clear. It should be noted that reporter gene imaging systems only work for miRNAs, but not other for RNAs.
3. Probes imaging endogenous RNAs
Unlike probes imaging exogenous RNAs, probes imaging endogenous RNAs do not need to incorporate certain RNA sequences in target RNAs or transcribe reporter genes. They contain recognition sequences and image endogenous RNAs through base-pairing complementation.
In this section, we introduce FISH probes, MBs, nano-MBs and quencher-free probes. FISH probes are generally ssDNAs or ssRNAs tagged with fluorophores and can image target RNAs with high resolution due to the presence of a large amount of probes. FISH probes are often applied to image RNAs in fixed cells. MBs are ssDNAs or ssRNAs with stem-loop structures (or β-hairpin structures), where a fluorophore and a quencher are in the stem part and the recognition sequence lies in the loop area. The MB is not fluorescent at the stem-loop structure, but becomes fluorescent in the presence of target RNAs; therefore, MB probes also have low background signals. MBs cannot enter cells themselves, and therefore for live-cell imaging, a gene carrier is needed to deliver the probes. Furthermore, nano-MBs refer to those MBs in which NPs are incorporated to act as both the quencher and the carrier, and no additional gene carriers are needed to deliver the probes. Nano-MBs also have very low background. Quencher-free probes are ssDNAs or ssRNAs that contain special fluorophores, which are non-fluorescent in ssDNA or ssRNA structure, but become fluorescent in DNA/RNA duplex or dsRNA structure. Typical quencher-free probes include single dye forced intercalation (FIT) probes and exciton-controlled hybridization-sensitive fluorescent oligonucleotide (ECHO) probes.
3.1 FISH probes
FISH technology was developed in 1980s and was initially used in genome imaging27, 75. FISH probes for RNA imaging are a group of ssDNA, ssRNA or hybrid ssRNA/DNA sequences tagged with same fluorophores, with the sequences complementary to different parts of the target RNAs (Fig. 6a).
Fig. 6.
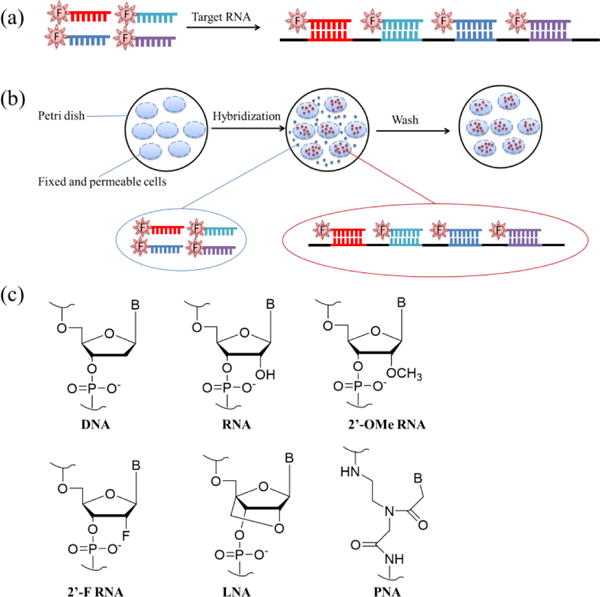
(a) Scheme of FISH probes, showing a group of ssDNAs labelled by the same fluorophore that can bind to different parts of target RNAs.77, 79 (b) FISH procedures33: (i) fix cells and increase cell permeability; (ii) incubate FISH probes with cells and allow their hybridization with target RNAs; (iii) wash the cells to remove weakly bound FISH probes. (c) Chemical structures of chemically modified nucleic acids: 2′-OMe RNA, 2′-F RNA, LNA and PNA81.
Since FISH probes are fluorescent in the absence of target RNAs, the background signal would be high if the free FISH probes are not removed. Therefore, FISH probes can only image RNAs in fixed-cells where the cells are under pre-treatment and the free FISH probes can be removed. For general RNA imaging with FISH probes, a typical procedure is as follows (Fig. 6b)33: first, there is cell fixation and permeabilization, where tissues or cells are fixed and lipids in the membrane are then removed to increase cell permeability. This step is a must, since FISH probes are negatively charged DNA or RNA sequences and they cannot automatically enter live cells. Cell permeaiblization allows FISH probes to enter cells through the holes on the cell surface. Second, there is hybridization of FISH probes with target RNAs, where FISH probes are added to pre-treated cells and allowed to hybridize with target RNAs. This step (Fig. 6b) is necessary to remove all the unbound FISH probes, except for FRET-based FISH probes76, whose background signals are low. Third, there is the removal of weakly bound FISH probes, where non-specifically bound FISH probes and free FISH probes are washed away. Finally, there is the detection of target RNAs, where the pre-treated samples are then observed under fluorescence microscope33.
FISH probes often have high sensitivity because several oligonucleotide probes are located on adjacent sequences on an RNA target such that their collective fluorescence will be emitted as a point source after hybridization. Therefore, they can be used to quantify the copy numbers of target RNAs. Femino et al.77 used 10 FISH probes (61–64 nt, each with 6 Cy3) to hybridize with β-actin mRNA and 11 FISH probes (50–61 nt, each with 5 FITC) to label the β-actin nascent transcript (Fig. 6a), not only quantifying the copy numbers of the mRNA and the transcript, but also learning the transcription kinetics of β-actin mRNA. Similarly, Treck et al.78 used 4–10 FISH probes (50 nt, each with 4–5 fluorophores) and quantified the copy numbers of single-mRNAs in budding yeast cells. However, this method has two caveats: high nonspecific binding to non-target RNAs and complicated synthesis of probes79.
To reduce nonspecific binding and simplify the synthesis of FISH probes, much shorter probes tagged with the same single fluorophore were used to image single molecular mRNA. It turned out that the improved probes can image single molecular mRNA at high resolution, and the nonspecific binding is negligible79. Similarly, three sets of probes, each containing 48 FISH probes (20 nt) labelled with the same fluorophores, were applied to imaging three mRNAs (ERBB2(red), AKT1 (green) and AKT3 (blue) mRNA) simultaneously. Moreover, they accurately quantified two of the mRNAs (ERBB2 and AKT1 mRNA), which were in accordance with the results of the immunoFISH method80.
Chemical modifications of FISH probes81 can greatly improve their imaging properties33. Fig. 6c shows typical chemical modifications on nucleic acid, where 2′-O-methyl RNA (2′-OMe RNA) and 2′-F RNA have better chemical stability than unmodified RNA; lock nucleic acid (LNA) and peptide nucleic acid (PNA) are modified on the bone structure and also have better chemical stability than common nucleic acid (DNA or RNA). After the incorporation of 2′-F RNA in ssDNA FISH probes, the 2′-F RNA/DNA probes have increased binding and better nuclease resistance than conventional hybrid ssRNA/DNA FISH probes82. Similarly, ssLNA (locked nucleic acid)/DNA FISH probes also have faster hybridization and higher efficiency83, and 2′-O-methyl RNA/LNA FISH probes have higher affinity for target RNA84.
Employment of a nucleic acid amplification method can substantially increase the signal of FISH probes. Choi et al. incorporated the hybridization chain reaction (HCR) method into FISH probes for signal amplification (Fig. 7a)85. In detail, the FISH probes include three parts: initiator containing recognition sequence, H1 hairpin with one fluorophore and H2 hairpin with the same fluorophore. To image target RNA, the initiator is first allowed to hybridize with target RNA, and then the H1 strand and H2 strand are sequentially and repeatedly bound to the hybrid duplex. Later, a long amplification polymer containing alternative H1 and H2 strands with multiple fluorophores for one target RNA is formed, leading to signal amplification. Using five sets of such FISH probes with distinguished fluorophores, five target mRNAs were imaged successfully in fixed whole-mount and sectioned zebrafish embryos85. Ge et al. incorporated the rolling cycle amplification (RCA) method (Fig. 7b) into FISH probes to image miR-222 in SMMC-7721 human hepatoma cells and L02 hepatocyte cells86. The components in this RCA method include a circular DNA, dNTP, DNA polymerase and detection probe (ssDNA labelled with fluorophore). For target miRNA imaging, the circular DNA will first bind to target miRNA and then a long tandem duplex with numerous fluorophores will be synthesized through in situ RCA, enabling signal magnification for each miRNA molecule. Similarly, Deng et al. also successfully imaged let-7a miRNA using RCA amplification87.
Fig. 7.
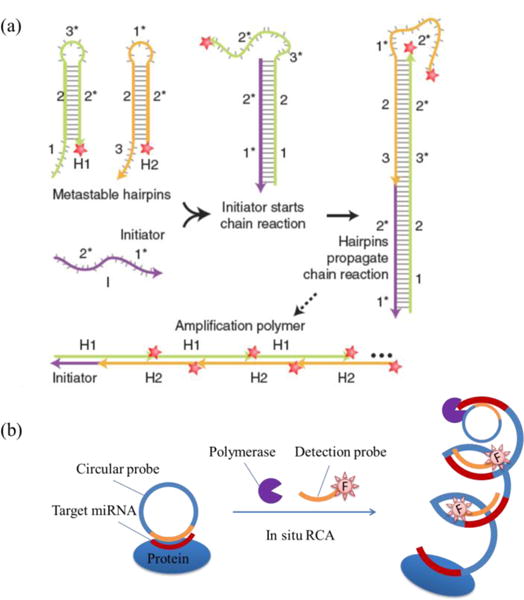
FISH based amplifications. (a) Hybridization chain reaction (HCR) amplification: (i) the initiator strand (containing the recognition strand and binding to target RNA before amplification begins) starts the chain reaction by forming a duplex with the H1 strand; (ii) initiator/H1 duplex propagates the reaction by forming a duplex with the H2 strand; (iii) the reaction is further continued by alternative binding of the H1 and H2 strand sequentially, and finally an amplification polymer with multiple fluorophores is formed. Adapted with permission from Macmillan Publishers Ltd., Nature Biotechnology85, copyright (2010). (b) RCA amplification:86 the circular probe first binds to target miRNA and then undergoes sequence elongation in the presence of polymerase and dNTP, followed by the binding of multiple detection probes, leading to signal amplification.
Enzyme-mediated signal amplification can also be employed in FISH probes to increase sensitivity. Tyramide signal amplification (TSA)10, 88 and enzyme-labelled fluorescence (ELF) signal amplification,11, 89 two outstanding and complementary amplification methods, are often combined with FISH probes. In TSA, target RNA is first hybridized by a primary-antibody conjugated nucleic acid probe, and then secondary-antibody-conjugated horseradish peroxidase (HRP) is further attached through antigen-antibody interaction. After that, fluorescent dye labelled tyramide is added, whose fluorescence will significantly increase in the presence of the catalyst HRP. In this way, TSA realizes signal amplification of target RNA utilizing the HRP enzyme. Using TSA, LNA FISH probes can image miR-124a in frozen brain tissues10 more rapidly and efficiently than the same probes without TSA. Similarly, LNA FISH probes with TSA are also shown to image miR-142 in neurons and other cell types with higher sensitivity than LNA FISH probes without TSA88. On the other hand, in ELF, target RNA is also first hybridized by primary-antibody-conjugated nucleic acid probe, and then secondary-antibody-conjugated phosphatase is further attached. After that, ELF-97 (enzyme labelled fluorescence) phosphatase substrate90 is added, which is converted to brightly and stably fluorescent ELF alcohol in the presence of phosphatase. Using ELF amplification, individual miR-15a and miR-155 were identified as bright and photostable fluorescent spots in single cells11.
In addition, RNA FISH probes can be easily modified with different fluorophores and combined with mathematical treatments (binary colour combinations and ratio identity codes)75. In this way, RNA FISH probes can be used to image thousands of RNA sequences simultaneously. Lubeck et al.91 applied the sequential hybridization of FISH probes and obtained robust and high signal RNA images. During each round of hybridization, FISH probes with single fluorophores are hybridized with target RNAs; then, the FISH probes are digested and in a new round of hybridization, new FISH probes with same sequences but a different single fluorophore are hybridized with the same target RNAs. With the sequential hybridization method, they successfully barcoded 12 genes in single yeast cells with four dyes and two rounds of hybridization. Furthermore, Chen et al.92 developed multiplexed error-robust FISH (MERFISH), a single-molecule imaging method that allows thousands of RNA species to be imaged in single cells using combinatorial FISH labelling with encoding schemes capable of detecting and/or correcting errors.
In summary, FISH probes for RNA imaging have very high sensitivity and can quantify the copy numbers of mRNAs and image low-content miRNAs with signal amplification methods. Multiplexed FISH probes combined with mathematical methods can be used to simultaneously image multiple RNAs. They have standard synthesis procedures and are versatile enough to image different target RNAs. The only limitation is that FISH probes cannot be used in live-cell imaging, and successful imaging of RNAs by FISH probes will need careful pre-treatment of cells.
3.2 Molecular beacons (MBs)
Molecular beacons are the most-studied probes for RNA imaging93–96. They have stem-loop DNA structures (or β-hairpin structures, Fig. 8a) with recognition sequences lying in the loop areas. In the stem area, the fluorophore and quencher are in close proximity, leading to non-fluorescent MBs at first. However, once the MBs are exposed to target RNAs, the recognition sequence will form a stable hybrid duplex with target RNAs, and the stem-loop structure will become linear, forcing the quencher to be away from the fluorophore, and therefore restoring the fluorescence of the fluorophore. A modification of MB is the dsDNA probe containing a recognition strand and a quencher strand (Fig. 8b)97. The recognition strand carries a FRET donor and its sequence is complementary to that of target RNA. The quencher strand carries a FRET acceptor, quenching the fluorescence of the recognition strand. In the presence of the target RNA, the recognition strand will form a hybrid duplex with the target RNA and release the quencher strand, imaging the target RNA.
Fig. 8.
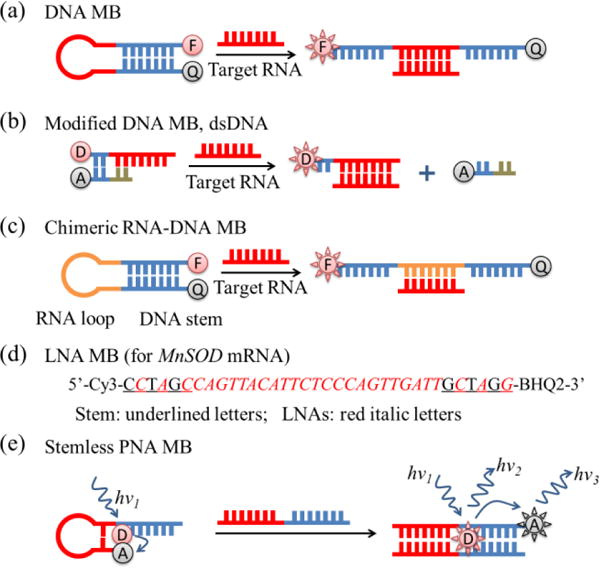
Different structures of MBs: (a) general DNA MBs with stem-loop structures; (b) modified MB: dsDNA with fluorophore donor and acceptor; (c) chimeric RNA-DNA molecular beacon with RNA loop and DNA stem98; (d) sequences of LNA MB with most LNAs remaining in the stem part and alternate LNAs in the loop part (red italic letters represent LNA bases, and underlined letters are bases for the MB stem)99; (e) stemless PNA MB100.
Backbone modification of MBs can increase the affinity and specificity, accelerate hybridization kinetics, and reduce fluorescence background. For instance, a chimeric RNA-DNA MB (chMB, Fig. 8c) with RNA loop and DNA stem was shown to have a higher fluorescence signal than typical DNA-MB hybrids and was applied to imaging nucleic acids98. LNA-MBs with a part of the nucleic acids substituted with LNAs (Fig. 8d) have better cellular stability and can track RNAs for a longer period of time99. Stemless PNA MBs (Fig. 8e) were shown to have lower background than common MBs100. The reason lies in their special fluorescent donors, which are non-fluorescent when bound to ssDNAs, but become fluorescent when embedded in dsDNAs. Since stemless PNA MBs do not contain FRET acceptors with background fluorescence, they have much lower background than common stem-loop MBs.
Employment of the nucleic acid amplification method can substantially increase the signal of MB probes. With HCR amplification (Fig. 9a), Cheglakov et al. constructed an amplifier composed of HP1 tagged with Cy3, and HP2 tagged with Cy5 was applied to successfully image miR21 in Hela cells101. To image the target miRNA, the miRNA will initiate the alternative assembly between HP1 and HP2, leading to the FRET effect and detection of miRNAs101. Using a modified Cascade Hybridization Reaction (CHR, Fig. 9b)102, Tan and his colleagues improved linear nucleic acid probes and enhanced the signal from MnSOD (manganese superoxide dismutase) mRNA by 3.1-fold103. As shown in Fig. 9b, the amplification system has three important components: the H1 strand, H2 strand, MB-like dsDNA strand containing a fluorophore and a quencher strand. In the presence of target mRNA, first, the mRNA will catalyse the formation of the H1-H2 hybrid duplex, and then the hybrid duplex will form a complex with the reporter strand and further release the quencher strand, illuminating the location of mRNAs.
Fig. 9.
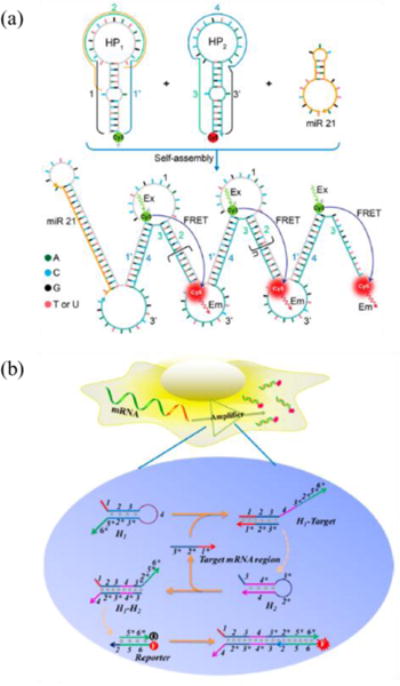
MBs with amplification methods: (a) HCR amplification, adapted with permission from (Journal of the American Chemical Society 2015, 137 (19), 6116–6119, DOI: 10.1021/jacs.5b01451)101. Copyright (2015) American Chemical Society; (b) CHR amplification, adapted from Wu et al.103 with permission.
Enzyme-mediated signal amplification can also be employed in MBs to increase sensitivity. Zhang et al. designed an amplifier (named catalyst-oligomer-mediated enzymatic amplification, CMEA), which contained DNA1, protector-oligomer duplex and catalyst-oligomer as well as NEase (Fig. 10)104. In the system, the target miRNA act as the catalyst and one miRNA can create thousands of fluorescent duplexes, allowing detection in the femtomolar range104. However, MBs cannot be used directly in live cell RNA imaging since MBs are coated with negatively charged DNA or RNA molecules and cannot automatically enter live cells. To enable live-cell imaging of RNAs by MBs, gene carriers are needed to deliver MBs into cells. The most common MB carriers are cationic liposomes and cationic polymers, e.g., the commercial transfecting agents, Lipofectamine and jetPEI. With transfecting agent, MBs105 and colour tunable MB-like dsDNAs106 successfully imaged miR-124a and miR-294 in P19 cells, respectively. Similarly, two types of MBs were simultaneously administered with transfecting agent, realizing simultaneous imaging of miR-26a and miR-206 in C2C12 cells, both in vitro and in vivo107. Kim et al. applied hyaluronic acid-targeting liposomes to deliver MB-like dsDNA probes and successfully imaged miR-34a in both primary and metastatic breast cancer cells97. Cationic NPs named cationic shell cross-linked knedel-like nanoparticles (cSCK) were also used to deliver PNA-DNA MBs, which successfully imaged iNOS mRNA expression in live mouse macrophage cells108.
Fig. 10.
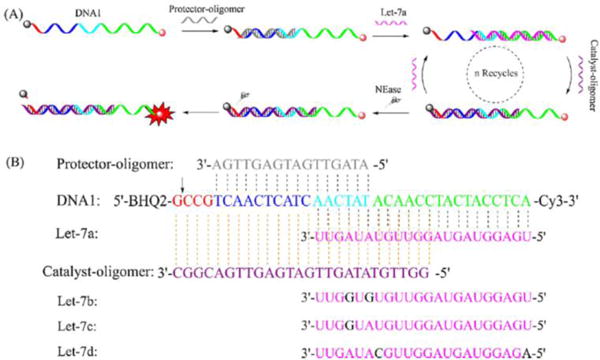
Enzyme enabled amplification104. Reprinted from Sensors and Actuators B: Chemical, 223, Zhang, K.; Wang, K.; Zhu, X.; Xie, M. A one-pot strategy for the sensitive detection of miRNA by catalyst–oligomer-mediated enzymatic amplification-based fluorescence biosensor, 586–590, Copyright (2016), with permission from Elsevier.
Other nanoparticles can also act as MB carriers. Organic PLGA (poly(D,L-lactide-co-glycolide)) nanoparticles can be applied to deliver MBs, which successfully monitor β-actin mRNA expression in mesenchymal stem cells cultured on a 3D matrix109. Mesoporous silica nanoparticles (MSNs) were used to load MB-like dsDNAs with CHR amplifiers and successfully imaged miR-21 in live cells110. Quantum dots (QDs) loaded R9 peptides and MBs111 imaged miR-124 in C6 cells and differentiated P19 cells. Furthermore, carbon nanodots (C-dots) loaded dsDNAs112 imaged miR-124 with high specificity in differentiated P19 cells. In addition, cationic GNPs loaded HCR components through electrostatic interaction had very high sensitivity due to HCR amplification and were used to track survivin mRNAs in Hela cells treated with varying concentrations of a survivin expression repressor, YM155113.
Cell penetrating peptides and special DNA structures can also act as MB carriers. For instance, TAT peptide conjugated MBs were shown to image survivin mRNA in MiaPaca-2 cells after only 60 min of transfection,114 much faster than conventional robust gene transfection agents (such as lipofectamine) which generally take 3–4 h. Photo-controlled DNA aptamer conjugated MB-like dsDNAs imaged MnSOD mRNA in MCF-7 cells with high spatial resolution, in which the aptamers were released from MBs in cells after light activation115. DNA aptamers conjugated with MB-like long dsDNAs with multiple fluorophores/quenchers successfully imaged miR-34a in MCF-7 cells, in which the aptamers were released from MBs in cells after target RNA binding116. DNA tetrahedron conjugated MBs were also shown to successfully image GAPDH mRNA in DLD-1 and SW480 cells117. Moreover, MBs modified with lipid chains can self-assemble into micelles (DNA micelle spherical nucleic acids) and facilitate cell entry. Compared to traditional MBs, DNA micelle SNAs have higher DNA density, stronger binding ability to target RNAs and higher cellular uptake in the absence of transfecting agents118. Chen et al.119 synthesized DNA micelle SNAs and used them to image tumour marker c-raf-1 mRNA with high signal to background ratio.
In all, MBs with stem-loop or dsDNA structures have wide applications in mRNA and miRNA imaging. Backbone modification such as PNA and LNA can greatly lower background signals and enhance MB stability. DNA amplification reactions such as HCR and CHR as well as enzyme-mediated amplification reactions can be used to further enhance MB signals. However, MBs cannot enter cells themselves. For in vitro and in vivo RNA imaging, gene carriers, such as cationic liposomes, cationic polymers and inorganic NPs, are needed to deliver MBs into cells. In addition, MBs with cell penetrating peptide and DNA aptamer conjugation as well as MB micelles also enable RNA imaging in vitro and in vivo.
3.3 Nano-MBs
Nano-MBs refer to those NP-loaded MBs in which NPs are incorporated to act as both the quencher and the carrier, and no additional gene carriers are needed to deliver the probes. The NPs here are not just carriers of MBs, but also act as the quenchers of adjacent fluorophores on MBs.
The most typical Nano-MBs are GNP-Nano-MBs (Fig. 11a)120, which consist of gold nanoparticles (GNPs) functionalized with a shell of molecular beacons or dsDNAs terminated with a fluorophore. When no target RNAs are present, the fluorophores are quenched by GNPs and the whole probes are non-fluorescent; when target mRNAs are present, the sequence in the loop area form a hybrid duplex with target RNA, and the MBs become straight, pushing the fluorophore to be away from GNPs and be dequenched, illuminating target RNAs. Similarly, for dsDNA loaded GNP-Nano-MBs, probes are non-fluorescent due to the quenching ability of gold nanoparticles in the absence of target RNAs; while in the presence of target RNAs, the single recognition strand will form a hybrid duplex with target RNAs and release the reporter strand and thus illuminate the location of RNAs. In some cases, to better track RNAs in real-time, the reporter strand is designed to be complementary to target RNAs103, 121–123, such that the fluorophores will be conjugated to target RNAs and able to track target RNAs more accurately. With the reporter strand designed to be complementary to target RNAs, GNP-Nano-MBs (named sticky flares) can quantify the expression of target RNAs and track the spatial distribution of target RNAs123. In addition, with FRET probes instead of single fluorophores conjugated on GNPs, the GNP-Nano-MBs would have less false-positive signals124.
Fig. 11.
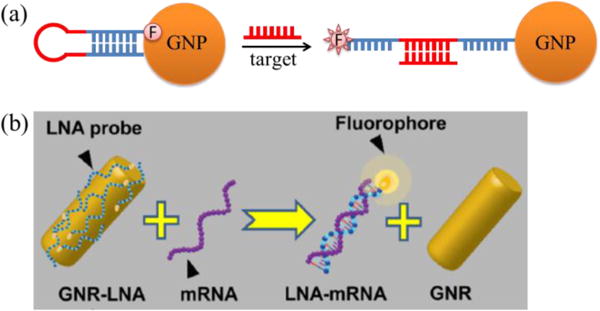
Structures of different Nano-MBs: (a) gold nanosphere based Nano-MB120; (b) gold nanorod based Nano-MB, adapted from Riahi et al. with permission129.
GNP-Nano-MBs were initially applied to image single types of RNAs. For instance, GNP-Nano-MBs were applied to image survivin mRNA in SKOV3 cells125 and TAT5B mRNA in MCF-7 cells126. Since GNP-Nano-MBs have low background and high sensitivity, they can also image miRNAs with weak binding and low copy numbers. Tu et al.127 applied GNP-Nano-MBs tagged with FITC to detect miR-122 with detection limits as low as 0.01 pM in cell extracts. Since gold nanorods (GNRs) based nano-MBs have almost double signal-to-background ratio of spherical GNP-Nano-MBs,128 they can be used to track Dll4 mRNA in HUVEC cells as well as different tissues128 and the location and expression of heat shock mRNAs (HSP70 mRNA, Fig. 10b)129.
GNP-Nano-MBs were also capable of simultaneous multiple-RNA imaging since multiple types of MBs tagged with different fluorophores can be easily modified on GNPs. For instance, GNP Nano-MBs loading Cy3-labelled dsDNAs and Cy5-labelled dsDNAs were applied to image survivin mRNA and β-actin mRNA simultaneously in MCF-7 cells130. Using β-actin as the internal control, down-regulation of survivin mRNA was accurately quantified130. Similarly, GNP-Nano-MBs loading three types of dsDNAs tagged with Rh110, Cy3 and Cy5 were applied to image c-myc mRNA, TK1 mRNA and GalNAc-T mRNA131. In this way, cancer cells MCF-7 and HepG2 can be distinguished from the normal cells, MCF-10A and HL-7702. Furthermore, GNP-Nano-MBs containing four types of MBs labelled with Alexa Fluor 405, Alexa Fluor 488, Cy3 and Cy5 were applied to image four tumour marker mRNAs (TK1 mRNA, survivin mRNA, c-myc mRNA and GalNAc mRNA) at the same time132. However, simultaneous imaging of four markers needs four couples of excitation/emission, which requires multiple lasers or tuneable laser and multiple detectors. To reduce the requirements in fluorescence microscopy for multiple mRNA imaging, a smart GNP-Nano-MB that only needs single excitation/emission to detect two mRNAs at the same time was developed133. In their study, GNPs were conjugated with two types of MBs labelled with Alexa-Fluo 488 and Cy3, which have FRET effects. Efficient FRET only occurs in the presence of both target mRNAs, and the effect can be easily detected by single excitation/emission, i.e., illuminating at the excitation wavelength of the donor and detecting at the emission of the acceptor.
With proper modification, GNP-Nano-MBs can be used for long-time tracking. Choi et al. showed that polydopamine (PDA) coated GNPs have much better stability in cells and can track miR-29b and miR-31 (involved in differentiation progress of human mesenchymal stem cells) simultaneously for five days122. In detail, they coated polydopamine (PDA) on GNPs and further adsorbed β-hairpin DNA through π-π interactions. In the absence of target miRNAs, the fluorescence of β-hairpin DNA was totally quenched by both GNPs and PDA, but in the presence of target miRNAs, the β-hairpin DNA detached from the PDA surface and bound with target miRNAs, restoring fluorescence122.
GNP-Nano-MBs have four advantages: (1) low background signals due to great quenching efficiency to the attached adjacent fluorophores as high as 98% or more120, which is further due to phase induced radiative energy suppression134; (2) excellent resistance to enzyme degradation due to high surface negative charge and high surface salt concentration135; (3) high cellular uptake without additional transfecting agents due to special receptor-mediated endocytosis136. The probable cellular uptake mechanism is that they target class A scavenger receptors and then enter cells through endocytosis via a lipid-raft-dependent, caveolae-mediated pathway.136 (4) Enabling additional imaging modality (fluorescence lifetime imaging) due to lengthening of the fluorescence lifetime of Nano-MBs upon binding of target RNAs137. On the other hand, it is worth mentioning that in some cases, GNP-Nano-MBs also lead to mRNA downregulation. Since the probes bind to target mRNAs stably through complementary interaction, higher doses of probes (5 nM and 50 nM) and longer incubation time (4 days) leads to RNA downregulation.125, 138, 139 Therefore, to avoid mRNA deregulation, probes generally have low doses (1 nM) and are incubated with cells for a relatively short time (4 h) in most RNA imaging studies.
In addition to GNPs, other NPs that can quench fluorescence of organic dyes can also be similarly applied to construct nano-MBs. For example, metal-organic framework (MOF) based nano-MBs were applied to detect Ebola mRNA on a chip140. Polypyrrole nanosphere based nano-MBs were applied to image TK1 and c-myc mRNA in cells141. Polydopamine-coated Fe3O4 NPs were also applied to image TK1 and c-myc mRNA in cells142. However, these newly developed nano-MBs are less sensitive than GNP-Nano-MBs and require optimization for effective RNA imaging.
3.4 Quencher-free probes
Unlike MBs and Nano-MBs, quencher-free probes do not need quenchers to reduce the initial background fluorescence of probes. Instead, the fluorophores in these quencher-free probes are quenched by themselves. FIT probes and ECHO probes are typical quencher-free probes.
An FIT (single dye forced intercalation) probe is generally a ssDNA that contains a single thiazole orange (TO) intercalator serving as an artificial fluorescent nucleobase, which is non-fluorescent at the ssDNA state and becomes fluorescent after forming a duplex with a target RNA (Fig. 11a). Kummer et al.143 used a PNA-FIT probe to image Influenza H1N1 mRNA, and the fluorescence of the probe increased 11-fold in the absence of the target RNAs, while that of the control MB probe targeting the same RNA only increased 6-fold. The high fluorescence increase is attributed to the properties of TO in the probe as well as the PNA structures, which have higher affinity and better biostability than common DNA structures. LNA-FIT probes also have high fluorescence increase, in which an adjacent locked nucleic acid (LNA) unit serves to introduce a local constraint to TO144.
Even brighter probes can be developed by incorporating fluorophore intercalators with higher fluorescence emission. For instance, TO/JO-FIT probes, which had a 23-fold fluorescence increase, were developed by conjugating both a TO and more highly emissive fluorophore JO (oxazolopyridine analogue) in a single ssDNA145. In the TO/JO-FIT probes, the TO serves as a light collector and transfers the energy to the JO emitter, leading to the successful imaging of oskar mRNA within a complex tissue. Similarly, even brighter LNA-QB probes containing QB (quinoline blue) as the intercalator have a 152-fold fluorescence increase146. Further combination with LNA-TO probes allows the detection of oskar mRNA and total mRNA in oocytes of Drosophila melanogaster by means of the wash-free FISH procedure146.
Unlike fluorophores (TO/JO/QB) applied in FIT probes, there are some fluorophores that are non-fluorescent in duplexes and fluorescent in ssDNA structures. These fluorophores can also be applied to construct quencher-free probes. Recently, Liao et al. developed a quencher-free dsDNA-structured probe containing the 2-aminopurine (2-AP) fluorophore, which can release fluorescent 2-AP-conjugated ssDNA upon binding to target miRNA, leading to the detection limit of target miRNA as low as 5 nM147.
Further improvement of FIT probes leads to the development of ECHO probes. An ECHO (exciton-controlled hybridization-sensitive fluorescent oligonucleotide) probe is a ssDNA containing two same fluorophores serving as artificial fluorescent nucleobases (Fig. 11b)148. In a typical ECHO probe named D514149 (with maximum absorption at about 514 nm), two TOs are positioned to be parallel (forming H-aggregate) so that the low fluorescence of TOs is quenched (exciton coupling effect) and therefore the background is even lower than that of FIT probes. Then, in the presence of target RNAs, after hybridization of a D514 probe with a target RNA, the parallel state of two TOs is broken and each TO acts independently as an intercalator into a duplex, leading to a 160-fold increase when the target RNA is oligo(A). Later, D514 was successfully applied to image 28S rRNA and U3 snoRNA at nucleoli and poly(A) RNA in vivo150.
However, the ECHO probes are not as robust and widely used as FIT probes since the fluorescence increase strongly depends on the sequence of target RNAs. On one hand, ECHO probes are easily subject to self-dimerization; on the other hand, incorporation of LNAs into sites close to dyes even breaks the exciton effect148.
To this point, we have discussed the structures and principles of four types of endogenous RNA imaging probes: FISH probes, MBs, Nano-MBs and quencher-free probes. FISH probes have the simplest structures and can image thousands of RNAs simultaneously with high sensitivity, but they can only be used to image fixed cells, not live cells. To image RNAs in live cells, the other three types of probes have their distinct advantages. MBs have low background and can image target RNAs with high sensitivity in live cells after signal amplification through DNA amplification or enzyme-mediated amplification methods with the help of different gene carriers. Nano-MBs have even better performance than MBs since the NPs are not only excellent gene carriers, but also great quenchers, and the most typical Nano-MBs are GNP-Nano-MBs, which have been well-studied to image RNAs in vitro and in vivo. Quencher-free probes utilize special fluorophores that show great fluorescence enhancement in the presence of target RNAs. They have simple structures but high sensitivity and specificity. Typical quencher-free probes include FIT probes and ECHO probes, with the former type being more versatile and promising for future RNA imaging applications.
There are some other high-performance endogenous RNA imaging probes with more complicated designs. Pumilio homology domain (PUMHD) based BiFC systems can directly image endogenous RNAs since the PUMHD with different structures151 can be designed according to the target sequences. Tilsner et al.152 fused PUMHD3794 and PUMHD3809 to N- or C-terminal halves of split mCitrine and successfully imaged the genomic RNA of the tobacco mosaic virus (TMV). Yamada et al. fused PUM3 and PUM4 to N- and C-eGFP and imaged β-actin mRNA1. Yoshimura et al.43 fused PUM1 and PUM2 to N- and C-eGFP and also successfully imaged β-actin mRNA. Yamada et al.153 developed a PUMHD-based BiFC probe to image telomeric repeat-containing RNA by sandwiching PUMHD between the N-eGFP and C-eGFP gene coding sequence. Furthermore, Adamala et al.154 developed a series of programmable RNA-binding protein PumHD, allowing convenient application of the PUMHD-based BiFC system. Similarly, the split RNA aptamer/fluorophore system can also directly image endogenous RNAs155. By splitting the Spinach aptamer into two parts (SSA_m and SSA_f) and tagging them with sequences complementary to target RNA sequences, the split Spinach-DFHBI not only has lower background fluorescence, but can also directly image endogenous RNAs through base-pairing155. By splitting the Spinach aptamer into two parts and conjugating them to different parts of the RNA, the kinetics of the RNA assembly can be successfully tracked156. With the small molecule probe, they successfully imaged β-actin mRNA and visualized the cellular dynamics of several endogenous mRNAs including arfaptin-2, cortactin and cytoplasmic FMR1-interacting protein 2. Sato et al.157 utilized a modified RNA aptamer/fluorophore system, by combining a β-actin gene-specific RNA aptamer with a cell-permeable synthetic small molecule (BHQ-fluorophore), to image β-actin mRNA. The fluorescence of the fluorophore is restored only when the RNA aptamer hybridizes with its cognitive mRNA.
In addition, there are high-performance RNA imaging probe images of miRNA based on its cleaving function158. As shown in Fig. 13b, the ssRNA probe has a rather simple structure and its sequence is complementary to that of target miRNA, with two terminals conjugated with fluorophore and quencher, respectively. In the presence of target miRNAs, the ssRNA probes will be cut and the fluorescence of the tagged fluorophore will be restored, revealing the existence of target miRNAs.
Fig. 13.
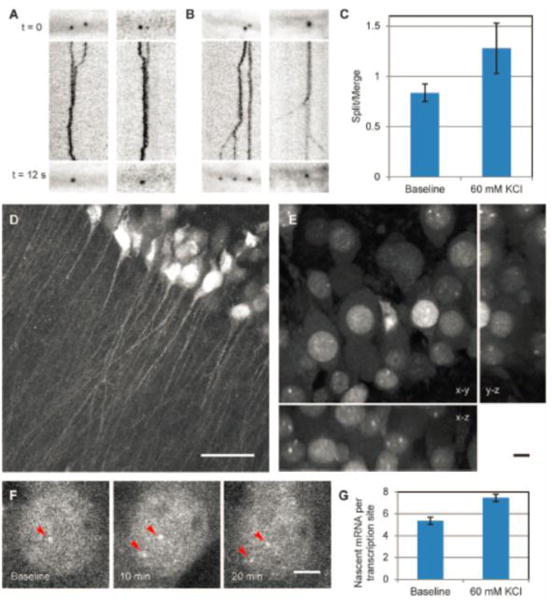
(A-B) The assembly (A) and disassembly (B) dynamics of the RBP-FP system labelled β-actin mRNP (RNA-protein complex) in neurons in 12 s with the lines showing the merging and splitting trajectories. (C) The ratio of split to merged events increased after KCl depolarization. (D) The CA1 region in the acute hippocampal slice. Scale bar, 50 μm. (E) The soma layer of CA1 neurons. Panels show maximum projections of x-y, y-z, and x-z planes. Scale bar, 10 μm. (F) Transcription of β-actin gene with KCl depolarization. Arrowheads denote β-actin transcription sites. Scale bar, 5 μm. (G) Nascent mRNA per transcription site increased after depolarization; [Science 2014, 343 (6169), 422–424, DOI: 10.1126/science.1239200]36. Reprinted with permission from AAAS.
Furthermore, endogenous probe/exogenous probe combination can complement each other and offer more imaging information. For instance, Kang et al.159 applied a reporter gene system (CMV/Gluc/3×PT_miR-1) and a miR-1 MB to image miR-1 during myogenesis. The reporter gene system and the miR-1 MB imaged miR-1 indirectly and directly, respectively.
4. RNA imaging applications
4.1 Applications in tracking RNA processes
Table 1 shows the application in tracking RNA processes by RNA imaging probes. Generally, two important processes are tracked: (1) processes during formation and translation of mRNAs; (2) biogenesis of miRNAs.
Table 1.
Applications of RNA imaging probes in RNA process tracking
| Target RNAs | Processes | Probe types |
|---|---|---|
| nascent mRNA | transcription | RBP-FP systems (MS2-GFP160) |
| pre mRNA | splicesome assembly | RBP-FP system (MS2-mCherry161) |
| β-actin mRNA | transcription | FISH probe77 |
| β-actin mRNA | transcription, transport | RBP-FP system (Actb-MS2)35, 36 |
| β-actin mRNA | localization, transport | BiFC system (PUM-HD1, PUM-HD mutants43) |
| β-actin mRNA | transport | Nano-MB (Sticky-Flare123) |
| β-actin mRNA | translation | FISH probe163 |
| gurken mRNA | localization, transport | RBP-FP system (MS2-mCherry165) |
| c-myc mRNA | transport | FISH probe166 |
| oskar mRNA | transport | RBP-FP system (MS2-GFP167) |
| model mRNA | transport | RBP-FP system (MS2-GFP168) |
| miR-124a | detection during neuronal differentiation | reporter gene system (CMV/Gluc/3×TS_miR124a70) |
| miR-124a | detection during neuronal differentiation | MB(R9-QD-miR-124a beacon111, miR-124a beacon105) |
| miR-124a | detection during neurogenesis | MB (miR124a CMB112) |
| miR-9 | detection during neuronal differentiation | MB (Colour MB106) |
| miR-23a | detection during neuronal differentiation | reporter gene system (CMV/Gluc/3×PT_miR23a73) |
| miR-1 | detection during myogenesis | reporter gene system (CMV/Gluc/3×PT_miR-1159) |
| miR-1 | detection during myogenic differentiation | Nano-MB (miR MRB169) |
| miR-26a, miR-206 | detection during myogenic differentiation | MB (miRNA-26a MB107, miRNA-206 MB107) |
| miR221 | biogenesis in Papillary Thyroid Carcinoma | reporter gene system (CMV/Gluc/3×PT_miR22168) |
The mRNA processes generally include transcription, localization, transport, and translation4, 21. By tracking nascent RNAs, it was revealed that strongly expressed housekeeping genes alter the magnitude of their transcriptional pulses during development by the RBP-FP system160. By tracking pre-mRNA with a RBP-FP system, a kinetic description for spliceosome assembly was monitored in live cells161. By labelling exons and introns of GFP pre-mRNA with two distinct sets of FISH probes162, splicing events were visualized with single molecule sensitivity. It was revealed that tight coupling between transcription and splicing can be broken when the intron’s polypyrimidine tract is sequestered within strong secondary structures. Among all mRNAs, β-actin mRNA is one of the most studied mRNAs for RNA processes. For transcription, the rates of transcription initiation and termination of FISH probe labelled β-actin mRNA were determined by positioning probes along the transcription unit77; the transcriptional bursting of β-actin mRNAs in response to serum stimulation and their transport in primary live cells were visualized by the BiFC system43; the transportation dynamics of single β-actin mRNA particles in primary hippocampal neurons was clearly tracked by the RBP-FP system35. For localization and transport, co-localization of β-actin mRNA with microtubules were localized predominantly by diffusion in primary fibroblasts; however, multiple β-actin mRNAs can assemble together (Fig. 13A) and travel by active transport and disassemble upon depolarization by potassium chloride by the RBP-FP system (Fig. 13B–G)36. Real-time transport of β-actin mRNA in mouse embryonic fibroblasts was monitored by GNP-Nano-MB123. For translation, the unmasking of the FISH probe labelled β-actin mRNA during translation was found to be prompted by chemically induced long-term potentiation, which was further controlled by synaptic activity (Fig. 13)163.
In addition to β-actin mRNAs, the processes of some other mRNAs were also studied using RNA imaging probes. The localization of gurken mRNA in developing Drosophila oocytes was found to be affected by nine complementation groups of gene sequences and the localization occurred before centrosome localization165. For transport, the feasibility of tracking the transport of c-myc mRNA was demonstrated in heated cells166; oskar mRNA particles in living oocytes were found to be actively transported along microtubules in all directions with a slight bias toward the posterior167; the transport of a model mRNA transcript in body wall muscle cells was tracked in transgenic Drosophila, revealing that myofibers are compartmentalized and consist of domains168.
Choosing proper imaging probes for tracking mRNA processes is important for successful dynamic mRNA imaging. From Table 1, it can be seen that the RBP-FP system is the most widely used probe for tracking mRNA processes, while the BiFC system and FISH probe are also candidates for tracking mRNA processes. However, fast transcription kinetics can only be monitored by the RBP-FP system. The RBP-FP system is simple and particularly convenient for labelling a common mRNA in the 3′-UTR. Moreover, the RBP-FP system is very stable due to the fact that the FP is stably bound to the target mRNA. Therefore, RBP-FP is one of the most suitable probes for the real-time tracking of model mRNA processes. However, for the BiFC system, it takes time to image target RNAs and it is not suitable for real-time imaging of fast processes. For the FISH probe, the sample preparation takes time, and therefore it is not suitable for tracking fast processes either. Specifically, Wang et al. synthesized an activatable GNP-MB (fNC) that can activate the transcription of Tubb3 mRNA and Fox3 mRNA and image the process (Fig. 15)164. Since the process is not so fast, the dynamics can be tracked by Nano-MBs. On the other hand, RNA imaging probes can also be applied to track miRNA biogenesis during different physiological processes. The most studied processes are neurogenesis and myogenesis. Neurogenesis includes neuronal proliferation and differentiation. The miR-124a was found to have higher expression during neurogenesis by MB112. Furthermore, the biogenesis of the same miRNA during neuronal differentiation was successfully detected by the reporter gene system70 or MB105, 111. In addition to miR-124a, the miR-1a106 and miR-23a73 were also found to increase expression during neuronal differentiation by MB106 and the reporter gene system73, respectively. Similarly, miR-1, miR-26a and miR206 were found to increase expression during myogenesis by applying RNA imaging probes. Furthermore, miR221 was found to increase expression in papillary thyroid carcinoma by the reporter gene system68.
Fig. 15.
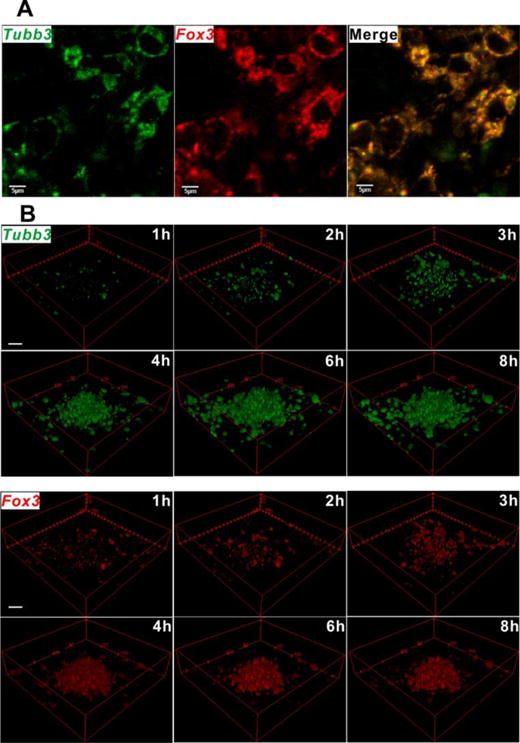
(A) Fluorescence imaging of Tubb3 (green colour) and Fox3 (red colour) mRNAs by fNCs (multifunctional nanocomplex, a GNP-Nano-MB) at day 8 in differentiated neural stem cells (NSCs) stimulated in advance by free retinoic acid. Scale = 5 μm. (B) Fluorescence recovery kinetics of fNCs in detecting Tubb3 (green colour) and Fox3 (red colour) mRNAs at day 8 in differentiated NSCs stimulated in advance by free RA. The images were reconstructed into 3D format for better illustration, without compromising the original. Scale = 20 μm. Adapted with permission from Wang et al.164
Strategies for successful dynamic miRNA imaging are different from those of mRNA since the structure and function of miRNA is quite different from that of mRNA. As for the structure of miRNA, it is very short, only 21–25 nt and therefore has much weaker binding to probes than mRNAs. Moreover, the expression of miRNAs is much lower than that of mRNAs. The short length and low copy number of miRNAs require that the imaging probes have high binding affinity and high sensitivity. MB is quite suitable for imaging miRNA, since it has low background and high binding affinity to miRNAs. With proper amplification methods, MB has even higher sensitivity. FISH probes also have very high binding affinity and high sensitivity, but they are not suitable for imaging miRNA biogenesis. The reason could be that they cannot be used in live cell imaging and cannot track fast biogenesis. Furthermore, miRNA can regulate related genes by binding to the gene control region. The reporter gene system specifically utilizes this principle and substantially increases the detection sensitivity. Therefore, the most suitable miRNA probes are MB and the reporter gene system.
In summary, the requirements for dynamic mRNA imaging and miRNA imaging are quite different. For dynamic mRNA imaging, the probes should be able to track the fast mRNA processes, and the requirements include the following: (1) the probes should have high resolution; (2) the probes can track mRNA in real-time; (3) the probes should be stably bound to target mRNA. For dynamic miRNA imaging, due to its regulatory function, the reporter gene system is a good choice for its indirect detection. For direct dynamic miRNA imaging, the probes should be able to bind to low-copy-number and low-expression miRNA with high efficiency, and the most important requirement is that the probe should have very high resolution.
4.2 Applications in cancer diagnosis
Table 2 summarizes mRNA and miRNA tumour markers detected by RNA imaging probes. The mRNA and miRNA tumour markers have high expression in certain tumour cells, but have low expression in normal cells; therefore, detection and quantification of the mRNA or miRNA tumour markers can help in cancer diagnosis.
Table 2.
Applications of RNA imaging probes in cancer diagnosis
| Target RNAs | Cancer cell or tissue types | Probe types |
|---|---|---|
| survivin mRNA | Hela, MCF-7 and SKBR-3 | MB (HCR113) |
| survivin mRNA | HDF and MiaPaca-2 | MB (peptide-MB114) |
| survivin mRNA | SKOV3125, Hela130 | Nano-MB (Nano-flare125, Multiplexed Nanoflare130) |
| MnSOD mRNA | MDA-MB-231103, MCF-7115 | MB(HDCA103, CP/MB probe115) |
| c-raf-1 mRNA | A549 | Nano-MB (DNA Micelle Flare119) |
| TK1 mRNA | HepG2, MCF-7 | Nano-MB (FRET nanoflare124) |
| STAT5B mRNA | MCF-7 | Nano-MB (GNP beacon126) |
| K-ras mRNA | Panc-1, sw-480 | MB (PNA-MB170) |
| TK1/GalNac mRNA | HepG2, MCF-7 | Nano-MB (fluorescence Nanoprobe121) |
| TK1/survivin mRNA | HepG2, MCF-7 | Nano-MB (FRET Nanoprobe133) |
| c-myc/TK1/GalNac-T mRNA | HepG2, MCF-7 | Nano-MB (Multicolour Nanoprobe131) |
| c-myc/TK1/GalNac-T/survivin mRNA | HepG2, MCF-7 | Nano-MB (Four-colour Nanoprobe132) |
| miR21 | A549 | reporter gene system (CMV/Fluc/3×TS_miR2167) |
| miR16 | SGC7901, SGC7901/VCR | reporter gene system (CMV/hNIS/Fluc/3×TS_miR1674) |
| miR21 | Hela | MB (HCR101) |
| miR21 | MCF-7, HepG2 | MB (ONAA-PCMSN110) |
| miR21 | pancreatic ductal adenocarcinoma | FISH probe (LNA-FISH5) |
| miR15a | MDA-MB-231, Hela | FISH probe (LNA-ELF-FISH11) |
| miR155 | MCF-7 | FISH probe (LNA-ELF-FISH11) |
| let-7a miRNA | A549 | MB (TIRCA87, CEMA104) |
| miR-34a | MCF-7 | MB (CF probe116) |
| miR-122 | Huh-7, HepG2, Hela, MDA-MB-231 | Nano-MB (AuNP hairpin127) |
| miR-10b | MDA-MB-231-luc-D3H2LN | ssRNA158 |
For the detection of single mRNA tumour markers, both MB and Nano-MBs have been successfully applied in detecting survivin mRNA113, 114, 125, 130, MnSOD mRNA103, 115, c-raf-1 mRNA119, TK1 mRNA124, STAT5B mRNA126 and K-ras mRNA170 in different tumour cells.
Multiple mRNA tumour marker detection can improve the accuracy of cancer detection, which can be easily accomplished by Nano-MBs. The TK1 mRNA and GalNAc mRNA were imaged at the same time, distinguishing cancer cells (MCF-7 and HepG2 cells) from normal cells by GNP-Nano-MB121. Similarly, simultaneous imaging of another two mRNAs (c-myc/TK1 mRNA141, 142, TK1/survivin mRNA133), three mRNAs (c-myc/TK1/GalNac-T mRNA131) and even four mRNAs (Fig. 16, c-myc/TK1/GalNac-T/survivin mRNA132), which increase the accuracy of cancer diagnosis, can also be accomplished by Nano-MB.
Fig. 16.
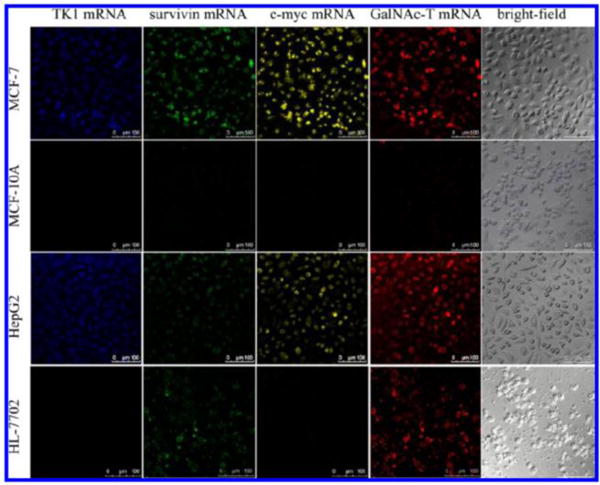
Intracellular imaging of TK1 mRNA, survivin mRNA, c-myc mRNA, and GalNAc-T mRNA under CLSM. MCF-7, MCF-10A, HepG2, and HL-7702 cells were incubated with the GNP-Nano-MB (1 nM) for 3 h at 37 °C. The four mRNAs were recorded by Alexa Fluor 405 with 405-nm excitation, Alexa Fluor 488 with 488-nm excitation, Cy3 with 543-nm excitation, and Cy5 with 633-nm excitation. Scale bars = 100 μm. Reprinted with permission from Analytical chemistry 2013, 85 (21), 10581–10588, DOI: 10.1021/ac402700s)132. Copyright (2013) American Chemical Society.
Looking into the probes for detection of mRNA tumour markers, almost all the probes are MB based: MB or Nano-MB. The reason could be that the mRNA tumour markers have many types and the sequences of tumour markers are quite different for each. MB has a simple structure and can be easily designed to bind to different tumour markers with high binding affinity. Nano-MB further increases its cellular delivery efficiency and imaging sensitivity and is therefore suitable for mRNA tumour marker detection.
In addition to mRNA tumour markers, miRNA tumour markers can also be used in cancer diagnosis. However, the short length and low copy number of miRNAs make them even harder to detect than mRNA tumour markers, and therefore, miRNA imaging probes have higher sensitivity than that of mRNA imaging probes. Generally, there are four types of highly-sensitive miRNA imaging probes: MBs with signal amplification, nano-MBs, FISH probes and reporter gene systems. For instance, miR-21101, 110, let-7a miRNA87, 104 and miR-34a116 can all be detected by MBs with amplification methods. miR-122 from human Huh7 cells can be accurately detected by GNP-Nano-MB127. The miRNAs (miR15a11, miR15511 and miR-215) in different tumour environments can be detected by enhanced LNA FISH probes with11 or without5 amplification methods. The miR2267 from A549 cells and miR1674 from chemoresistant SGC7901/VCR cells as well as miR1674 from xenografts were detected by reporter gene systems (Fig. 17). In addition, miRNA itself has the special property that it can cut its bound RNA sequences. Based on this property, miR-10 from MDA-MB-231 cells can be detected by the designed ssRNA probe158.
Fig. 17.
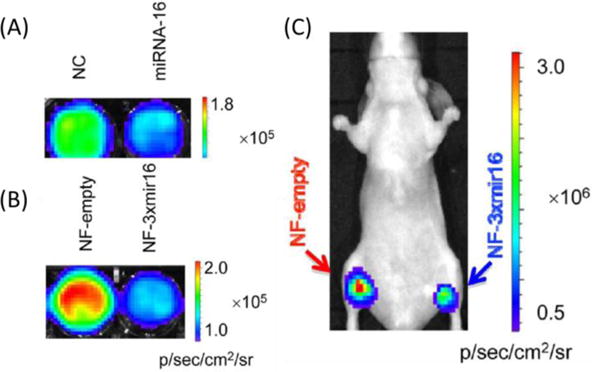
(A) In vitro bioluminescence imaging after transfecting miR16 or negative control (NC) RNA oligos (50 nM) into NF-3×mir16 cells. (B) In vitro bioluminescence imaging of NF(hNIS/Fluc fusion gene)-empty and NF-3×mir16 cells with equal numbers (1×10⁶). (C) In vivo bioluminescence imaging of NF-empty and NF-3xmir xenografts with the same cell seeding density (1×10⁷). Adapted from Wang et al.74 with permission.
To realize early and accurate cancer diagnosis through the detection of mRNA or miRNA tumour markers, the RNA imaging probes should at least meet the following three requirements: (1) the probes should have high specificity in distinguishing tumour markers from RNAs with similar sequences; (2) the probes should have high resolution or sensitivity in detecting low expression of mRNA or miRNA tumour markers; (3) the probes should have high versatility to be applicable to a wide range of tumour markers.
Conclusions and Outlook
RNA imaging is very important in two aspects. Firstly, RNA imaging can track RNA processes such as transcription, localization, transport and translation, and can also track the biogenesis of miRNAs. Secondly, RNA imaging can be used in cancer diagnosis, since certain mRNAs or miRNAs can act as tumour markers. However, RNA imaging is at present mostly at the cellular level; in vivo imaging is very rare.
In this review, we summarized current high-performance RNA imaging probes, analysed their structures and imaging principles, and correlated the designs with their applications, which may offer guidance for future optimization of current probes. Generally, we reached the following conclusions:
All RNAs can be imaged using RNA probes designed based on base-pairing principles since all RNAs share similar chemical structures.
The mRNAs can accommodate RNA aptamers or special protein-binding RNAs in their non-coding 3′-UTRs, which can further bind to fluorescent proteins or small molecular dyes. Based on these principles, single-molecule mRNA can be imaged using RBP-FP, BiFC and RNA aptamer/fluorophore systems.
The microRNAs have special properties that regulate corresponding mRNAs; therefore, the reporter-gene system is applicable for miRNA imaging. Also, miRNAs can cut their binding RNAs, leading to the more simple design of ssRNA probes.
MBs have simple structures and high specificity and are suitable for the detection of a wide range of mRNA and miRNA. Nano-MBs are more advantageous than MBs. Among them, GNP based Nano-MBs are the most robust and versatile RNA imaging probes for live-cell RNA imaging.
FISH probes have high sensitivity, but can only image RNAs in fixed cells, and are therefore often used to image relatively slow RNA processes or detect low-content tumour miRNAs.
Quencher-free probes have very simple structures, but they are not as versatile as MBs and are therefore less applied in live-cell RNA imaging. Further improvement in specificity can push quencher-free probes into RNA imaging in vitro and in vivo.
To optimize the efficacy of current RNA imaging probes, there are three possible solutions. First, we can use nucleic acid probes with chemical modifications, such as LNA. Second, we can develop more excellent gene carriers, which not only deliver probes with high efficiency, but also act as high-performance fluorescence quenchers, such as GNP with porous structures. Third, we can chemically modify current fluorophores171 so that they have higher OFF/ON signal enhancement upon binding of target RNAs. In addition, optimization of imaging equipment172 and mathematical methods173, 174 can further improve RNA imaging resolution.
Fig. 12.
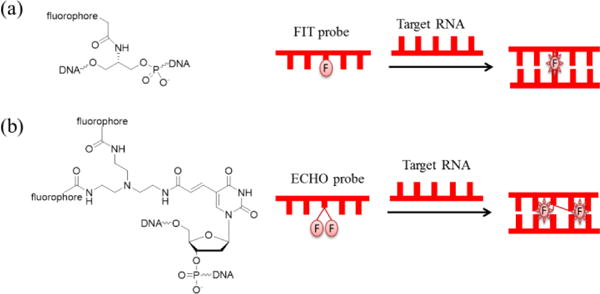
(a) Chemical structure of a typical FIT probe146 and its imaging principle; (b) chemical structure of a typical ECHO probe150 and its imaging principle.
Fig. 14.
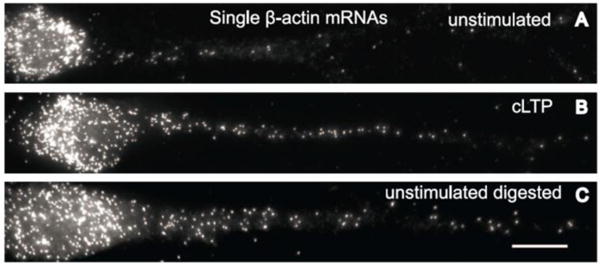
The distribution of single β-actin mRNA in dendrities without stimulation (A), with chemical long-term potentiation stimulation (B) and protease-digestion (C) detected by single-molecule FISH probes. Scale bar, 10 μm; [Science 2014, 343 (6169), 419–422, DOI: 10.1126/science.1242939]163. Reprinted with permission from AAAS.
Acknowledgments
This study was supported in part by the National Natural Science Foundation of China (Nos. 81671753 and 81501524), the national 1000 Young Talents Program of China, the Fundamental Research Funds for the Central universities under No. JB161202, and the Intramural Research Program, National Institute of Biomedical Imaging and Bioengineering (NIBIB), National Institutes of Health (NIH).
References
- 1.Yamada T, Yoshimura H, Inaguma A, Ozawa T. Analytical Chemistry. 2011;83:5708–5714. doi: 10.1021/ac2009405. [DOI] [PubMed] [Google Scholar]
- 2.Ke R, Mignardi M, Pacureanu A, Svedlund J, Botling J, Wahlby C, Nilsson M. Nature Methods. 2013;10:857–862. doi: 10.1038/nmeth.2563. [DOI] [PubMed] [Google Scholar]
- 3.Darnell DK, Stanislaw S, Kaur S, Antin PB. RNA. 2010;16:632–637. doi: 10.1261/rna.1775610. [DOI] [PMC free article] [PubMed] [Google Scholar]
- 4.Buxbaum AR, Yoon YJ, Singer RH, Park HY. Trends in cell biology. 2015;25:468–475. doi: 10.1016/j.tcb.2015.05.005. [DOI] [PMC free article] [PubMed] [Google Scholar]
- 5.Sempere LF, Korc M. Pancreatic Cancer: Methods and Protocols. 2013:43–59. doi: 10.1007/978-1-62703-287-2_4. [DOI] [PubMed] [Google Scholar]
- 6.Lee K, Cui Y, Lee LP, Irudayaraj J. Nature Nanotechnology. 2014;9:474–480. doi: 10.1038/nnano.2014.73. [DOI] [PMC free article] [PubMed] [Google Scholar]
- 7.Weil TT, Parton RM, Davis I. Trends in Cell Biology. 2010;20:380–390. doi: 10.1016/j.tcb.2010.03.006. [DOI] [PMC free article] [PubMed] [Google Scholar]
- 8.Rodriguez AJ, Condeelis J, Singer RH, Dictenberg JB. Seminars in Cell & Developmental Biology. 2007:18, 202–208. doi: 10.1016/j.semcdb.2007.02.002. [DOI] [PMC free article] [PubMed] [Google Scholar]
- 9.Chao JA, Yoon YJ, Singer RH. Cold Spring Harbor Perspectives in Biology. 2012;4:a012310. doi: 10.1101/cshperspect.a012310. [DOI] [PMC free article] [PubMed] [Google Scholar]
- 10.Silahtaroglu AN, Nolting D, Dyrskjøt L, Berezikov E, Møller M, Tommerup N, Kauppinen S. Nature protocols. 2007;2:2520–2528. doi: 10.1038/nprot.2007.313. [DOI] [PubMed] [Google Scholar]
- 11.Lu J, Tsourkas A. Nucleic acids research. 2009;37:e100–e100. doi: 10.1093/nar/gkp482. [DOI] [PMC free article] [PubMed] [Google Scholar]
- 12.Chao J, Cao W, Su S, Weng L, Song S, Fan C, Wang L. Journal of Materials Chemistry B. 2016;4:1757–1769. doi: 10.1039/c5tb02135a. [DOI] [PubMed] [Google Scholar]
- 13.Abell JL, Garren JM, Driskell JD, Tripp RA, Zhao Y. Journal of the American Chemical Society. 2012;134:12889–12892. doi: 10.1021/ja3043432. [DOI] [PubMed] [Google Scholar]
- 14.Bell SEJ, Sirimuthu NMS. Journal of the American Chemical Society. 2006;128:15580–15581. doi: 10.1021/ja066263w. [DOI] [PubMed] [Google Scholar]
- 15.Driskell JD, Tripp RA. Chemical Communications. 2010;46:3298–3300. doi: 10.1039/c002059a. [DOI] [PubMed] [Google Scholar]
- 16.Kim S, Park JE, Hwang W, Seo J, Lee YK, Hwang JH, Nam JM. Journal of the American Chemical Society. 2017 doi: 10.1021/jacs.7b01311. [DOI] [PubMed] [Google Scholar]
- 17.Guven B, Dudak FC, Boyaci IH, Tamer U, Ozsoz M. Analyst. 2014;139:1141–1147. doi: 10.1039/c3an01600e. [DOI] [PubMed] [Google Scholar]
- 18.Ye L-P, Hu J, Liang L, Zhang C-y. Chemical Communications. 2014;50:11883–11886. doi: 10.1039/c4cc05598e. [DOI] [PubMed] [Google Scholar]
- 19.Lee H, Park JE, Nam JM. Nature Communications. 2014;5:3367. doi: 10.1038/ncomms4367. [DOI] [PubMed] [Google Scholar]
- 20.Kelley SO, Mirkin CA, Walt DR, Ismagilov RF, Toner M, Sargent EH. Nature nanotechnology. 2014;9:969–980. doi: 10.1038/nnano.2014.261. [DOI] [PMC free article] [PubMed] [Google Scholar]
- 21.Tyagi S. Nature Methods. 2009;6:331–338. doi: 10.1038/nmeth.1321. [DOI] [PubMed] [Google Scholar]
- 22.Santangelo PJ, Alonas E, Jung J, Lifland AW, Zurla C. In: Methods in Enzymology, Vol 505: Imaging and Spectroscopic Analysis of Living Cells: Live Cell Imaging of Cellular Elements and Functions. Conn PM, Elsvier Inc, editor. Vol. 505. 2012. pp. 383–399. [DOI] [PMC free article] [PubMed] [Google Scholar]
- 23.Rath AK, Rentmeister A. Current opinion in biotechnology. 2015;31:42–49. doi: 10.1016/j.copbio.2014.07.012. [DOI] [PubMed] [Google Scholar]
- 24.Rhee WJ, Bao G. BMC biotechnology. 2009;9:30. doi: 10.1186/1472-6750-9-30. [DOI] [PMC free article] [PubMed] [Google Scholar]
- 25.Li Q, Liu L, Liu JW, Jiang JH, Yu RQ, Chu X. TrAC Trends in Analytical Chemistry. 2014;58:130–144. [Google Scholar]
- 26.Hayashi G, Okamoto A. Chemical Record. 2013;13:209–217. doi: 10.1002/tcr.201200026. [DOI] [PubMed] [Google Scholar]
- 27.Boutorine AS, Novopashina DS, Krasheninina OA, Nozeret K, Venyaminova AG. Molecules. 2013;18:15357–15397. doi: 10.3390/molecules181215357. [DOI] [PMC free article] [PubMed] [Google Scholar]
- 28.Zhang P, Cheetham AG, Lock LL, Li Y, Cui H. Current opinion in biotechnology. 2015;34:171–179. doi: 10.1016/j.copbio.2015.01.009. [DOI] [PMC free article] [PubMed] [Google Scholar]
- 29.Thomas JA. Chemical Society Reviews. 2015;44:4494–4500. doi: 10.1039/c5cs00070j. [DOI] [PubMed] [Google Scholar]
- 30.Meng HM, Liu H, Kuai H, Peng R, Mo L, Zhang XB. Chemical Society Reviews. 2016;45:2583–2602. doi: 10.1039/c5cs00645g. [DOI] [PubMed] [Google Scholar]
- 31.Heuer-Jungemann A, Harimech PK, Brown T, Kanaras AG. Nanoscale. 2013;5:9503–9510. doi: 10.1039/c3nr03707j. [DOI] [PubMed] [Google Scholar]
- 32.Wang F, Niu G, Chen X, Cao F. European Journal of Nuclear Medicine and Molecular Imaging. 2011;38:1572–1579. doi: 10.1007/s00259-011-1786-0. [DOI] [PMC free article] [PubMed] [Google Scholar]
- 33.Urbanek MO, Nawrocka AU, Krzyzosiak WJ. International journal of molecular sciences. 2015;16:13259–13286. doi: 10.3390/ijms160613259. [DOI] [PMC free article] [PubMed] [Google Scholar]
- 34.Bertrand E, Chartrand P, Schaefer M, Shenoy SM, Singer RH, Long RM. Molecular cell. 1998;2:437–445. doi: 10.1016/s1097-2765(00)80143-4. [DOI] [PubMed] [Google Scholar]
- 35.Lionnet T, Czaplinski K, Darzacq X, Shav-Tal Y, Wells AL, Chao JA, Park HY, de Turris V, Lopez-Jones M, Singer RH. Nature Methods. 2011;8:165–170. doi: 10.1038/nmeth.1551. [DOI] [PMC free article] [PubMed] [Google Scholar]
- 36.Park HY, Lim H, Yoon YJ, Follenzi A, Nwokafor C, Lopez-Jones M, Meng X, Singer RH. Science. 2014;343:422–424. doi: 10.1126/science.1239200. [DOI] [PMC free article] [PubMed] [Google Scholar]
- 37.Carrocci TJ, Hoskins AA. Analyst. 2014;139:44–47. doi: 10.1039/c3an01550e. [DOI] [PMC free article] [PubMed] [Google Scholar]
- 38.Valencia-Burton M, Broude NE. Current protocols in cell biology/editorial board, Juan S Bonifacino … [et al] 2007 doi: 10.1002/0471143030.cb1711s37. Chapter 17, Unit 17.11-Unit 17.11. [DOI] [PubMed] [Google Scholar]
- 39.Hocine S, Raymond P, Zenklusen D, Chao JA, Singer RH. Nature methods. 2013;10:119–121. doi: 10.1038/nmeth.2305. [DOI] [PMC free article] [PubMed] [Google Scholar]
- 40.Wu B, Chao JA, Singer RH. Biophysical Journal. 2012;102:2936–2944. doi: 10.1016/j.bpj.2012.05.017. [DOI] [PMC free article] [PubMed] [Google Scholar]
- 41.Hu CD, Chinenov Y, Kerppola TK. Molecular cell. 2002;9:789–798. doi: 10.1016/s1097-2765(02)00496-3. [DOI] [PubMed] [Google Scholar]
- 42.Kodama Y, Hu CD. BioTechniques. 2012;53:285–298. doi: 10.2144/000113943. [DOI] [PubMed] [Google Scholar]
- 43.Yoshimura H, Inaguma A, Yamada T, Ozawa T. ACS chemical biology. 2012;7:999–1005. doi: 10.1021/cb200474a. [DOI] [PubMed] [Google Scholar]
- 44.Dictenberg J. Trends in Biotechnology. 2012;30:621–626. doi: 10.1016/j.tibtech.2012.09.004. [DOI] [PubMed] [Google Scholar]
- 45.Wu B, Chen J, Singer RH. Scientific Reports. 2014;4:3615. doi: 10.1038/srep03615. [DOI] [PMC free article] [PubMed] [Google Scholar]
- 46.Yiu HW, Demidov VV, Toran P, Cantor CR, Broude NE. Pharmaceuticals. 2011;4:494–508. [Google Scholar]
- 47.Paige JS, Wu KY, Jaffrey SR. Science. 2011;333:642–646. doi: 10.1126/science.1207339. [DOI] [PMC free article] [PubMed] [Google Scholar]
- 48.Zhang J, Fei J, Leslie BJ, Han KY, Kuhlman TE, Ha T. Scientific reports. 2015;5:17295. doi: 10.1038/srep17295. [DOI] [PMC free article] [PubMed] [Google Scholar]
- 49.Strack RL, Disney MD, Jaffrey SR. Nature Methods. 2013;10:1219–1227. doi: 10.1038/nmeth.2701. [DOI] [PMC free article] [PubMed] [Google Scholar]
- 50.You M, Jaffrey SR. Annual review of biophysics. 2015;44:187–206. doi: 10.1146/annurev-biophys-060414-033954. [DOI] [PubMed] [Google Scholar]
- 51.Warner KD, Chen MC, Song W, Strack RL, Thorn A, Jaffrey SR, Ferré-D’Amaré AR. Nature structural & molecular biology. 2014;21:658–663. doi: 10.1038/nsmb.2865. [DOI] [PMC free article] [PubMed] [Google Scholar]
- 52.Filonov GS, Moon JD, Svensen N, Jaffrey SR. Journal of the American Chemical Society. 2014;136:16299–16308. doi: 10.1021/ja508478x. [DOI] [PMC free article] [PubMed] [Google Scholar]
- 53.Autour A, Westhof E, Ryckelynck M. Nucleic acids research. 2016;44:2491–2500. doi: 10.1093/nar/gkw083. [DOI] [PMC free article] [PubMed] [Google Scholar]
- 54.Sunbul M, Jäschke A. Angewandte Chemie International Edition. 2013;52:13401–13404. doi: 10.1002/anie.201306622. [DOI] [PubMed] [Google Scholar]
- 55.Arora A, Sunbul M, Jäschke A. Nucleic acids research. 2015;43:e144–e144. doi: 10.1093/nar/gkv718. [DOI] [PMC free article] [PubMed] [Google Scholar]
- 56.Dolgosheina EV, Jeng SC, Panchapakesan SSS, Cojocaru R, Chen PS, Wilson PD, Hawkins N, Wiggins PA, Unrau PJ. ACS chemical biology. 2014;9:2412–2420. doi: 10.1021/cb500499x. [DOI] [PubMed] [Google Scholar]
- 57.Song W, Strack RL, Svensen N, Jaffrey SR. Journal of the American Chemical Society. 2014;136:1198–1201. doi: 10.1021/ja410819x. [DOI] [PMC free article] [PubMed] [Google Scholar]
- 58.Ilgu M, Ray J, Bendickson L, Wang T, Geraskin IM, Kraus GA, Nilsen-Hamilton M. Methods. 2016;98:26–33. doi: 10.1016/j.ymeth.2015.12.009. [DOI] [PMC free article] [PubMed] [Google Scholar]
- 59.Shin I, Ray J, Gupta V, Ilgu M, Beasley J, Bendickson L, Mehanovic S, Kraus GA, Nilsen-Hamilton M. Nucleic Acids Research. 2014;42:e90. doi: 10.1093/nar/gku297. [DOI] [PMC free article] [PubMed] [Google Scholar]
- 60.Kim S, Hwang DW, Lee DS. FEBS journal. 2009;276:2165–2174. doi: 10.1111/j.1742-4658.2009.06935.x. [DOI] [PubMed] [Google Scholar]
- 61.Niu G, Chen X. Molecular Imaging and Biology. 2009;11:61–63. doi: 10.1007/s11307-008-0190-z. [DOI] [PubMed] [Google Scholar]
- 62.Niu G, Chen X. Theranostics. 2012;2:413–423. doi: 10.7150/thno.3940. [DOI] [PMC free article] [PubMed] [Google Scholar]
- 63.Oh SW, Do Won Hwang DSL. Theranostics. 2013;3:1004. doi: 10.7150/thno.4580. [DOI] [PMC free article] [PubMed] [Google Scholar]
- 64.Pillai RS. Rna-a Publication of the Rna Society. 2005;11:1753–1761. doi: 10.1261/rna.2248605. [DOI] [PMC free article] [PubMed] [Google Scholar]
- 65.Dong H, Lei J, Ding L, Wen Y, Ju H, Zhang X. Chemical reviews. 2013;113:6207–6233. doi: 10.1021/cr300362f. [DOI] [PubMed] [Google Scholar]
- 66.Choi Y, Do won Hwang MYK, Kim JY, Sun W, Lee DS. Frontiers in Molecular Neuroscience. 2016;9:52. doi: 10.3389/fnmol.2016.00052. [DOI] [PMC free article] [PubMed] [Google Scholar]
- 67.Wang F, Zhang B, Zhou L, Shi Y, Li Z, Xia Y, Tian J. ACS applied materials & interfaces. 2016;8:9014–9021. doi: 10.1021/acsami.6b02662. [DOI] [PubMed] [Google Scholar]
- 68.Kim HJ, Chung JK, Lee DS, Kim S. Molecular Imaging and Biology. 2009;11:71–78. doi: 10.1007/s11307-008-0188-6. [DOI] [PubMed] [Google Scholar]
- 69.Tu Y, Wan L, Zhao D, Bu L, Dong D, Yin Z, Cheng Z, Shen B. European journal of nuclear medicine and molecular imaging. 2014;41:972–984. doi: 10.1007/s00259-013-2596-3. [DOI] [PubMed] [Google Scholar]
- 70.Ko HY, Lee DS, Kim S. Nature protocols. 2009;4:1663–1669. doi: 10.1038/nprot.2009.119. [DOI] [PubMed] [Google Scholar]
- 71.Ko HY, Lee YS, Kim S. Bioluminescent Imaging: Methods and Protocols. 2014:85–95. [Google Scholar]
- 72.Troy T, Jekic-McMullen D, Sambucetti L, Rice B. Molecular imaging. 2004;3:9–23. doi: 10.1162/15353500200403196. [DOI] [PubMed] [Google Scholar]
- 73.Lee JY, Kim S, Jeong JM, Chung JK, Lee MC, Lee DS. Journal of nuclear medicine. 2008;49:285–294. doi: 10.2967/jnumed.107.042507. [DOI] [PubMed] [Google Scholar]
- 74.Wang F, Song X, Li X, Xin J, Wang S, Yang W, Wang J, Wu K, Chen X, Liang J. PloS one. 2013;8:e61792. doi: 10.1371/journal.pone.0061792. [DOI] [PMC free article] [PubMed] [Google Scholar]
- 75.Levsky JM, Singer RH. Journal of Cell Science. 2003;116:2833–2838. doi: 10.1242/jcs.00633. [DOI] [PubMed] [Google Scholar]
- 76.Huang J, Wang H, Yang X, Quan K, Yang Y, Ying L, Xie N, Ou M, Wang K. Chemical Science. 2016;7:3829–3835. doi: 10.1039/c6sc00377j. [DOI] [PMC free article] [PubMed] [Google Scholar]
- 77.Femino AM, Fay FS, Fogarty K, Singer RH. Science. 1998;280:585–590. doi: 10.1126/science.280.5363.585. [DOI] [PubMed] [Google Scholar]
- 78.Trcek T, Chao JA, Larson DR, Park HY, Zenklusen D, Shenoy SM, Singer RH. Nature Protocols. 2012;7:408–419. doi: 10.1038/nprot.2011.451. [DOI] [PMC free article] [PubMed] [Google Scholar]
- 79.Raj A, Tyagi S. Methods in enzymology. 2010;472:365–386. doi: 10.1016/S0076-6879(10)72004-8. [DOI] [PubMed] [Google Scholar]
- 80.Kwon S. Bmb Reports. 2013;46:65–72. doi: 10.5483/BMBRep.2013.46.2.016. [DOI] [PMC free article] [PubMed] [Google Scholar]
- 81.Vautrot V, Aigueperse C, Branlant C, Behm-Ansmant I. Small Non-Coding RNAs: Methods and Protocols. 2015:73–83. doi: 10.1007/978-1-4939-2547-6_8. [DOI] [PubMed] [Google Scholar]
- 82.Li J, Li X, Li Y, Yang H, Wang L, Qin Y, Liu H, Fu L, Guan XY. PloS one. 2013;8:e53582. doi: 10.1371/journal.pone.0053582. [DOI] [PMC free article] [PubMed] [Google Scholar]
- 83.Song R, Ro S, Yan W. RNA Therapeutics: Function, Design, and Delivery. 2010:285–292. [Google Scholar]
- 84.Søe MJ, Møller T, Dufva M, Holmstrøm K. Journal of Histochemistry & Cytochemistry. 2011;59:661–672. doi: 10.1369/0022155411409411. [DOI] [PMC free article] [PubMed] [Google Scholar]
- 85.Choi HM, Chang JY, Trinh LA, Padilla JE, Fraser SE, Pierce NA. Nature biotechnology. 2010;28:1208–1212. doi: 10.1038/nbt.1692. [DOI] [PMC free article] [PubMed] [Google Scholar]
- 86.Ge J, Zhang LL, Liu SJ, Yu RQ, Chu X. Analytical chemistry. 2014;86:1808–1815. doi: 10.1021/ac403741y. [DOI] [PubMed] [Google Scholar]
- 87.Deng R, Tang L, Tian Q, Wang Y, Lin L, Li J. Angewandte Chemie International Edition. 2014;53:2389–2393. doi: 10.1002/anie.201309388. [DOI] [PubMed] [Google Scholar]
- 88.Chaudhuri AD, Yelamanchili SV, Fox HS. Frontiers in cellular neuroscience. 2013;7:1–8. doi: 10.3389/fncel.2013.00160. [DOI] [PMC free article] [PubMed] [Google Scholar]
- 89.Wang Z, Yang B. MicroRNA Expression Detection Methods, Springer. 2010:353–359. [Google Scholar]
- 90.Paragas VB, Zhang YZ, Haugland RP, Singer VL. Journal of Histochemistry & Cytochemistry. 1997;45:345–357. doi: 10.1177/002215549704500302. [DOI] [PubMed] [Google Scholar]
- 91.Lubeck E, Coskun AF, Zhiyentayev T, Ahmad M, Cai L. Nature Methods. 2014;11:360–361. doi: 10.1038/nmeth.2892. [DOI] [PMC free article] [PubMed] [Google Scholar]
- 92.Chen KH, Boettiger AN, Moffitt JR, Wang S, Zhuang X. Science. 2015;348:aaa6090. doi: 10.1126/science.aaa6090. [DOI] [PMC free article] [PubMed] [Google Scholar]
- 93.Wu CS, Peng L, You M, Han D, Chen T, Williams KR, Yang CJ, Tan W. International journal of molecular imaging. 2012;2012:501579–501579. doi: 10.1155/2012/501579. [DOI] [PMC free article] [PubMed] [Google Scholar]
- 94.Yang CYJ, Medley CD, Tan WH. Current Pharmaceutical Biotechnology. 2005;6:445–452. doi: 10.2174/138920105775159322. [DOI] [PubMed] [Google Scholar]
- 95.Han S, Jia X, Ma J, Zhu Q. Archivum immunologiae et therapiae experimentalis. 2013;61:139–148. doi: 10.1007/s00005-012-0209-7. [DOI] [PMC free article] [PubMed] [Google Scholar]
- 96.Wang K, Tang Z, Yang CJ, Kim Y, Fang X, Li W, Wu Y, Medley CD, Cao Z, Li J. Angewandte Chemie International Edition. 2009;48:856–870. doi: 10.1002/anie.200800370. [DOI] [PMC free article] [PubMed] [Google Scholar]
- 97.Kim E, Yang J, Park J, Kim S, Kim NH, Yook JI, Suh JS, Haam S, Huh YM. ACS nano. 2012;6:8525–8535. doi: 10.1021/nn300289u. [DOI] [PubMed] [Google Scholar]
- 98.El-Yazbi AF, Loppnow GR. Analytical chemistry. 2013;85:4321–4327. doi: 10.1021/ac301669y. [DOI] [PubMed] [Google Scholar]
- 99.Wu Y, Yang CJ, Moroz LL, Tan W. Analytical Chemistry. 2008;80:3025–3028. doi: 10.1021/ac702637w. [DOI] [PMC free article] [PubMed] [Google Scholar]
- 100.Socher E, Bethge L, Knoll A, Jungnick N, Herrmann A, Seitz O. Angewandte Chemie International Edition. 2008;47:9555–9559. doi: 10.1002/anie.200803549. [DOI] [PubMed] [Google Scholar]
- 101.Cheglakov Z, Cronin TM, He C, Weizmann Y. Journal of the American Chemical Society. 2015;137:6116–6119. doi: 10.1021/jacs.5b01451. [DOI] [PubMed] [Google Scholar]
- 102.Jung C, Ellington AD. Accounts of chemical research. 2014;47:1825–1835. doi: 10.1021/ar500059c. [DOI] [PMC free article] [PubMed] [Google Scholar]
- 103.Wu C, Cansiz S, Zhang L, Teng I, Qiu L, Li J, Liu Y, Zhou C, Hu R, Zhang T. Journal of the American Chemical Society. 2015;137:4900–4903. doi: 10.1021/jacs.5b00542. [DOI] [PMC free article] [PubMed] [Google Scholar]
- 104.Zhang K, Wang K, Zhu X, Xie M. Sensors and Actuators B: Chemical. 2016;223:586–590. [Google Scholar]
- 105.Lee J, Kim S. RNA Imaging: Methods and Protocols. 2016:129–138. [Google Scholar]
- 106.Kang HJ, Lee J, Ali BA, Al-Khedhairy AA, Kim S. RNA & DISEASE. 2015;2:e697. [Google Scholar]
- 107.Kang WJ, Cho YL, Chae JR, Lee JD, Choi KJ, Kim S. Biomaterials. 2011;32:1915–1922. doi: 10.1016/j.biomaterials.2010.11.007. [DOI] [PubMed] [Google Scholar]
- 108.Wang Z, Zhang K, Shen Y, Smith J, Bloch S, Achilefu S, Wooley KL, Taylor JS. Organic & Biomolecular Chemistry. 2013;11:3159–3167. doi: 10.1039/c3ob26923j. [DOI] [PMC free article] [PubMed] [Google Scholar]
- 109.Wiraja C, Yeo DC, Chew SY, Xu C. Journal of Materials Chemistry B. 2015;3:6148–6156. doi: 10.1039/c5tb00876j. [DOI] [PubMed] [Google Scholar]
- 110.Wang Y, Yu Z, Zhang Z, Ren R, Zhang S. Analyst. 2016;141:2861–2864. doi: 10.1039/c6an00160b. [DOI] [PubMed] [Google Scholar]
- 111.Lee J, Moon SU, Lee YS, Ali BA, Al-Khedhairy AA, Ali D, Ahmed J, Al Salem AM, Kim S. Sensors. 2015;15:12872–12883. doi: 10.3390/s150612872. [DOI] [PMC free article] [PubMed] [Google Scholar]
- 112.Noh EH, Ko HY, Lee CH, Jeong MS, Chang YW, Kim S. Journal of Materials Chemistry B. 2013;1:4438–4445. doi: 10.1039/c3tb20710b. [DOI] [PubMed] [Google Scholar]
- 113.Wu Z, Liu GQ, Yang XL, Jiang JH. Journal of the American Chemical Society. 2015;137:6829–6836. doi: 10.1021/jacs.5b01778. [DOI] [PubMed] [Google Scholar]
- 114.Nitin N, Santangelo PJ, Kim G, Nie S, Bao G. Nucleic acids research. 2004;32:e58–e58. doi: 10.1093/nar/gnh063. [DOI] [PMC free article] [PubMed] [Google Scholar]
- 115.Qiu L, Wu C, You M, Han D, Chen T, Zhu G, Jiang J, Yu R, Tan W. Journal of the American Chemical Society. 2013;135:12952–12955. doi: 10.1021/ja406252w. [DOI] [PMC free article] [PubMed] [Google Scholar]
- 116.Kim J, Lee E, Kang YY, Mok H. Chemical Communications. 2015;51:9038–9041. doi: 10.1039/c5cc02052b. [DOI] [PubMed] [Google Scholar]
- 117.Tay CY, Yuan L, Leong DT. ACS nano. 2015;9:5609–5617. doi: 10.1021/acsnano.5b01954. [DOI] [PubMed] [Google Scholar]
- 118.Wang Y, Wu C, Chen T, Sun H, Cansiz S, Zhang L, Cui C, Hou W, Wu Y, Wan S. Chemical Science. 2016;7:6041–6049. doi: 10.1039/c6sc00066e. [DOI] [PMC free article] [PubMed] [Google Scholar]
- 119.Chen T, Wu CS, Jimenez E, Zhu Z, Dajac JG, You M, Han D, Zhang X, Tan W. Angewandte Chemie-International Edition. 2013;52:2012–2016. doi: 10.1002/anie.201209440. [DOI] [PMC free article] [PubMed] [Google Scholar]
- 120.Dubertret B, Calame M, Libchaber AJ. Nature biotechnology. 2001;19:365–370. doi: 10.1038/86762. [DOI] [PubMed] [Google Scholar]
- 121.Pan W, Yang H, Li N, Yang L, Tang B. Chemistry–A European Journal. 2015;21:6070–6073. doi: 10.1002/chem.201500365. [DOI] [PubMed] [Google Scholar]
- 122.Choi CKK, Li J, Wei K, Xu YJ, Ho LWC, Zhu M, To KK, Choi CHJ, Bian L. Journal of the American Chemical Society. 2015;137:7337–7346. doi: 10.1021/jacs.5b01457. [DOI] [PubMed] [Google Scholar]
- 123.Briley WE, Bondy MH, Randeria PS, Dupper TJ, Mirkin CA. Proceedings of the National Academy of Sciences. 2015;112:9591–9595. doi: 10.1073/pnas.1510581112. [DOI] [PMC free article] [PubMed] [Google Scholar]
- 124.Yang Y, Huang J, Yang X, Quan K, Wang H, Ying L, Xie N, Ou M, Wang K. Journal of the American Chemical Society. 2015;137:8340–8343. doi: 10.1021/jacs.5b04007. [DOI] [PubMed] [Google Scholar]
- 125.Seferos DS, Giljohann DA, Hill HD, Prigodich AE, Mirkin CA. Journal of the American Chemical Society. 2007;129:15477–15479. doi: 10.1021/ja0776529. [DOI] [PMC free article] [PubMed] [Google Scholar]
- 126.Xue J, Shan L, Chen H, Li Y, Zhu H, Deng D, Qian Z, Achilefu S, Gu Y. Biosensors and Bioelectronics. 2013;41:71–77. doi: 10.1016/j.bios.2012.06.062. [DOI] [PubMed] [Google Scholar]
- 127.Tu Y, Wu P, Zhang H, Cai C. Chemical Communications. 2012;48:10718–10720. doi: 10.1039/c2cc35564g. [DOI] [PubMed] [Google Scholar]
- 128.Wang S, Riahi R, Li N, Zhang DD, Wong PK. Advanced Materials. 2015;27:6034–6038. doi: 10.1002/adma.201502814. [DOI] [PubMed] [Google Scholar]
- 129.Riahi R, Wang S, Long M, Li N, Chiou PY, Zhang DD, Wong PK. ACS nano. 2014;8:3597–3605. doi: 10.1021/nn500107g. [DOI] [PMC free article] [PubMed] [Google Scholar]
- 130.Prigodich AE, Randeria PS, Briley WE, Kim NJ, Daniel WL, Giljohann DA, Mirkin CA. Analytical Chemistry. 2012;84:2062–2066. doi: 10.1021/ac202648w. [DOI] [PMC free article] [PubMed] [Google Scholar]
- 131.Li N, Chang C, Pan W, Tang B. Angewandte Chemie International Edition. 2012;51:7426–7430. doi: 10.1002/anie.201203767. [DOI] [PubMed] [Google Scholar]
- 132.Pan W, Zhang T, Yang H, Diao W, Li N, Tang B. Analytical chemistry. 2013;85:10581–10588. doi: 10.1021/ac402700s. [DOI] [PubMed] [Google Scholar]
- 133.Pan W, Li Y, Wang M, Yang H, Li N, Tang B. Chemical Communications. 2016;52:4569–4572. doi: 10.1039/c5cc10147f. [DOI] [PubMed] [Google Scholar]
- 134.Dulkeith E, Ringler M, Klar T, Feldmann J, Munoz Javier A, Parak W. Nano Letters. 2005;5:585–589. doi: 10.1021/nl0480969. [DOI] [PubMed] [Google Scholar]
- 135.Seferos DS, Prigodich AE, Giljohann DA, Patel PC, Mirkin CA. Nano letters. 2008;9:308–311. doi: 10.1021/nl802958f. [DOI] [PMC free article] [PubMed] [Google Scholar]
- 136.Choi CHJ, Hao L, Narayan SP, Auyeung E, Mirkin CA. Proceedings of the National Academy of Sciences. 2013;110:7625–7630. doi: 10.1073/pnas.1305804110. [DOI] [PMC free article] [PubMed] [Google Scholar]
- 137.Shi J, Zhou M, Gong A, Li Q, Wu Q, Cheng GJ, Yang M, Sun Y. Analytical chemistry. 2016;88:1979–1983. doi: 10.1021/acs.analchem.5b03689. [DOI] [PubMed] [Google Scholar]
- 138.Prigodich AE, Seferos DS, Massich MD, Giljohann DA, Lane BC, Mirkin CA. Acs Nano. 2009;3:2147–2152. doi: 10.1021/nn9003814. [DOI] [PMC free article] [PubMed] [Google Scholar]
- 139.Rosi NL, Giljohann DA, Thaxton CS, Lytton-Jean AK, Han MS, Mirkin CA. Science. 2006;312:1027–1030. doi: 10.1126/science.1125559. [DOI] [PubMed] [Google Scholar]
- 140.Qin L, Lin LX, Fang ZP, Yang SP, Qiu GH, Chen JX, Chen WH. Chemical Communications. 2016;52:132–135. doi: 10.1039/c5cc06697b. [DOI] [PubMed] [Google Scholar]
- 141.Ke K, Lin L, Liang H, Chen X, Han C, Li J, Yang HH. Chemical Communications. 2015;51:6800–6803. doi: 10.1039/c5cc01129a. [DOI] [PubMed] [Google Scholar]
- 142.Lin L, Cong Z, Cao J, Ke K, Peng Q, Gao J, Yang H, Liu G, Chen X. ACS nano. 2014;8:3876–3883. doi: 10.1021/nn500722y. [DOI] [PMC free article] [PubMed] [Google Scholar]
- 143.Kummer S, Knoll A, Socher E, Bethge L, Herrmann A, Seitz O. Angewandte Chemie International Edition. 2011;50:1931–1934. doi: 10.1002/anie.201005902. [DOI] [PubMed] [Google Scholar]
- 144.Hövelmann F, Gaspar I, Loibl S, Ermilov EA, Röder B, Wengel J, Ephrussi A, Seitz O. Angewandte Chemie International Edition. 2014;53:11370–11375. doi: 10.1002/anie.201406022. [DOI] [PubMed] [Google Scholar]
- 145.Hövelmann F, Gaspar I, Ephrussi A, Seitz O. Journal of the American Chemical Society. 2013;135:19025–19032. doi: 10.1021/ja410674h. [DOI] [PubMed] [Google Scholar]
- 146.Hövelmann F, Gaspar I, Chamiolo J, Kasper M, Steffen J, Ephrussi A, Seitz O. Chemical Science. 2016;7:128–135. doi: 10.1039/c5sc03053f. [DOI] [PMC free article] [PubMed] [Google Scholar]
- 147.Liao R, He K, Chen C, Chen X, Cai C. Analytical chemistry. 2016;88:4254–4258. doi: 10.1021/acs.analchem.5b04154. [DOI] [PubMed] [Google Scholar]
- 148.Okamoto A. Chemical Society Reviews. 2011;40:5815–5828. doi: 10.1039/c1cs15025a. [DOI] [PubMed] [Google Scholar]
- 149.Ikeda S, Okamoto A. Chemistry–An Asian Journal. 2008;3:958–968. doi: 10.1002/asia.200800014. [DOI] [PubMed] [Google Scholar]
- 150.Oomoto I, Suzuki-Hirano A, Umeshima H, Han YW, Yanagisawa H, Carlton P, Harada Y, Kengaku M, Okamoto A, Shimogori T, Wang DO. Nucleic Acids Research. 2015;43:e126. doi: 10.1093/nar/gkv614. [DOI] [PMC free article] [PubMed] [Google Scholar]
- 151.Tilsner J. Plasmodesmata: Methods and Protocols. 2015:295–328. doi: 10.1007/978-1-4939-1523-1_20. [DOI] [PubMed] [Google Scholar]
- 152.Tilsner J, Linnik O, Christensen NM, Bell K, Roberts IM, Lacomme C, Oparka KJ. The Plant Journal. 2009;57:758–770. doi: 10.1111/j.1365-313X.2008.03720.x. [DOI] [PubMed] [Google Scholar]
- 153.Yamada T, Yoshimura H, Shimada R, Hattori M, Eguchi M, Fujiwara TK, Kusumi A, Ozawa T. Scientific Reports. 2016;6:38910. doi: 10.1038/srep38910. [DOI] [PMC free article] [PubMed] [Google Scholar]
- 154.Adamala KP, Martin-Alarcon DA, Boyden ES. Proceedings of the National Academy of Sciences. 2016;113:E2579–E2588. doi: 10.1073/pnas.1519368113. [DOI] [PMC free article] [PubMed] [Google Scholar]
- 155.Kikuchi N, Kolpashchikov DM. Chem Bio Chem. 2016;17:1–5. [Google Scholar]
- 156.Rogers TA, Andrews GE, Jaeger L, Grabow WW. ACS synthetic biology. 2014;4:162–166. doi: 10.1021/sb5000725. [DOI] [PubMed] [Google Scholar]
- 157.Sato SI, Watanabe M, Katsuda Y, Murata A, Wang DO, Uesugi M. Angewandte Chemie. 2015;127:1875–1878. doi: 10.1002/anie.201410339. [DOI] [PubMed] [Google Scholar]
- 158.Yoo B, Kavishwar A, Ghosh SK, Barteneva N, Yigit MV, Moore A, Medarova Z. Chemistry & Biology. 2014;21:199–204. doi: 10.1016/j.chembiol.2013.12.007. [DOI] [PMC free article] [PubMed] [Google Scholar]
- 159.Kang WJ, Cho YL, Chae JR, Lee JD, Ali BA, Al-Khedhairy AA, Lee CH, Kim S. Biomaterials. 2012;33:6430–6437. doi: 10.1016/j.biomaterials.2012.05.056. [DOI] [PubMed] [Google Scholar]
- 160.Muramoto T, Cannon D, Gierlinski M, Corrigan A, Barton GJ, Chubb JR. Proceedings of the National Academy of Sciences of the United States of America. 2012;109:7350–7355. doi: 10.1073/pnas.1117603109. [DOI] [PMC free article] [PubMed] [Google Scholar]
- 161.Rino J, Martin RM, Carvalho T, Carmo-Fonseca M. Methods. 2014;65:359–366. doi: 10.1016/j.ymeth.2013.08.010. [DOI] [PubMed] [Google Scholar]
- 162.Vargas Diana Y, Shah K, Batish M, Levandoski M, Sinha S, Marras Salvatore AE, Schedl P, Tyagi S. Cell. 2011;147:1054–1065. doi: 10.1016/j.cell.2011.10.024. [DOI] [PMC free article] [PubMed] [Google Scholar]
- 163.Buxbaum AR, Wu B, Singer RH. Science. 2014;343:419–422. doi: 10.1126/science.1242939. [DOI] [PMC free article] [PubMed] [Google Scholar]
- 164.Wang Z, Zhang R, Wang Z, Wang HF, Wang Y, Zhao J, Wang F, Li W, Niu G, Kiesewetter DO, Chen X. ACS Nano. 2014;8:12386–12396. doi: 10.1021/nn505047n. [DOI] [PMC free article] [PubMed] [Google Scholar]
- 165.Hayashi R, Wainwright SM, Liddell SJ, Pinchin SM, Horswell S, Ish-Horowicz D. G3-Genes Genomes Genetics. 2014;4:749–760. doi: 10.1534/g3.114.010462. [DOI] [PMC free article] [PubMed] [Google Scholar]
- 166.Pallavicini MG, George T, Deteresa PS, Amendola R, Gray JW. Journal of cellular physiology. 1994;158:223–230. doi: 10.1002/jcp.1041580203. [DOI] [PubMed] [Google Scholar]
- 167.Zimyanin VL, Belaya K, Pecreaux J, Gilchrist MJ, Clark A, Davis I, St Johnston D. Cell. 2008;134:843–853. doi: 10.1016/j.cell.2008.06.053. [DOI] [PMC free article] [PubMed] [Google Scholar]
- 168.van Gemert AMC, van der Laan AMA, Pilgram GSK, Fradkin LG, Noordermeer JN, Tanke HJ, Jost CR. Plos One. 2009;4:e6663. doi: 10.1371/journal.pone.0006663. [DOI] [PMC free article] [PubMed] [Google Scholar]
- 169.Lee J, Kang HJ, Lee YS, Heo H, Gu HN, Cho S, Kim S. Chemical Communications. 2015;51:7199–7202. doi: 10.1039/c4cc10231b. [DOI] [PubMed] [Google Scholar]
- 170.Kam Y, Rubinstein A, Nissan A, Halle D, Yavin E. Molecular Pharmaceutics. 2012;9:685–693. doi: 10.1021/mp200505k. [DOI] [PubMed] [Google Scholar]
- 171.Viswanathan S, Williams ME, Bloss EB, Stasevich TJ, Speer CM, Nern A, Pfeiffer BD, Hooks BM, Li WP, English BP, Tian T, Henry GL, Macklin JJ, Patel R, Gerfen CR, Zhuang X, Wang Y, Rubin GM, Looger LL. Nat Meth. 2015;12:568–576. doi: 10.1038/nmeth.3365. [DOI] [PMC free article] [PubMed] [Google Scholar]
- 172.Park HY, Buxbaum AR, Singer RH. Methods in enzymology. 2010;472:387–406. doi: 10.1016/S0076-6879(10)72003-6. [DOI] [PMC free article] [PubMed] [Google Scholar]
- 173.Annibale P, Gratton E. Transcription. 2014;5:e28425. doi: 10.4161/trns.28425. [DOI] [PMC free article] [PubMed] [Google Scholar]
- 174.Saneyoshi H, Ito Y, Abe H. Journal of the American Chemical Society. 2013;135:13632–13635. doi: 10.1021/ja406724k. [DOI] [PubMed] [Google Scholar]


