Abstract
Metabolic reprogramming by oncogenic signals promotes cancer initiation and progression. The oncogene KRAS and tumor suppressor STK11, which encodes the kinase LKB1, regulate metabolism and are frequently mutated in non-small cell lung cancer (NSCLC). Concurrent KRAS mutation and LKB1 loss (KL) specifies aggressive oncological behavior1,2. We show that KL cells and tumors share metabolomic signatures of perturbed nitrogen handling. KL cells express the urea cycle enzyme carbamoyl phosphate synthetase-1 (CPS1), which produces carbamoyl phosphate (CP) in the mitochondria from ammonia and bicarbonate, initiating nitrogen disposal. CPS1 transcription is suppressed by LKB1 via AMPK, and CPS1 expression anticorrelates with LKB1 in human NSCLC. Silencing CPS1 in KL cells induces cell death and reduces tumor growth. Surprisingly, cell death results from pyrimidine depletion rather than ammonia toxicity, as CPS1 enables an unconventional pathway of nitrogen flow from ammonia into pyrimidines. CPS1 loss reduces the pyrimidine/purine ratio, compromises S-phase progression, and induces DNA polymerase stalling and DNA damage. Exogenous pyrimidines reverse DNA damage and rescue growth. The data indicate that the KL oncogenotype imposes a novel metabolic vulnerability related to exquisite dependence on a cross-compartmental pathway of pyrimidine metabolism in an aggressive subset of NSCLC.
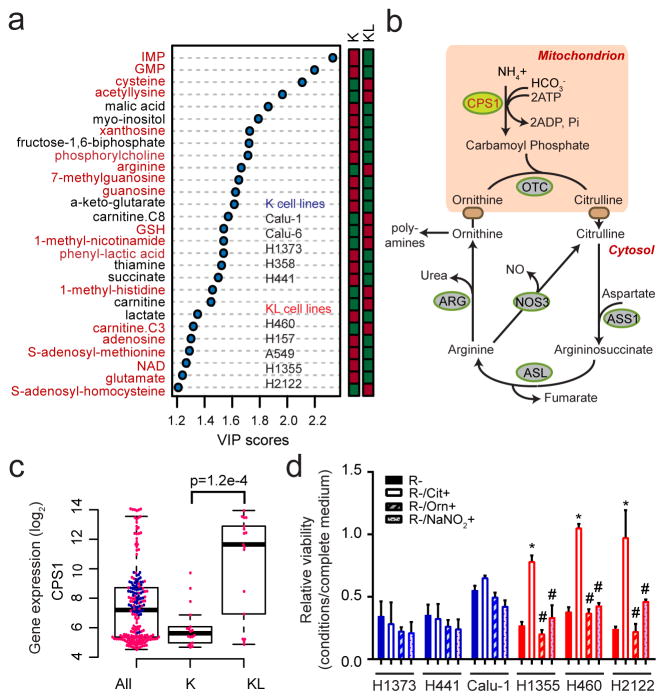
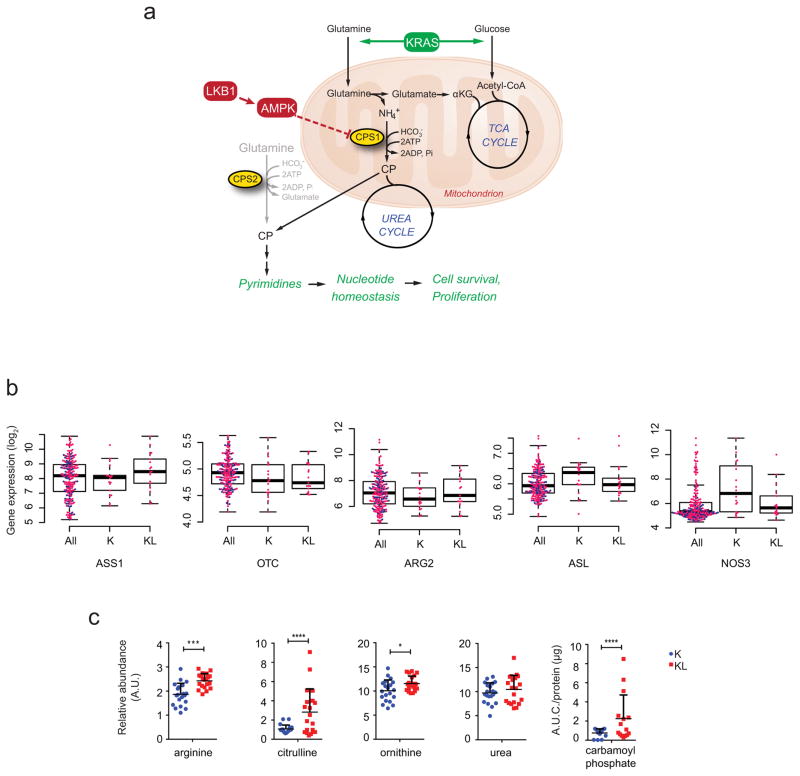
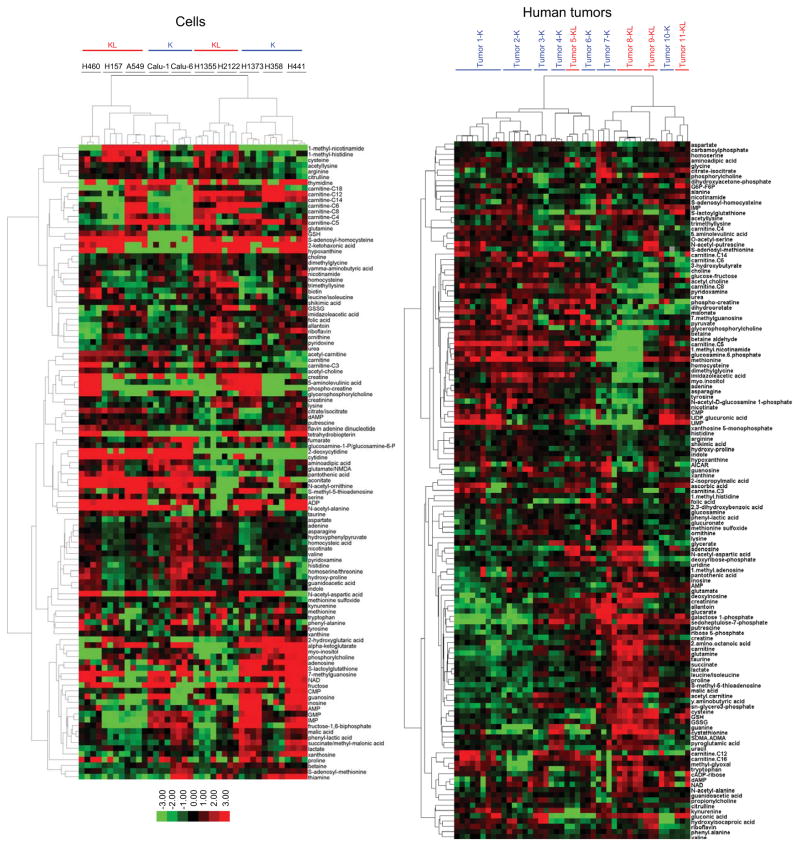
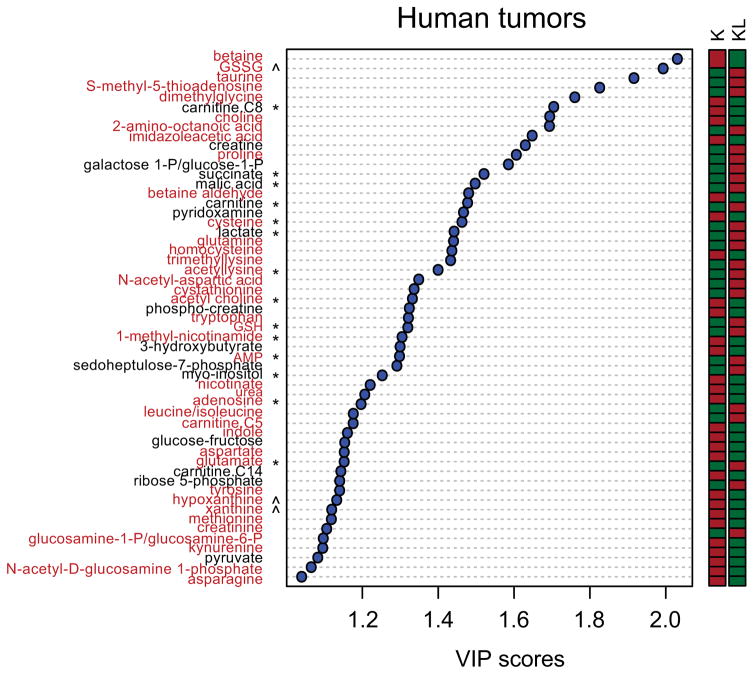
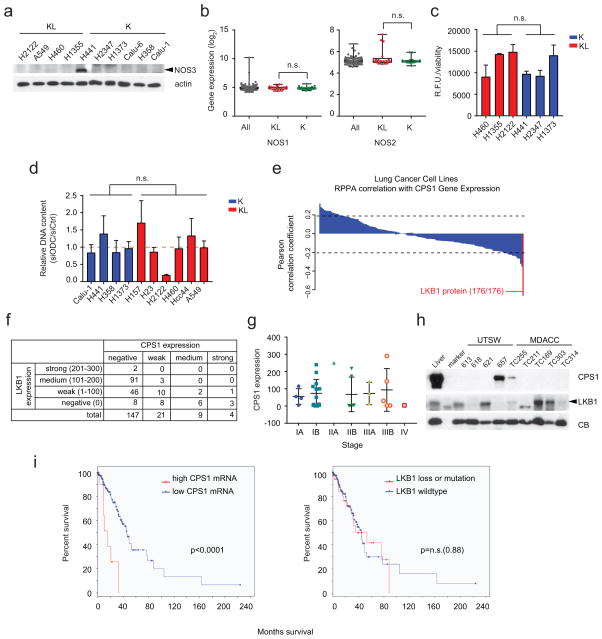
Given that KL status influences metabolic vulnerabilities3,4, we compared the metabolomes of NSCLC cells with mutant KRAS (K) to those with mutant KRAS plus LKB1 loss (KL) (Supplementary Data Table 1; Extended Data Fig. 2). Supervised analysis revealed that most metabolites discriminating between the two genotypes involved nitrogen metabolism (Fig. 1a; Supplementary Data Table 2; Supplemental Discussion). Metabolomics of human NSCLC also revealed altered nitrogen metabolism in KL tumors (Extended Data Figs. 2,3; Supplementary Data Tables 3,4). Several urea cycle metabolites accumulated in KL cell lines, and mRNA expression of 203 cell lines (144 lung cancer and 59 bronchial/small airway epithelial cell lines) demonstrated enhanced CPS1 expression in KL cells (Fig. 1b,c; Extended Data Fig. 1c; Supplementary Data Tables 5,6). CPS1 catalyzes the rate-limiting step of the urea cycle (Fig. 1b). Genes encoding other urea cycle enzymes, and expression and activity of nitric oxide synthase, which articulates with the urea cycle, were not dramatically altered among genotypes (Extended Data Figs. 1b, 4a–c).
Figure 1. Altered urea cycle metabolism in KL cells.
a, Metabolites differentiating between five K and five KL cell lines (VIP>1.0, metabolites with VIP>1.2 are shown). Metabolites from nitrogen-related pathways are in red. Relative metabolite abundance is indicated in the bar, with red representing metabolite accumulation. b, Schematic of the urea cycle. c, Distribution of CPS1 mRNA abundance in 203 cell lines. d, Sensitivity to arginine deprivation with or without metabolite supplementation. R: arginine, Cit: citrulline, Orn: ornithine, NaNO2: sodium nitrite. Data are the average and SD of three independent cultures. Statistical significance was assessed using two-tailed Student’s t-test (c); one-way ANOVA with Tukey’s multiple comparisons (d). In panel d, *, p<0.05 comparing to R-; #, p<0.05 comparing to R-/Cit+. Metabolomics was performed once, and viability was measured twice.
In the urea cycle, mitochondrial CP condenses with ornithine to produce citrulline, which is exported to the cytosol and converted to arginine (Fig. 1b). Although the cytosolic enzymes are broadly expressed, the mitochondrial enzymes including CPS1 are largely confined to hepatocytes, restricting robust urea production from ammonia to the liver5. Somatic ASS1 and ASL loss in some tumor cells promotes proliferation by increasing aspartate availability for other pathways6. To assess the cytosolic segment, we deprived cells of arginine and measured growth in the presence and absence of exogenous citrulline. Arginine depletion suppressed growth of all lines, but KL cells were protected by citrulline, indicating their ability to generate arginine from citrulline (Fig. 1d). Neither ornithine nor nitric oxide was protective, indicating a) lack of a complete cycle in KL cells; and b) that nitric oxide is not an essential by-product of this pathway in KL cells (Fig. 1d). KL cells were also not selectively sensitive to silencing ornithine decarboxylase, which initiates conversion of ornithine to polyamines (Extended Data Fig. 4d).
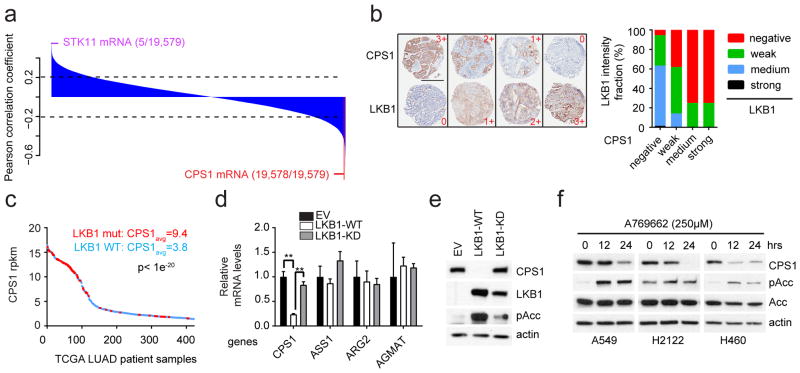
We used orthogonal data from 94 lung cancer cell lines including 14 K, 16 L and 9 KL lines (Supplementary Data Table 7) to examine the relationship between CPS1 and LKB1. Reversed-phase proteomics identified LKB1 as the most negatively correlated to CPS1 mRNA among 176 proteins/phosphoproteins (Extended Data Fig. 4e; Supplementary Data Table 8). Transcriptome analysis covering 19,579 genes ranked CPS1 as the second most anticorrelated mRNA with LKB1 protein (Fig. 2a; Supplementary Data Table 9). A human lung tumor microarray detected CPS1 protein in 18% of samples, and tumors with intense/moderate CPS1 staining expressed little to no LKB1 protein (Fig. 2b; Extended Data Fig. 4f,g). In human lung adenocarcinoma, tumors with abundant CPS1 mRNA were highly enriched for LKB1 loss (Fig. 2c). CPS1 was also expressed in patient-derived NSCLC xenografts, but only in LKB1-deficient tumors (Extended Data Fig. 4h). Abundant CPS1 mRNA correlates with poor prognosis in NSCLC (Extended Data Fig. 4i).
Figure 2. LKB1 negatively regulates CPS1 transcription.
a, Pearson correlations between LKB1 protein and 19,579 transcripts in 94 cell lines. Dashed lines demarcate p=0.05. b, Left, Representative TMA staining for CPS1 and LKB1, indicating negative (0), weak (1+), medium (2+) and strong (3+) staining. Scale bar, 600 μm. Right, LKB1 expression in each CPS1 expression group (total n=180). c, CPS1 mRNA abundance in human lung adenocarcinoma (n=483). LKB1-mutants are red. d, Urea cycle-related enzyme expression in control H460 cells (empty vector, EV, n=3) and cells expressing wildtype (WT, n=3) or kinase-dead (KD, K78I-mutant, n=3) LKB1. e, CPS1, LKB1 and phosphorylated Acetyl-CoA carboxylase (pAcc, S79) abundance upon LKB1 re-expression. f, CPS1, total and phospho-Acc in A549, H2122 and H460 cells treated with the AMPK activator A769662. Statistical significance was assessed using two-tailed Student’s t-test (c); one-way ANOVA followed by Tukey’s multiple comparisons test (d). **p<0.01. TMA was performed once and all other experiments were repeated three times or more.
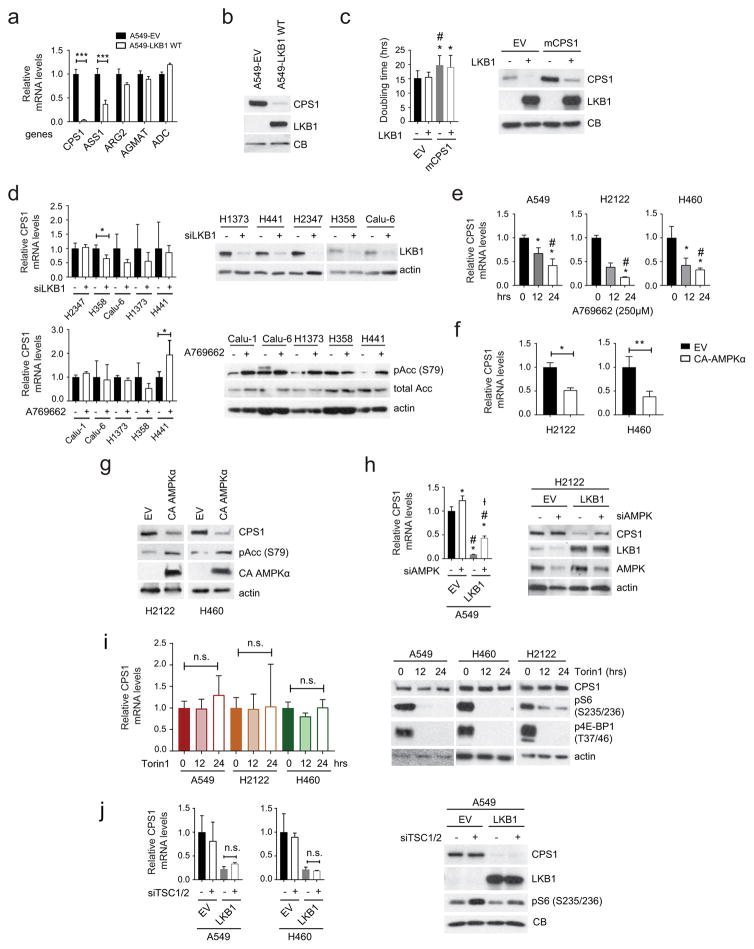
To test whether LKB1 regulates CPS1 expression, we engineered KL cells to express wild type or kinase-dead LKB1 (LKB1-WT or LKB1-KD). LKB1-WT but not LKB1-KD reduced CPS1 expression (Fig. 2d,e; Extended Data Fig. 5a–c), although as recently reported7, neither silencing LKB1 nor activating AMPK in K cells altered CPS1 (Extended Data Fig. 5d). LKB1 executes metabolic effects through the fuel sensor AMPK8,9. In KL cells, pharmacological activation of AMPK or expression of constitutively active AMPK reduced CPS1 mRNA and protein, and silencing AMPK increased CPS1 expression even in the presence of LKB1 (Fig. 2f; Extended Data Fig. 5e–h). Although AMPK inhibits mTOR, neither inhibition nor activation of mTOR impacted CPS1 expression (Extended Data Fig. 5i,j).
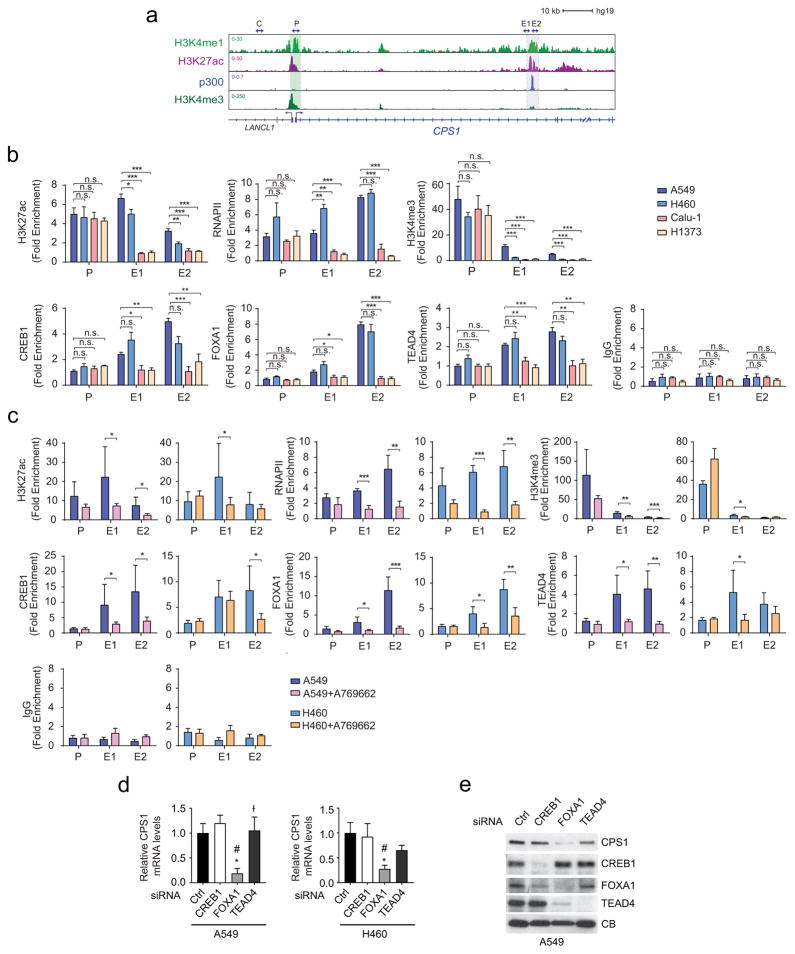
ChIP-Seq data of the CPS1 locus in A549 (KL) cells contained chromatin features consistent with an enhancer element in intron 1 (Extended Data Fig. 6a). ChIP-qPCR revealed markedly increased histone H3K27 acetylation, H3K4 trimethylation and RNA polymerase-II binding at this enhancer in KL compared to K cells, with AMPK activation reducing these signals (Extended Data Fig. 6b,c). FOXA1, CREB1 and TEAD4, three transcription factors repressed by AMPK10–12, also displayed enhanced binding in KL cells, with binding inhibited upon AMPK activation (Extended Data Fig. 6b,c). Silencing FOXA1 reduced CPS1 mRNA and protein (Extended Data Fig. 6d,e).
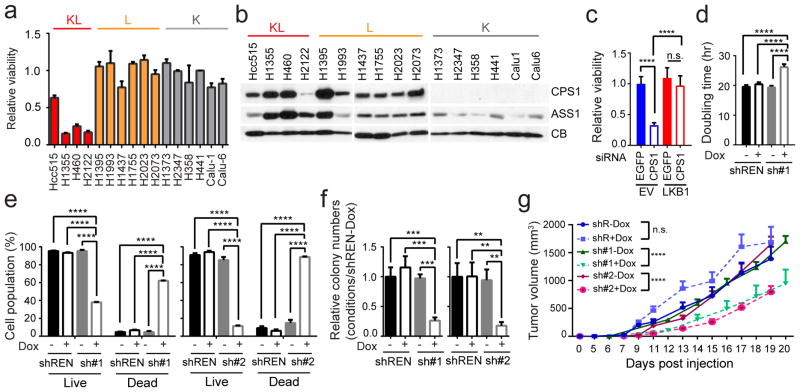
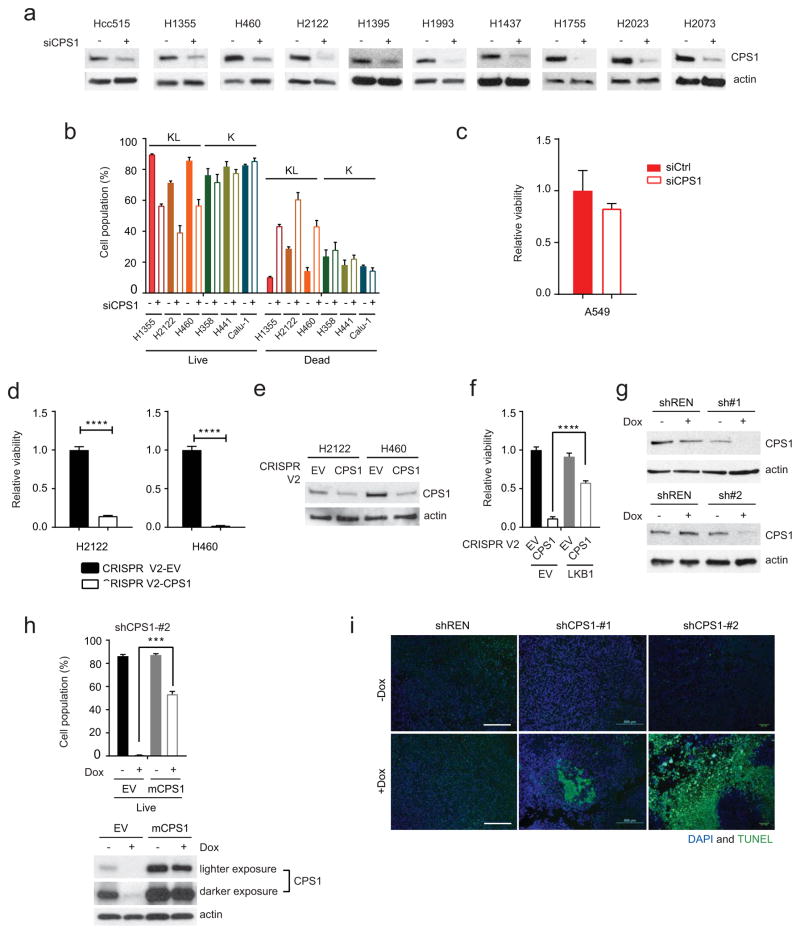
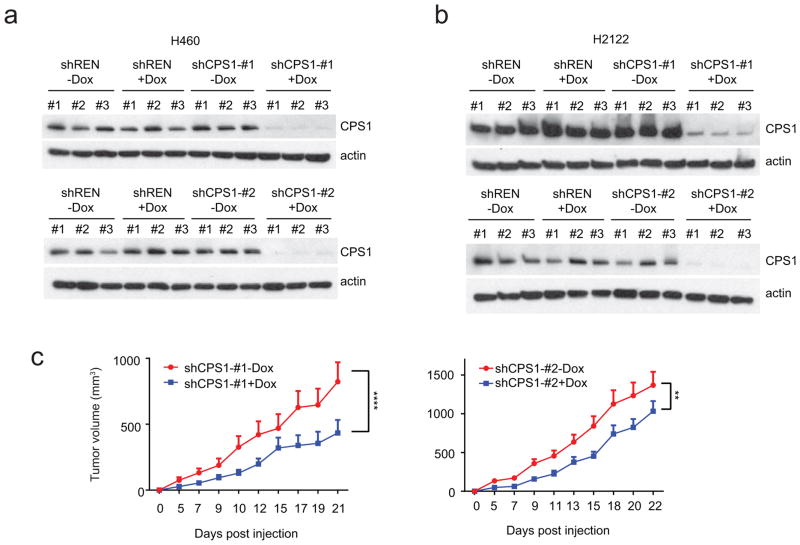
Next, NSCLC cell lines were transfected with CPS1-targeting or control siRNAs. CPS1 silencing reduced viability in KL lines, but other cell lines, including L cells expressing CPS1, tolerated CPS1 silencing (Fig. 3a,b; Extended Data Fig. 7a,b). Among five KL cell lines, only A549 tolerated CPS1 silencing, although even they trended towards reduced viability (Extended Data Fig. 7c). Eliminating CPS1 with CRISPR/Cas9 reduced KL cell viability (Extended Data Fig. 7d,e) and LKB1-WT protected KL cells against CPS1 silencing or knockout (Fig. 3c; Extended Data Fig. 7f). To control the timing of CPS1 silencing, we generated KL cells with doxycycline (Dox)-inducible expression of CPS1 shRNA (shCPS1-#1 and -#2) or renilla luciferase shRNA as a control (shREN) (Extended Data Fig. 7g). In H460 (KL) cells, CPS1 depletion increased the doubling time, induced cell death, and suppressed colony formation in soft agar (Fig. 3d–f). An shRNA-resistant murine CPS1 cDNA protected viability (Extended Data Fig. 7h). Nude mice were injected subcutaneously with H460 cells expressing shREN, shCPS1#1 or #2 and treated with or without Dox. Dox induction of shCPS1 reduced tumor growth and enhanced cell death (Fig. 3g; Extended Data Fig. 7i, 8a). CPS1 silencing also suppressed growth of H2122 (KL) tumors ( Extended Data Fig. 8b,c).
Figure 3. KL cells and tumors require CPS1.
a, Effect of CPS1 silencing on KL, L and K cells (H1373 (n=4); H1437, H1755, H2023, H2073, H358 (n=6); other cell lines (n=3)). b, Abundance of CPS1 and another urea cycle enzyme, ASS1 in cells from Fig. 3a. CB, cyclophilin B (loading control). c, Effect of silencing CPS1 on H460-EV and H460-LKB1-WT cells (n=11). d, Effects of a doxycycline (Dox)-induced CPS1 shRNA (sh#1) on cell proliferation (n=3). shREN is a Dox-inducible control shRNA. e, Live and dead cell percentages 8 days after induction of CPS1-targeting (sh#1, sh#2) or control (shREN) shRNAs (n=3). f, Growth of anchorage-independent colonies 22 days after Dox induction (n=3). g, Growth of subcutaneous H460-derived xenografts in nude mice in presence and absence of Dox (200 mg/kg) introduced 1 day after implantation. Mean tumor volume and SEM are shown for each group (n=10 tumors except for shCPS#2-Dox, where n=8). Data in a, c-f are the average and SD of three or more independent cultures. In c-f, statistical significance was assessed using one-way ANOVA followed by Tukey’s multiple comparisons test. In g, to calculate significance on repeated measurements over time, two-way ANOVA was used. The mouse xenograft experiment was performed twice for shCPS1-#1 (n=5/experiment, total n=10) and once for shCPS1-#2 and shREN (n=10). All other experiments were repeated three times or more. **p<0.01; ***p<0.005; **** p<0.0001.
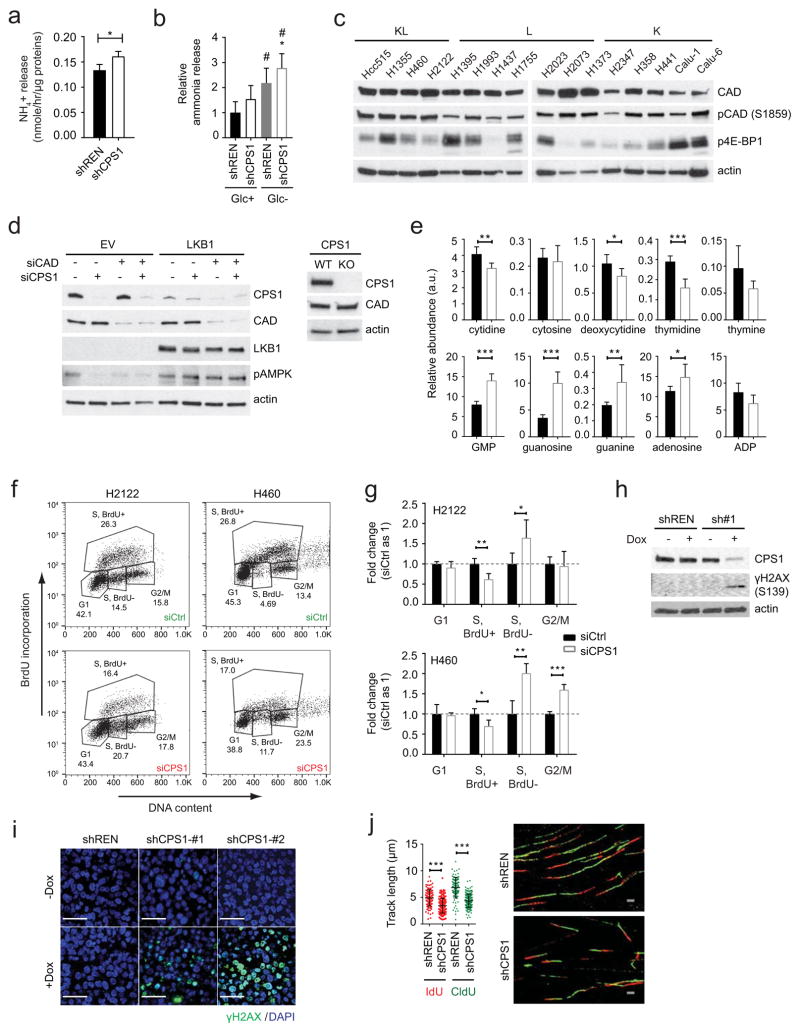
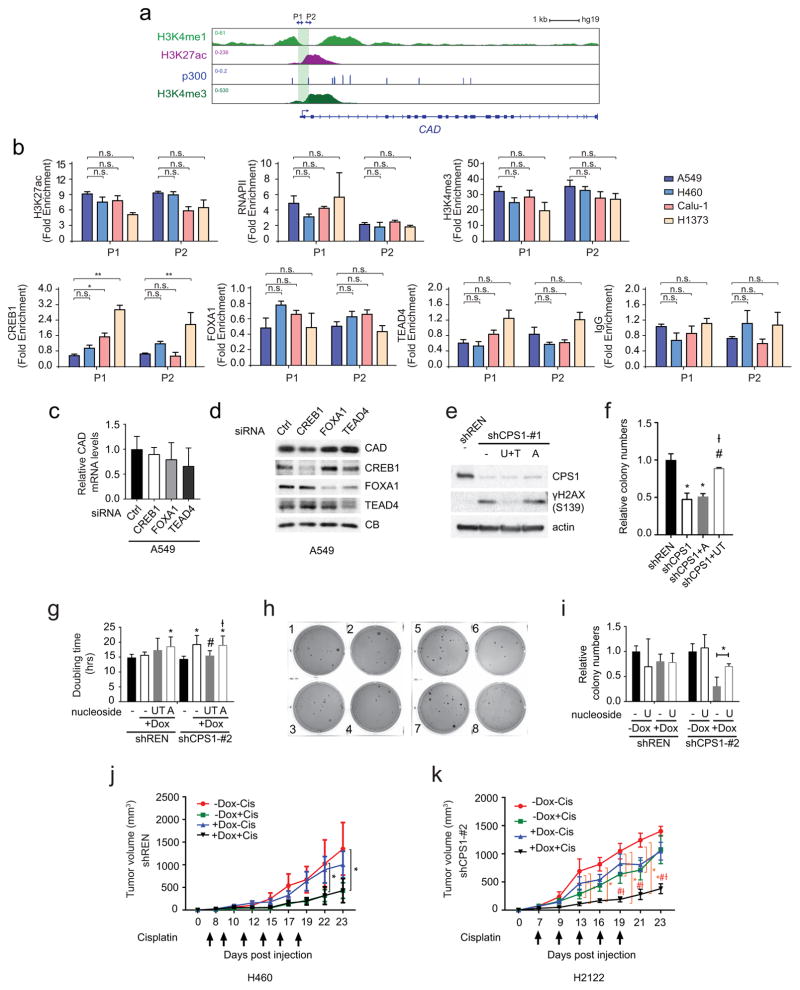
A potential explanation for the reliance of KL cells on CPS1 is a heightened requirement to detoxify ammonia. However, silencing CPS1 only marginally increased ammonia secretion (Extended Data Fig. 9a,b). CP is also the initiating metabolite in pyrimidine synthesis. This pool of CP arises in the cytosol from CPS2, part of the trifunctional CAD enzyme (carbamoyl-phosphate synthetase 2, aspartate transcarbamoylase, and dihydroorotase) catalyzing the first three steps of pyrimidine synthesis13,14. CAD’s enzymatic activity is distinct from CPS1, as it uses glutamine rather than ammonia as the nitrogen source. CAD abundance and activation as reported by S1859 phosphorylation15 were invariant between K and KL cells, and neither CPS1 siRNAs nor CRISPR/Cas9 had off-target effects on CAD ( Extended Data Fig. 9c,d). Analysis of the CAD genomic locus revealed no consistent differences in epigenetic features or FOXA1, CREB1 and TEAD4 binding between K and KL cells, and silencing these transcription factors did not alter CAD expression ( Extended Data Fig. 10a–d). These findings indicate that CPS1 and CAD transcription are regulated through distinct mechanisms.
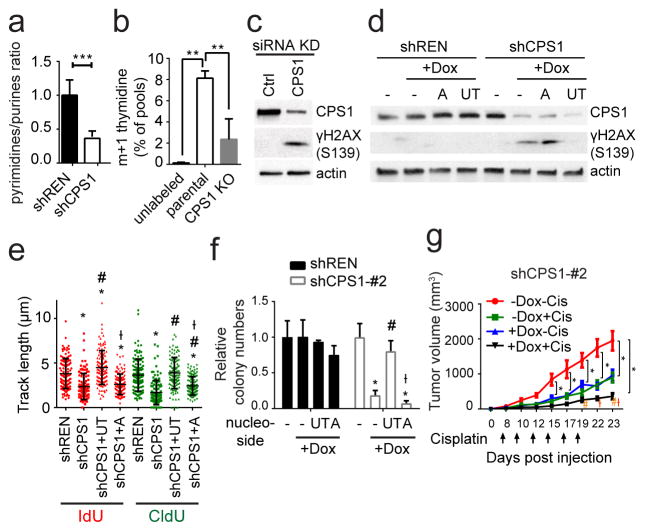
Although mitochondrial and cytosolic CP generally function as distinct pools, germline deficiency of ornithine carbamoyltransferase (OTC) results in systemic pyrimidine accumulation, indicating that mitochondrial CP feeds pyrimidine synthesis under some circumstances16. CPS1 silencing in H460 cells resulted in pyrimidine depletion, purine accumulation and a decreased pyrimidine/purine ratio (Fig. 4a; Extended Data Fig. 9e). Furthermore, incubating cells with 15NH4+ revealed CPS1-dependent transfer of this nitrogen into thymidine, a pyrimidine nucleoside (Fig. 4b). Thus, KL cells use CPS1 to maintain pyrimidine pools.
Figure 4. CPS1 silencing results in pyrimidine depletion, replication fork stalling and DNA damage.
a, Pyrimidine:purine ratio from data in Extended Data Fig. 9e. b, 15N labeling in thymidine in control or CPS1-deficient (CRISPR/Cas9 KO) H460 cells cultured with 15NH4Cl (n=3). c, Abundance of CPS1 and phosphorylated histone H2AX (γH2AX) in H460 cells transfected with control or CPS1-targeting siRNA. d, Effect of supplementing uridine and thymidine (UT) or adenosine (A) on γH2AX abundance in CPS1-silenced H460 cells. e, Effect of UT or A supplementation on DNA fiber lengths in CPS1-silenced cells. At least 112 tracks were measured for each condition. f, Effect of UT or A supplementation on anchorage-independent growth (n=3). g, Growth of H460 shCPS1#2 xenografts in presence and absence of Dox with or without cisplatin. Mean tumor volume and SEM are shown for each group (n=8). For experiments in cell lines, data are average and SD of three independent cultures. Significance was assessed using two-tailed Student’s t-tests (a); one-way ANOVA with Tukey’s multiple comparisons (b,e,f); two-way ANOVA with Tukey’s multiple comparisons test (g). Panel e: *, p<0.05 comparing to shREN; #, p<0.05 comparing to shCPS1; Ɨ, p<0.05 comparing to shCPS1+UT. Panel f: *, p<0.05 comparing to no treatment; #, p<0.05 comparing to +Dox with no nucleoside supplementation, Ɨ; p<0.05 comparing to Dox+UT. Panel g: *, p<0.05 comparing to -Dox-Cis; #, p<0.05 comparing to -Dox+Cis; Ɨ, p<0.05 comparing to +Dox-Cis. All other panels:**p<0.01; ***p<0.005. Nucleotide measurements and DNA fiber assays were performed twice. All other experiments were repeated three times or more.
Because disruption of pyrimidine/purine balance impairs DNA replication17,18, we examined cell cycle distribution during CPS1 silencing. BrdU incorporation and DNA content analysis revealed cellular accumulation in an ineffective S phase (less BrdU incorporation) ( Extended Data Fig. 9f,g). G2/M accumulation also occurred in p53-competent H460 cells but not p53-mutant H2122 cells ( Extended Data Fig. 9g). Prolonged inhibition of DNA replication induces double stranded DNA breaks (DSBs) and cell death19,20, suggesting a mechanism for CPS1 addiction. Indeed, CPS1-silenced cells and xenografts, but not shREN controls demonstrated enhanced histone H2AX phosphorylation (γH2AX S319) (Fig. 4c; Extended Data Fig. 9h,i), indicating that CPS1 is required to prevent DSBs. DSBs associated with altered pyrimidine/purine ratios can result from replication fork stalling21, so we performed DNA fiber assays to monitor progression of individual DNA replication forks in presence and absence of CPS1. Control cells incorporated 5-iodo-2′-deoxyuridine (IdU) and 5-chloro-2′-deoxyuridine (CldU) into long DNA tracks, but CPS1 silenced cells exhibited short tracks, indicating impairment of replication progression (Extended Data Fig. 9j). Supplementing CPS1-silenced cells with pyrimidine nucleosides but not purine nucleosides prevented γH2AX phosphorylation and rescued replication fork stalling (Fig. 4d,e; Extended Data Fig. 10e). Pyrimidines but not purines also normalized proliferation and colony formation in CPS1-silenced cells (Fig. 4f; Extended Data Fig. 10f–i). Finally, cisplatin, a DNA damaging agent and first-line therapeutic in NSCLC, combined with CPS1 silencing to reduce growth of KL tumors (Fig. 4g; Extended Data Fig. 10j,k).
Cancer cells reprogram metabolism to support survival and proliferation, and particular oncogenotypes impose specific vulnerabilities22. Because both KRAS and LKB1 regulate metabolism, co-mutation of the two genes might specify metabolic phenotypes not observed with either mutation alone, perhaps contributing to the aggressive oncological behavior of co-mutant tumors. In mice, co-mutation of KRAS and LKB1 in lung tumors imposes a state of dependence on enzymes involved in conventional pyrimidine biosynthesis3. The surprising requirement of CPS1, a urea cycle enzyme, to maintain purine/pyrimidine balance in human KL cells implies that this enzyme provides an alternative pool of CP to maintain pyrimidine availability. Disrupting this balance by reducing CPS1’s contribution to pyrimidine metabolism severely altered DNA polymerase processivity, resulting in DNA damage and cell death. The fact that L cells with wild type KRAS express but do not require CPS1 suggests that the metabolic effects of oncogenic KRAS are essential for CPS1 addiction. It is interesting that oncogenic KRAS stimulates glutamine catabolism in the mitochondria23, perhaps creating a local supply of ammonia for CPS1 while reducing glutamine availability for CAD-mediated pyrimidine biosynthesis in the cytosol ( Extended Data Fig. 1a). Our findings nominate CPS1 or related pathway components as therapeutic targets in KL mutant lung adenocarcinomas, providing both enrollment biomarkers (KL oncogenotype plus CPS1 expression) and a new mechanism of oncogene addiction.
Methods
Cell lines, Culture, and Reagents
All NSCLC cell lines (A549, H1355, H157, H2122, Hcc515, H460, H1395, H1437, H1755, H1993, H2023, H2073, H1373, H2347, H358, H441, Calu-1, Calu-6) used in this study were obtained from the Hamon Cancer Center Collection (University of Texas–Southwestern Medical Center). Cells were maintained in RPMI-1640 supplemented with penicillin/streptomycin, and 5% fetal bovine serum (FBS) at 37°C in a humidified atmosphere containing 5% CO2 and 95% air. All cell lines have been DNA fingerprinted for provenance using the PowerPlex 1.2 kit (Promega) and were mycoplasma free using the e-Myco kit (Boca Scientific). H460-EV, -LKB1 WT, and -LKB1 KD were generated by infecting cells with pBABE retroviral vectors expressing no cDNA or cDNAs encoding wild type or kinase-dead (K78I mutant) LKB1, respectively. pBABE-FLAG-LKB1 WT and KD were from Lewis Cantley (Addgene plasmid #8592 and #8593, respectively) and pAMPK alpha2 delta312X (constitutively active AMPK) was from Morris Birnbaum (Addgene plasmid #60127). For murine CPS1 (mCPS1) cloning, mCPS1 cDNA was purchased from GE healthcare (cloneID: 40098767), and subcloned into pWPXL lentiviral plasmid (Addgene, plasmid #12257). Stable integrants were sorted by flow cytometry (FACS Aria II SORP) for further analyses. To generate H460-shREN and –shCPS1 cells, parental H460 cells were infected by TRMPVIR retroviral vectors expressing Tet-shRNA targeting renilla luciferase (REN) as negative control or Tet-shRNAs targeting CPS1, and stable integrants were obtained by flow cytometry (FACS Aria II SORP). The primers used to generate shCPS1 constructs were as follows:
shCPS1-#1 forward, 5-TGCTGTTGACAGTGAGCGCAACCAAGGATGTCAAAGTGTATAGTGAAGCCACA-3,
shCPS1-#2 forward, 5-TGCTGTTGACAGTGAGCGCACCAAGGATGTCAAAGTGTACTAGTGAAGCCACA-3.
All nucleosides (uridine, thymidine, and adenosine), citrulline, ornithine, and NaNO2 were purchased from Sigma Aldrich. Doxycycline was from Research Products International (RPI), Torin 1 and cisplatin were from Selleckchem, and A769662 was from Tocris Bioscience.
Metabolomics
NSCLC cell lines were plated at 3–5 × 10⁶ cells per 10 cm plate for 16 hr prior to harvest. Two hours before harvest, cells were incubated with fresh media. At the time of harvest, cells were washed with ice-cold saline, lysed with 80% methanol in water and quickly scraped into an Eppendorf tube followed by three freeze–thaw cycles in liquid nitrogen. The insoluble material was pelleted in a cooled centrifuge (4°C) and the supernatant was transferred to a new tube and evaporated to dryness using a SpeedVac concentrator (Thermo Savant). Metabolites were reconstituted in 100 μl of 0.03% formic acid in LCMS-grade water, vortex-mixed, and centrifuged to remove debris. For human NSCLC metabolomics, frozen tissues were weighed and divided into 3–9 fragments (~3mg/each fragment) for technical replicates. Fragments were homogenized in 80% methanol in water and centrifuged at 14,000g for 15 minutes (4°C). The supernatant was transferred to a new tube and evaporated to dryness as described above for cell lysates. Samples were randomized and blinded prior to analyzing by LC/MS/MS. LC/MS/MS and data acquisition were performed using an AB QTRAP 5500 liquid chromatograph/triple quadrupole mass spectrometer (Applied Biosystems SCIEX, Foster City, CA) as described previously24 with injection volume of 20 μL. Carbamoyl phosphate was detected in negative mode by monitoring ions 140 and 79 in Q1 and Q3, respectively. Chromatogram review and peak area integration were performed using MultiQuant software version 2.1 (Applied Biosystems SCIEX, Foster City, CA), and the peak area for each detected metabolite was normalized against the total ion count (TIC) of that sample to correct any variations introduced from sample handling through instrument analysis. The normalized areas were used as variables for the multivariate and univariate statistical data analysis. All multivariate analyses and modeling on the normalized data were carried out using Metaboanalyst 3.0 (http://www.metaboanalyst.ca). Univariate statistical differences of the metabolites between two groups were analyzed using two-tailed Student’s t-test.
15NH4 labeling
Cells were plated at 24 × 106 cells per 2 × 15cm plate for 16 hr prior to labeling. The next day, cells were incubated in labeling media containing 10 mM 15NH4Cl for 4 hr before harvest. At the time of harvest, the cells were washed with ice-cold saline, lysed with 40% methanol:40% acetonitrile:20% water with 0.1M formic acid and processed as described above (Metabolomics). Metabolites were reconstituted in 100 μl of 0.1% formic acid in LCMS-grade water, vortex-mixed, and centrifuged to remove debris. Samples were randomized and blinded prior to analyzing by LC/MS/MS. LC/MS/MS and data acquisition were performed as described previously on an AB SCIEX QTRAP 550024 with slight modifications. Briefly, the mobile phases employed were 0.1% formic acid in water (A) and 0.1% formic acid in acetonitrile (B). The gradient program was as follows: 0–3 min, 0% B; 3–4 min, 0% – 100% B; 4–5 min, 100% B; 5–5.1 min, 100% – 0% B; 5.1–6 min, 0% B. The column was maintained at 35°C and the samples kept in the autosampler at 4°C. The flow rate was 0.5 mL/min, and injection volume 20 μL. Sample analysis was performed in positive mode. Declustering potential (DP), collision energy (CE) and Collision Cell Exit Potential (CXP) were optimized by direct infusion of reference standards using a syringe pump prior to sample analysis. Q1, Q3, DP, CE, CXP, retention time and dwell time for each transition of thymidine are in Supplementary Information Table 10. The MRM MS/MS detector conditions were set as follows: curtain gas 30 psi; ion spray voltages 1200 V; temperature 650°C; ion source gas 1, 50 psi; ion source gas 2, 50 psi; interface heater on; entrance potential 10 V. Dwell time for each transition was set at 3 msec. Samples were analyzed in a randomized order, and MRM data was acquired using Analyst 1.6.1 software (Applied Biosystems SCIEX, Foster City, CA).
Metabolic Assays
To measure NOS activity, 10K cells were cultured in a 96-well plate for 16 hr prior to the assay, and free NO was quantified with a spectrophotometric assay (Sigma). For ammonia secretion, cells were cultured in fresh RPMI for 6 hr and ammonia was measured with a spectrophotometric assay (Megazyme). In this assay, glucose deprivation induces ammonia secretion and was used as a positive control for the effect of CPS1 silencing on ammonia secretion in Extended Data Figs. 8a,b25). For arginine deprivation and metabolite rescue experiments (citrulline, ornithine, and NaNO2), NSCLC cells were plated in 96-well plates at 3–5K cells per well. The following day, the culture medium was changed either to complete RPMI or arginine-depleted RPMI with or without 1 mM citrulline, 1 mM ornithine or 3 mM NaNO2. Cell viability was assayed 3 days later using CellTiter-Glo (CTG, Promega).
Cell growth, Cell death, and Viability
To monitor proliferation in monolayer culture, 1–3 X 10⁵ cells were seeded in a 6 cm dish. Every 3 days, cells were trypsinized and counted with a hemacytometer. The live cell content was estimated using CellTiter-Glo assay (CTG, Promega). To examine cell death, cells were treated as indicated in the Figure Legend and stained with propodium iodide (PI) or with Annexin V-FITC and PI. Cells were then analyzed by flow cytometry (FACS Aria II SORP).
Soft-Agar Colony Formation Assay
Four days after Dox induction, cells (1,000/well) were suspended in 0.375% agar (Noble agar, Difco) pre-equilibrated with growth medium, over a 0.75% bottom agar layer in each well of a 6-well plate. Colonies were allowed to form for 20–22 days with intermittent medium supplementation (a few drops twice a week). Images were acquired with G box-Syngene (Syngene) and colonies were detected with GeneTools software (Syngene).
BrdU Incorporation Assay
Cells were labeled with BrdU labelling (10 μM) for 1hr followed by fixation. Incorporated BrdU was detected by immunostaining and quantified by FACS analysis.
DNA Fiber Assay
Cells were labeled with 100 μM iododeoxyuridine (IdU) for 10 min, then with 100 μM chlorodeoxyuridine (CldU) for 20 min. DNA fibers were spread as described previously26 and stained with primary antibodies (mouse anti-BrdU/IdU from BD Bioscience; rat anti-BrdU/CldU from Accurate Chemical) and fluorescence-conjugated secondary antibodies (Alexa Fluor 488-anti-rat and Texas Red-conjugated anti-mouse from Invitrogen). Fibers were imaged using Zeiss Axio Imager M2 and measured using AxioVision software (SE64 version 4.9.1).
q-RT-PCR
RNA was extracted in TRIzol (Invitrogen) and isolated according to manufacturer’s protocol. cDNA was generated using the iScript synthesis kit (Bio-Rad), and abundance was measured on a Thermo qPCR instrument. Data were normalized by actin or GAPDH. Primers used for q-RT-PCR were as follows: CPS1 forward, 5-ATTCCTTGGTGTGGCTGAAC-3, reverse, 5-ATGGAAGAGAGGCTGGGATT-3, ARG2 forward, 5-GAGAAGCTGGCTTGATGAAA-3, reverse, 5-CAGCTCTGCTAACCACCTCA-3, ASS1 forward, 5-CTGATGGAGTACGCAAAGCA-3, reverse, 5-CTCGAGAATGTCAGGGGTGT-3, ADC forward, 5-CCTCAGGCCTATGCTCAGTC-3, reverse, 5-CTGAGTTGATCACGGAAGCA-3, AGMAT forward, 5-CGACCTTGGATCCCTACAGA-3, reverse, 5-ACCAGCAATTTCAGGTGTCC-3, CAD forward, 5-TCAAGGTGACCCAGCACCTG-3, reverse, 5-TCAGGCAAAGGGATGCCCAA-3, Actin forward, 5-AGAGCTACGAGCTGCCTGAC-3, reverse, 5-AGCACTGTGTTGGCGTACAG-3, GAPDH forward, 5-ACCCAGAAGACTGTGGATGG-3, reverse, 5-TTCAGCTCAGGGATGACCTT-3.
RNAi
Transient gene-silencing experiments were performed with endoribonuclease-prepared siRNAs (esiRNA, Sigma) for CPS1 and CAD, and with ON-TARGETplus-SMART pools (Dharmacon) for LKB1, CREB1, FOXA1, TEAD4, ODC, TSC-1 and -2, AMPKα-1 and -2. Briefly, siRNA oligos were transfected into cells with RNAi max transfection reagent (Invitrogen); esiRNA oligos targeting EGFP or siRNA Universal Negative Controls were used as a negative control (Sigma). For Extended Data Fig. 6e and 10d, triple transfection was performed (every other day, repeated three times) and western blots were assayed 144 hr after the first transfection. Viability assays were performed after 96 hr and cell death analyses and all other western blots were performed after 48 hr. BrdU incorporation was measured after 24 hr in H460 cells and after 36 hr in H2122 cells. For inducible RNAi experiments, shREN and shCPS1#1 and #2 were induced using doxycycline concentrations of 1.0–2.0 mg/ml.
Chromatin Immunoprecipitation (ChIP)-qPCR
ChIP experiments were performed as described27 with modifications. Briefly, 1~2 × 10⁷ cells were crosslinked with 1% formaldehyde for 5 min at room temperature. Chromatin was sonicated to around 500 bp in RIPA buffer (10 mM Tris-HCl, 1 mM EDTA, 0.1% sodium deoxycholate, 0.1% SDS, 1% Triton X-100, 0.25% sarkosyl, pH 8.0) with 0.3 M NaCl. Sonicated chromatin samples were incubated with 5μg antibody at 4°C. After overnight incubation, protein A or G Dynabeads (Invitrogen) were added to the ChIP reactions and incubated for four additional hours at 4°C to collect the immunoprecipitated chromatin. Subsequently, Dynabeads were washed twice with 1 ml of RIPA buffer, twice with 1 ml of RIPA buffer with 0.3 M NaCl, twice with 1 ml of LiCl buffer (10 mM Tris-HCl, 1 mM EDTA, 0.5% sodium deoxycholate, 0.5% NP-40, 250 mM LiCl, pH 8.0), and twice with 1 ml of TE buffer (10 mM Tris-HCl, 1 mM EDTA, pH 8.0). The chromatin was eluted in SDS elution buffer (1% SDS, 10 mM EDTA, 50 mM Tris-HCl, pH 8.0) followed by reverse crosslinking at 65°C overnight. ChIP DNA were treated with RNaseA (5 μg/ml) and protease K (0.2 mg/ml), and purified using QIAquick Spin Columns (Qiagen). The purified ChIP DNA was quantified by real-time PCR using the iQ SYBR Green Supermix (Bio-Rad). The following antibodies were used: H3K27ac (ab4729), H3K4me3 (Millipore, 04-745,), RNAPII (Santa Cruz Biotechnology, sc-899), FOXA1 (ab23738), TEAD4 (ab58310), CREB1 (Santa Cruz Biotechnology, sc-186) and IgG (Millipore, 12-370). Other ChIP-seq datasets were obtained from previous publications or the ENCODE project. Primers used for CPS1 qPCR were as follows: Control (C) forward, 5-AAACCCACGTCCAGCACAGTGTC-3, reverse, 5-AATAGCGGGTAAGGATGTAGACAGG-3, promoter (P) forward, 5-TTAACCCACCCGGACAAAGAGG-3, reverse,5-AATAGCCCTTCTGTTACTGTCC-3, enhancer1 (E1) forward, 5-CCTGCCCTATGACTCAACTTAC-3, reverse, 5-GGAAATCGGAAATAGGACCCGTGC-3, enhancer2 (E2) forward, 5-CCACATGCTTCTCTGTGATCCTC-3, reverse, 5-ATTCTAAAGAGCAACCCTAGCTG-3. Primers used for CAD qPCR were as follows: promoter1 (P1) forward, 5-TCCTTCCCGCTTCTCCGTACTCG-3, reverse, 5-CACAGAGTGGGATAAGGTCTGC-3, promoter2 (P2) forward, 5-AGCCCAGCCCTGCTTCTTTCTTGC-3, reverse, 5-GGGATGCCATAGTTGCCGATCAGAG-3.
CRISPR/Cas9-mediated recombination
CPS1-deficient H460 clones for isotope tracing were generated using the original CRISPR/Cas9 system28, and pools for cell viability assays were generated using the lentiCRISPR V2 system29. In order to control for variations among individual clones in the tracing experiments, 4 to 5 clones were pooled together. Guide RNA oligos were as follows:
Forward 5-CACCG ACAATGGCCAACCCTATTAT-3, Reverse 5-AAACATAATAGGGTTGGCCATTGTC-3
Western Blot Analysis
Protein lysates were prepared in either RIPA or CHAPS buffer and quantified using the BCA Protein Assay (Thermo Scientific). Protein was separated on 4%–20% SDS-PAGE gels, transferred to PVDF membranes, and probed with antibodies against CPS1 (ab3682), β-actin (ab8227), ASS1 (clone 2B10, ab124465), cyclophilin B (clone EPR12703(B), ab178397), total AMPK (Cell Signaling, #2603), phospho-AMPK (Cell signaling, #2531), total ACC (Cell Signaling, #3662), phospho-ACC (Cell Signaling, #11818), LKB1 (Cell Signaling, #3050), γH2AX (Cell Signaling, #9718), total CAD (Cell Signaling, #11933), phospho-CAD (Cell Signaling, #12662), NOS3 (BD, 610298), phospho-S6 (Cell Signaling, #2211), phospho-4E-BP1 (Cell Signaling, #2855), CREB1 (Santa Cruz, sc-186X), FOXA1 (ab23738), TEAD4 (ab58310).
Xenografts
Animal procedures were performed with the approval of the UT Southwestern IACUC. Tumor size must not exceed 20mm at the largest diameter and this tumor threshold was never exceeded in any experiment. H460 shREN or shCPS1-#1 and #2 cells were suspended in RPMI (107/ml), mixed 1:1 with Matrigel (Becton Dickinson), and 105 cells for H460 and 106 cells for H2122 were implanted subcutaneously into 6-week-old NCRNU mice. After tumor cell injection, mice were randomized and then allocated into cages. Mice were fed regular chow or Doxycycline-containing chow (200mg/kg, Bio-Serv), starting 1 day after implantation. For cisplatin treatment, tumor-bearing mice were intraperitoneally injected with cisplatin at 2mg/kg or PBS when the xenografted tumors measured ~100mm3. Injections were performed every other day for a total of 5 to 6 doses. Tumor size was measured every other day with electronic calipers. Tumor volumes were calculated every 3 to 4 days by caliper measurements of the short (a) and long (b) tumor diameters (volume = a2×b/2) or of tumor height (h), short (a) and long (b) tumor width (volume=h×a×b/2) depending on tumor shape.
Tissue γH2AX Staining
Paraffin-embedded tumor sections from mouse xenografts were deparaffinized with xylene followed by ethanol rehydration, fixed in 4% paraformaldehyde, and antigen-retrieved with 10 mM sodium citrate pH 6.0. Sections were then subjected to endogenous peroxidase blocking with 0.3% H2O2. Bovine serum albumin (BSA, 3%) in 0.1% PBST was used as the blocking agent and antibody dilution solution. After 1 hr blocking, samples were incubated overnight at 4°C with the primary antibody (Cell Signaling, #9718) followed by incubation with fluorescence-conjugated secondary antibodies (ThermoFisher Scientific, A-21206). Images were acquired as a series of 0.4 μm stacks with a DeltaVision system (Applied Precision). Raw images were deconvolved using the iterative algorithm implemented in the softWoRx software (Applied precision).
TUNEL Assay
Cell death was detected in xenografts using the In Situ Cell Death Detection Kit, Fluorescein (Sigma) according to manufacturer’s protocol. Briefly, tissue sections were deparaffinized with xylene and rehydrated with ethanol, then treated with proteinase K (5 μg/ml, New England Biolabs). After washing in PBS, sections were incubated with reaction solution for 1 hr at 37°C in a humidified atmosphere in the dark. Images were acquired with an Olympus IX81 microscope.
Human Lung Cancer Tissue Microarray
A tissue microarray with 180 human NSCLC samples (MD Anderson Cancer Center) was probed with antibodies against CPS1 (Sigma, #HPA021400) and LKB1 (Cell Signaling, #13752). Immunocytochemistry (IHC) was performed in a Leica Bond Max (Leica Biosystem) with an antibody dilution at 1:800 for CPS1 and 1:250 for LKB1. Liver tissue was used as a control. Staining intensity was graded as: 0 (no staining); 1+ (weak staining); 2+ (moderate staining); and 3+ (intense staining) by one pathologist, then reviewed by a second pathologist independently. The percentage of stained tumor cells was recorded, and the H-score was assigned using the following formula: [1 × (% cells 1+) + 2 × (% cells 2+) + 3 × (% cells 3+)]. A final H-score of 0 was assigned as negative; 1–100 as weak; 101–200 as medium; and 201–300+ as strong.
Patient Survival Data
Differences in survival based on either LKB1 mutation or CPS1 mRNA expression was determined in lung adenocarcinoma tumors from The Cancer Genome Atlas (TCGA) (TCGA LUAD provisional). The analysis was restricted to the 230 tumors that had undergone both whole exome sequencing and mRNA profiling. Methods for data generation, normalization, and bioinformatics analyses were previously described in the TCGA LUAD publication30. For the present analysis, data from this cohort was downloaded and analyzed using cBioPortal (www.cbioportal.org). mRNA data used for this analysis was RNA Seq V2 RSEM with a z-score threshold of 2.0 applied to identify tumors with high levels of CPS1 upregulation.
Statistical Analysis
No statistical methods were used to predetermine sample size. Metabolomics and flux analysis samples were randomized prior to LC/MS/MS analysis. For xenograft experiments, mice injected with tumor cells were randomized prior to being allocated to cages. All other experiments were not randomized, and the investigators were not blinded to allocation during experiments or to outcome assessment. Experiments in Figs. 1a, 2b, 3g with shREN and shCPS1-#2, Extended Data Figs. 1c, 2, 7i, 8c, 9i, and 10j,k were performed once, and Experiments in Figs. 1d, 3g with shCPS1-#1, 4e, 4g with shCPS1-#2, Extended Data Figs. 6b, 7f, 9e, 9j, 10b were performed twice. All other experiments were performed three times or more. Variation for xenograft tumor volume is indicated using standard error of the mean, and variation in all other experiments is indicated using standard deviation. To assess the significance of differences between two conditions, a two-tailed Welch’s unequal variances t-test was used. Where the data points showed skewed distribution (e.g. Extended Data Fig. 1c), Wilcoxon signed rank test was performed. For comparisons among three or more groups, a one-way ANOVA followed by Tukey’s multiple comparisons test was performed. To examine significance in xenograft tumor growth between two or among three or more groups, two-way ANOVA followed by Tukey’s multiple comparisons test was performed. Before applying ANOVA, we first tested whether there was homogeneity of variation among the groups (as required for ANOVA) using the Brown–Forsythe test. In all xenograft assays, we injected 6–7 week old NCRNU mice (both male and female) 10 mice per treatment (except Fig 10j,k: n=4/group), as we expected based on previous pilot experiments to observe differences in tumor size after 2 weeks. When mice died before the end of experiments, data from those mice were excluded (Fig. 3g for shCPS1-#2-Dox).
Data Availability Statement
All primary data are included in the supplement accompanying this article. Any additional information required to interpret, replicate, or build upon the methods or findings reported in the article are available upon request.
Extended Data
Extended Data Fig. 1. Altered urea cycle metabolism in KL cells.
a, Illustration of the urea and TCA cycle. Metabolic alterations mediated by concurrent mutations of KRAS and LKB1 render cells dependent on CPS1 for pyrimidine synthesis. Generally, mitochondrial and cytosolic CP are thought to follow distinct metabolic routes in the urea cycle and pyrimidine biosynthesis, respectively. In KL cells, however, CPS1 supports nucleotide homeostasis by providing an alternative supply of CP for de novo pyrimidine synthesis. Dependence on CPS1 is exacerbated by mutant KRAS, perhaps because of the effects of this oncogene on the metabolism of glutamine and other nutrients in the mitochondria. b, Distribution of mRNA abundance of urea cycle-related enzymes in 203 cell lines. Statistical significance was assessed using two-tailed Student’s t-test. Abundance data are in Supplementary Information Table 6. c, Abundance of urea cycle intermediates in the same cell lines used in Fig. 1a. Individual data points are shown with mean values and SD for three (CP) or four (all others) independent cultures. Statistical significance for citrulline and carbamoyl phosphate was assessed using Wilcoxon signed rank test. Other data were assessed using two-tailed Student’s t-tests. *p<0.05; ***p<0.005; **** p<0.0001.
Extended Data Figure 2. Metabolomic profiling of KL and K cancer cells and human NSCLC.
Left, Relative abundance of metabolites extracted from five KL (H157, A549, H460, H2122, H1355) and five K cell lines (Calu-1, Calu-6, H1373, H358, H441). Peak areas of each metabolite were normalized by total ion count (TIC) and the heat map displays the average value for each metabolite; n=4 independent cultures for each cell line. The color reflects a log2 scale. Right, Relative abundance of metabolites extracted from four KL human tumors (Tumors 5, 8, 9 and 11-KL) and seven K human tumors (Tumors 1, 2, 3, 4, 6, 7 and 10-K). Peak areas of each metabolite were normalized by total ion count (TIC) followed by mean normalization and the heat map displays the average value for each metabolite; n=3 independent fragments for each tumor except Tumor 2-K (n=6), Tumor 8-KL (n=6) and Tumor 1-K (n=9). The color reflects a log2 scale.
Extended Data Fig. 3. Metabolites differentiating between KL and K human NSCLC.
Metabolites differentiating K from KL human tumors have variable importance in the projection (VIP) scores >1.0. Metabolites related to nitrogen metabolism are highlighted in red. The relative abundance of each metabolite is shown in the color bar, where red indicates elevated and green indicates reduced abundance. * indicates metabolites that also discriminated between K and KL cell lines in Fig. 1a and Supplemental Data Table 2, and ^ indicates metabolites closely related to those discriminating between K and KL cell lines in Fig. 1a (e.g. hypoxanthine and xanthine in the tumors are related to xanthosine in the cell lines).
Extended Data Fig. 4. Nitrogen-related metabolic pathways in K and KL cells, and anticorrelation between CPS1 and LKB1.
a, Abundance of NOS3 protein in a panel of K and KL cell lines. b, Distribution of mRNA abundance for NOS1 and NOS2 among 203 cell lines. Complete data sets including quantitative mRNA abundance of these genes are available in Supplementary Information Table 6. c, NOS activity in K and KL cells. Free nitric oxide (NO) was monitored in three cell lines of each genotype. Data are the average and SD of three independent cultures. d, Effect of silencing ornithine decarboxylase (ODC), an enzyme involved in polyamine synthesis from ornithine, in K and KL cells. Cell growth was measured by DNA content using a Perkin Elmer Victor X3 plate reader. Data are the average and SD of six independent cultures. e, Pearson correlation coefficients between CPS1 mRNA and 176 proteins in 94 lung cancer cell lines. Rank of LKB1 protein is indicated. Dashed lines demarcate correlation coefficients at nominal p=0.05. f, Scoring of LKB1 and CPS1 expression in TMA samples. In this analysis, tumors were considered positive if any CPS1 or LKB1 staining was detected (i.e. H-score greater than or equal to 1, as described in Methods); otherwise staining was considered negative. g, CPS1 protein expression in TMA tumor samples of different clinical stages. h, Abundance of CPS1 and LKB1 protein in patient-derived NSCLC xenografts (PDXes). All PDXes had oncogenic KRAS mutations. i, Kaplan-Meier plot associating CPS1 expression with reduced survival. In the TCGA lung adenocarcinoma cohort (TCGA LUAD provisional, n=230), LKB1 mutation or loss was observed in 19% of patient tumors (n=43). For CPS1, a z-score threshold of 2.0 was used to identify tumors with high levels of expression; this included 5.2% (n=12) tumors. There was no difference in overall survival in patients with LKB1 alterations (deletion or mutation) versus those without an LKB1 alteration (p=0.88). In contrast, patients whose tumors had high levels of CPS1 mRNA had much shorter periods of overall survival compared to other patients (15.2 vs. 45.3 months, p<0.0001). The western blot and NOS activity assay were performed twice, and ODC silencing experiment was repeated three times or more. Statistical significance was assessed using two-tailed Student’s t-test. n.s., not significant.
Extended Data Fig. 5. LKB1 suppresses CPS1 expression via AMPK.
a, Expression of urea cycle and related enzymes in control A549 cells (empty vector, EV) and cells expressing wild-type (WT) LKB1. Data are the average and SD of three independent cultures. Statistical significance was assessed using two-tailed Student’s t-tests. ***p<0.005. b, Abundance of CPS1 and LKB1 protein in A549 cells transfected with an empty vector (EV) or wild type LKB1 (LKB1 WT). CB was used as a loading control. c, Left, Effect of expressing wild-type LKB1 or murine CPS1 (mCPS1), alone or together, on H460 cell proliferation. EV is empty vector control. Data are the average and SD of six or more independent cultures. Right, Abundance of CPS1 and LKB1 protein in H460 cells stably expressing empty vector (EV) or mCPS1. d, Top, Effects of LKB1 silencing on CPS1 mRNA expression in cells with oncogenic KRAS and wild-type LKB1 (K cells). Data are the average and SD of three or more independent cultures. Western blot shows the abundance of LKB1 protein in cells transfected with control siRNA or siRNA targeting LKB1 (siLKB1). Bottom, Effects of the AMPK activator A769662 on CPS1 mRNA expression in K cells. Data are the average and SD of three or more independent cultures. Western blot shows the abundance of total and phosphorylated Acetyl-CoA carboxylase (pAcc, S79) in cells treated with DMSO or A769662 (250μM). e, Effects of A769662-mediated AMPK activation on CPS1 mRNA expression in KL cells. Data are the average and SD of three or more independent cultures. f, Effects of constitutively active AMPK on CPS1 mRNA expression in H2122 and H460 cells. Data are the average and SD of three or more independent cultures. g, Abundance of CPS1, pAcc and constitutively active AMPKα in H2122 and H460 cells transfected with an empty vector (EV) or CA AMPKα. Actin was used as a loading control. h, Left, Effects of AMPK silencing on CPS1 mRNA expression in A549 cells without (EV) or expressing wild type LKB1. Data are the average and SD of three independent cultures. Right, Abundance of CPS1, LKB1, AMPK proteins in A549 cells transfected with control siRNA or siRNA targeting AMPK (siAMPK). Actin was used as a loading control. i, Left, Effects of the mTOR inhibitor Torin 1 on CPS1 mRNA expression in KL cells. Data are the average and SD of four or more independent cultures. Right, Abundance of CPS1, phosphorylated S6-ribosomal protein (pS6) and phosphorylated 4E-BP1 (p4E-BP1) in KL cells. Actin was used as a loading control. j, Left, Effects of TSC1 and 2 silencing on CPS1 mRNA expression in A549 and H460 cells. Data are the average and SD of three independent cultures. Right, Abundance of CPS1, LKB1, and phospho-S6 in A549 cells. CB was used as a loading control. In a,d,f,j, statistical significance was assessed using two-tailed Student’s t-tests. n.s. not significant, *p<0.05, **p<0.01, ***p<0.005. In c,e,h,i, statistical significance was assessed using one-way ANOVA followed by Tukey’s multiple comparisons test. Panel c:*, p<0.05 comparing to EV-EV;#, p<0.05 comparing to EV-LKB1. Panel e:*, p<0.05 comparing to no treatment;#, p<0.05 comparing to 12 hr A769662 treatment. Panel h;*, p<0.05 comparing to EV-control siRNA;#, p<0.05 comparing to EV-siAMPK;Ɨ, p<0.05 comparing to LKB1-control siRNA. All experiments were repeated three times or more.
Extended Data Fig. 6. LKB1 regulates CPS1 transcription via AMPK-mediated effects.
a, Chromatin signatures at the CPS1 locus in A549 cells. Promoter and enhancer sequences are shaded. Arrowheads indicate amplicons for control (C), promoter (P) and enhancer (E1, E2) regions for ChIP-qPCR in b and c. b, Chromatin occupancy of H3K27ac, RNAPII, H3K4me3, CREB1, FOXA1, TEAD4 and IgG (negative control) in KL (A459, H460) and in K (Calu-1, H1373) cells. Data are the average and SD of two independent cultures, each with two technical replicates (total n=4). c, Chromatin occupancy of H3K27ac, RNAPII, H3K4me3, CREB1, FOXA1, TEAD4 and IgG in A549 and H460 cells treated with DMSO or 250μM A769662. Data are the average and SD of three independent cultures, each with two technical replicates (total n=6). d, Effects of CREB1, FOXA1, and TEAD4 silencing on CPS1 mRNA expression in A549 and H460 cells. Data are the average and SD of three or more replicates. e, Abundance of CPS1, CREB1, FOXA1, and TEAD4 in A549 cells. CB was used as a loading control. In b and c, statistical significance was assessed using two-tailed Student’s t-test. *p < 0.05, **p < 0.01, ***p< 0.001, n.s. not significant. In d, statistical significance was assessed using one-way ANOVA followed by Tukey’s multiple comparisons test. *, p<0.05 comparing to control siRNA; #, p<0.05 comparing to siCREB1; Ɨ, p<0.05 comparing to siFOXA1. ChIP-qPCR in b was performed twice. All other experiments were repeated three times or more.
Extended Data Fig. 7. CPS1 addiction in a subset of NSCLC cell lines.
a, Abundance of CPS1 protein in cell lines transfected with a control esiRNA or esiRNA directed against CPS1. b, Effect of CPS1 silencing on cell death in K and KL cells. Data are the average and SD of three independent cultures. c, Effect of CPS1 silencing on A549 cell viability. Data are the average and SD of six independent cultures. d, Effect of lentiCRISPR/Cas9-mediated knockout of CPS1 on viability in H2122 and H460 cells. Cell TiterGlo assays were performed on pools of CPS1 KO cells without first isolating clones. Data are the average and SD of six independent cultures. e, Abundance of CPS1 protein in H2122 and H460 control cells (EV) and a pool of cells infected with lentiviral CRISPR V2-CPS1 (CPS1). Actin was used as a loading control. f, Effect of knocking out CPS1 on H460-EV and H460-LKB1-WT cells (n=6). g, Abundance of CPS1 in H460 cells expressing shCPS1-#1 (top) and shCPS1-#2 (bottom) with or without Dox induction. shREN is a Dox-inducible control shRNA, and actin was used as a loading control. h, Top, Effects of murine CPS1 (mCPS1) expression on viability in H460 cells expressing shCPS1-#2. Data are the average and SD of three independent cultures. Bottom, Abundance of CPS1 protein in H460 cells expressing mCPS1 with or without shCPS1 induction. Actin was used as a loading control. i, TUNEL staining of tumor tissues. 4’,6-diamidino-2-phenylindole (DAPI) was used to stain DNA. Scale bar, 500 μm. In d, statistical significance was assessed using two-tailed Student’s t-test. ****p<0.0001. In f and h, statistical significance was assessed using one-way ANOVA followed by Tukey’s multiple comparisons test. ***p< 0.001. Tissue TUNEL staining was performed once. Viability assay (f) was performed twice. All other experiments were repeated three times or more.
Extended Data Fig. 8. CPS1 expression and xenograft growth.
a and b, Abundance of CPS1 protein in H460 (a) and H2122 (b) xenografts expressing shCPS1-#1 (top) and shCPS1-#2 (bottom) with or without Dox induction. shREN is a Dox-inducible control shRNA, and actin is a loading control. c, Effect of Dox-induction of shCPS1-#1 (left) and shCPS1-#2 (right) on H2122 xenograft growth. Nude mice were injected subcutaneously with H2122 shCPS1 (#1, #2) cells, and Dox (200 mg/kg) was introduced 1 day later. Each group (n=8) is presented as mean tumor volume and SEM. Statistical significance was assessed using two-way ANOVA. **p < 0.01, ****p<0.0001. Experiments were performed once (n=8 mice).
Extended Data Fig. 9. CPS1 silencing results in pyrimidine depletion and DNA damage.
a, Ammonia release from H460 cells expressing shREN or shCPS1-#1 (n=3). b, Ammonia release from H460 cells expressing shREN or shCPS1-#2 in the presence and absence of glucose. Glucose deprivation provides a positive control for enhanced ammonia release in cancer cells (see “Metabolic Assays” In Methods section). Data are the average and SD of three independent cultures, each with three technical replicates (total n=9). c, Abundance of total CAD, phosphorylated CAD (pCAD) and phosphorylated 4E-BP1 (4E-BP1) in K, L, and KL cells. Actin was used as a loading control. d, Left, CPS1, CAD, LKB1 and phosphorylated AMPK (pAMPK) abundance in H460 cells without (EV) or with LKB1 expression. Cells were transfected with siRNA targeting CAD or CPS1. Actin was used as a loading control. Right, Abundance of CPS1 and CAD protein in WT or CPS1-knockout H460 cells. Actin was used as a loading control. e, Relative abundance of pyrimidines and purines during expression of shREN (closed bars) or shCPS1#1 (open bars) (n=6). f, Effects of CPS1 silencing on bromodeoxyuridine (BrdU) incorporation (n≥3). DNA content and BrdU incorporation were assessed by flow cytometry following dual staining with BrdU and PI. g, Effect of CPS1 silencing on cell cycle distribution (n=4). h, Abundance of CPS1 protein and γH2AX in H460-shREN and -shCPS1#1 cells with or without Dox induction. i, γH2AX in H460 xenografts. DAPI was used to stain DNA. Scale bar, 40 μm. j, Effects of CPS1 silencing on DNA track length measured by iododeoxyuridine (IdU) and chlorodeoxyuridine (CldU) incorporation. At least 104 tracks were measured for each condition. Scale bar 2 μm. In b, statistical significance was assessed using one-way ANOVA followed by Tukey’s multiple comparisons test. *, p<0.05 comparing to shREN+Glc; #, p<0.05 comparing to shCPS1+Glc. In a, e, g and j, statistical significance was assessed using two-tailed Student’s t-test. *p < 0.05, **p < 0.01, ***p< 0.001. Tissue staining was performed once. Nucleotide measurements and DNA fiber assays were performed twice. All other experiments were repeated three times or more.
Extended Data Fig. 10. Regulation of CAD transcription is distinct from that of CPS1, and pyrimidine nucleosides rescue DNA damage and proliferation of CPS1 silenced cells.
a, Chromatin signatures at the CAD locus in A549 cells. Promoter sequences are shaded. Arrowheads indicate amplicons for promoter (P1, P2) regions for ChIP-qPCR in b. b, Chromatin occupancy of H3K27ac, RNAPII, FOXA1, H3K4me3, CREB1, TEAD4 and IgG (negative control) in KL (A459, H460) and in K (Calu-1, H1373) cells. Data are the average and SD of two independent cultures, each with two technical replicates (total n=4). c, Effects of CREB1, FOXA1 and TEAD4 silencing on CAD mRNA expression in A549 cells. Data are the average and SD of three independent cultures, each with two technical replicates (total n=6). d, Effects of CREB1, FOXA1 and TEAD4 silencing on CAD protein abundance in A549 cells. CB was used as a loading control. e, Effect of supplementing culture medium with uridine and thymidine (UT) or adenosine (A) (100 μM final concentration) on γH2AX abundance in Dox-induced H460 cells expressing shREN or shCPS1-#1. f, Effect of supplementing culture medium with UT or A on anchorage independent colony formation of H460 cells expressing shCPS1-#1 (n=3). Time point is 20 days after Dox induction. g, Effects of nucleoside supplementation on proliferation of H460 cells expressing shCPS1-#2. Data are the average and SD of three independent cultures, each with three technical replicates (total n=9). h, Colonies from Fig. 4f. 1–4: shREN, 5–8: shCPS1-#2, 1,5: no treatment, 2,6: Dox treatment, 3,7: Dox+ UT, 4,8: Dox+A. i, Effect of supplementing with uridine alone on anchorage independent colony formation of H460 cells expressing shCPS1-#2. Data are the average and SD of three independent cultures. j, Growth of subcutaneous H460 shREN-derived xenografts in presence and absence of Dox, with or without cisplatin. Mean tumor volume and SEM are shown for each group (n=4) k, Growth of subcutaneous H2122-derived xenografts in nude mice in the presence and absence of Dox (200 mg/kg) introduced 1 day after implantation with or without cisplatin treatment (IP injection at 2mg/kg for 5–6 doses). Mean tumor volume and SEM are shown for each group (n=4). In b and i, statistical significance was assessed using two-tailed Student’s t-test. *p<0.05, **p < 0.01, n.s. not significant. In f and g, statistical significance was assessed using one-way ANOVA followed by Tukey’s multiple comparisons test. In j and k, statistical significance was assessed using two-way ANOVA followed by Tukey’s multiple comparisons test. Panel f: *, p<0.05 comparing to shREN; #, p<0.05 comparing to shCPS1; Ɨ, p<0.05 comparing to shCPS1+A. Panel g; first four bars: *, p<0.05 comparing to shREN without Dox. second four bars: *, p<0.05 comparing to shCPS1 without Dox; #, p<0.05 comparing to shCPS1 with Dox; Ɨ, p<0.05 comparing to shCPS1 with Dox+UT. Panel j and k: *, p<0.05 comparing to -Dox-Cis; #, p<0.05 comparing to -Dox+Cis; Ɨ, p<0.05 comparing to +Dox-Cis. Xenograft experiments were performed once, ChIP-qPCR was performed twice and all other experiments were performed three times or more.
Supplementary Material
Supplementary Information Table 1: Targeted metabolomics in K and KL cells. A set of 111 metabolites was monitored in five cell lines each with the K or KL genotype (see row labeled “Class”). Average normalized metabolite abundances are shown for each cell line and for the average of all K and KL cell lines. Average fold changes and statistical assessment of metabolomics differences between the two genotypes are in columns BE and BF.
Supplementary Information Table 2: Variable Importance in the Projection (VIP) analysis of metabolomic differences between K and KL cells. Primary data used in the analysis are in Supplementary Information Table 1. Nitrogen-related metabolites are highlighted in orange here and in red on Fig. 1a. Metabolites with p values <0.01 after Bonferroni correction are in green.
Supplementary Information Table 3: Targeted metabolomics in K and KL human NSCLC tissues. A set of 133 metabolites was monitored in seven K and four KL tumors (see column labeled “Class”). Multiple fragments of each tumor were analyzed by metabolomics. Average normalized metabolite abundances are shown for all K and KL fragments in columns CP and CQ. Statistical assessment and average fold changes of abundance differences between the genotypes are in columns CR and CS.
Supplementary Information Table 4: VIP analysis of metabolomic differences between K and KL human NSCLC. Primary data used in the analysis are in Supplementary Information Table 3. Nitrogen-related metabolites are highlighted in orange here and in red on Extended Data Fig. 3b. Metabolites with p values <0.01 after Bonferroni correction are in green.
Supplementary Information Table 5: KRAS and STK11 mutation status of 203 cell lines. This Table lists the names and KRAS/STK11 mutation status for the 203 cell lines used in Fig. 1c and Extended Data Fig. 4b.
Supplementary Information Table 6: Expression of genes related to the urea cycle and metabolism of amino groups in K and KL cells. Microarray analysis of gene expression was performed in 203 cell lines. Relative mRNA abundance is displayed for 29 genes from the “Enzymes in Urea Cycle and Metabolism of Amino Group” gene set, plus NOS1 and NOS2. Expression distributions for eight genes in this pathway are shown for each genotype in Fig. 1c and Extended Data Fig. 1b.
Supplementary Information Table 7: Classification and mutation status of 94 lung cancer cell lines. This Table lists the names, biological characteristics and KRAS/LKB1 classification for the 94 cell lines used in Fig. 2a and Extended Data Fig. 5a.
Supplementary Information Table 8: Correlations between CPS1 mRNA abundance and 176 proteins/phosphoproteins. All cell lines listed in Supplementary Information Table 7 were analyzed by Illumina BeadArray for genome-wide mRNA abundance and by a reverse-phase protein array (RPPA) containing antibodies against 176 proteins and phosphoproteins, as described in the main text. This Table displays the correlation coefficients (r) and p values for correlations between CPS1 mRNA and the abundance of each of the RPPA targets. LKB1 is by far the most strongly anti-correlated protein with CPS1 mRNA.
Supplementary Information Table 9: Correlations between LKB1 protein abundance and genome-wide mRNA abundance. All cell lines in Supplementary Information Table 7 were analyzed by Illumina BeadArray for genome-wide mRNA abundance and by a reverse-phase protein array (RPPA) containing antibodies against 176 proteins and phosphoproteins, as described in the main text. This Table displays the correlation coefficients (r) and p values for correlations between LKB1 protein abundance as assessed by RPPA and all 19,579 transcripts detected by BeadArray. STK11, the gene encoding LKB1, was the 5th most strongly correlated transcript, and CPS1 was the second most anti-correlated transcript.
Supplementary Information Table 10: This table lists precursor and product ions (Q1 and Q3, respectively), retention time, dwell time, declustering potential (DP), collision energy (CE) and Collision Cell Exit Potential (CXP) for each transition of thymidine.
Acknowledgments
We thank Aron Jaffe and the DeBerardinis laboratory for critiquing the manuscript and Julia Kozlitina for statistical expertise. R.J.D. is supported by grants from the N.I.H (R01CA157996), Cancer Prevention and Research Institute of Texas (CPRIT RP130272), Robert A. Welch Foundation (I1733) and H.H.M.I. (Faculty Scholars Program). J.K. is supported by an American Lung Association Senior Research Training Fellowship (RT-306212). D.H.C. is supported by N.I.H. grant (1R01CA196912). J.D.M., J.R.C., P.V. and I.W. are supported by the University of Texas Lung Specialized Programs of Research Excellence (SPORE) grant (P50CA70907). J.D.M is also supported by N.I.H. grant CA176284 and CPRIT grants RP120732 and RP110708.
Footnotes
R.J.D. is on the advisory board of Agios Pharmaceuticals.
Author Contributions. J.K. and R.J.D. designed the study and wrote the paper. Z.H. performed the metabolomics. L.C. and M.N. provided biostatistics expertise. E.C. provided advice about replication fork stalling. K.L. and J.X. performed ChIP-qPCR and provided advice on epigenetics. E.W., J.V., and D.L. provided human NSCLC samples for metabolomics. K.U.K. and L.G. provided expertise in metabolomics and transcript analysis. C.G.P., D.H.C., P.V., J.R.-C. and I.W. performed tumor microarrays. Y.-F.L. and B.C. performed DNA fiber assays. B.F. provided expertise on AMPK. D.B. performed transient gene silencing. L.A.B. and J.V.H. provided reverse-phase proteomics and patient survival data. K.E.H. and J.D.M. provided cell lines, gene expression data, and intellectual input regarding molecular lung cancer subtypes.
References
- 1.Calles A, et al. Immunohistochemical Loss of LKB1 Is a Biomarker for More Aggressive Biology in KRAS-Mutant Lung Adenocarcinoma. Clinical cancer research : an official journal of the American Association for Cancer Research. 2015;21:2851–2860. doi: 10.1158/1078-0432.ccr-14-3112. [DOI] [PubMed] [Google Scholar]
- 2.Ji H, et al. LKB1 modulates lung cancer differentiation and metastasis. Nature. 2007;448:807–810. doi: 10.1038/nature06030. [DOI] [PubMed] [Google Scholar]
- 3.Liu Y, et al. Metabolic and functional genomic studies identify deoxythymidylate kinase as a target in LKB1-mutant lung cancer. Cancer discovery. 2013;3:870–879. doi: 10.1158/2159-8290.cd-13-0015. [DOI] [PMC free article] [PubMed] [Google Scholar]
- 4.Kim HS, et al. Systematic identification of molecular subtype-selective vulnerabilities in non-small-cell lung cancer. Cell. 2013;155:552–566. doi: 10.1016/j.cell.2013.09.041. [DOI] [PMC free article] [PubMed] [Google Scholar]
- 5.Liu H, Dong H, Robertson K, Liu C. DNA methylation suppresses expression of the urea cycle enzyme carbamoyl phosphate synthetase 1 (CPS1) in human hepatocellular carcinoma. The American journal of pathology. 2011;178:652–661. doi: 10.1016/j.ajpath.2010.10.023. [DOI] [PMC free article] [PubMed] [Google Scholar]
- 6.Rabinovich S, et al. Diversion of aspartate in ASS1-deficient tumours fosters de novo pyrimidine synthesis. Nature. 2015;527:379–383. doi: 10.1038/nature15529. [DOI] [PMC free article] [PubMed] [Google Scholar]
- 7.Celiktas MTI, Chandra Tripathi S, Fahrmann JF, Aguilar-Bonavides C, Villalobos P, Delgado O, Dhillon D, Dennison JB, Ostrin EJ, Wang H, Behrens C, Do KA, Gazdar AF, Hanash SM, Taguchi A. Role of CPS1 in Cell Growth, Metabolism, and Prognosis in LKB1-Inactivated Lung Adenocarcinoma. J Natl Cancer Inst. 2016;109 doi: 10.1093/jnci/djw231. [DOI] [PMC free article] [PubMed] [Google Scholar]
- 8.Shackelford DB, Shaw RJ. The LKB1-AMPK pathway: metabolism and growth control in tumour suppression. Nat Rev Cancer. 2009;9:563–575. doi: 10.1038/nrc2676. [DOI] [PMC free article] [PubMed] [Google Scholar]
- 9.Hardie DG, Ross FA, Hawley SA. AMPK: a nutrient and energy sensor that maintains energy homeostasis. Nature reviews. Molecular cell biology. 2012;13:251–262. doi: 10.1038/nrm3311. [DOI] [PMC free article] [PubMed] [Google Scholar]
- 10.Mo JS, et al. Cellular energy stress induces AMPK-mediated regulation of YAP and the Hippo pathway. Nat Cell Biol. 2015;17:500–510. doi: 10.1038/ncb3111. [DOI] [PMC free article] [PubMed] [Google Scholar]
- 11.Sun Y, et al. Metformin induces apoptosis of human hepatocellular carcinoma HepG2 cells by activating an AMPK/p53/miR-23a/FOXA1 pathway. Onco Targets Ther. 2016;9:2845–2853. doi: 10.2147/OTT.S99770. [DOI] [PMC free article] [PubMed] [Google Scholar]
- 12.Kim HG, et al. Metformin inhibits P-glycoprotein expression via the NF-kappaB pathway and CRE transcriptional activity through AMPK activation. Br J Pharmacol. 2011;162:1096–1108. doi: 10.1111/j.1476-5381.2010.01101.x. [DOI] [PMC free article] [PubMed] [Google Scholar]
- 13.Chen KC, Vannais DB, Jones C, Patterson D, Davidson JN. Mapping of the gene encoding the multifunctional protein carrying out the first three steps of pyrimidine biosynthesis to human chromosome 2. Human genetics. 1989;82:40–44. doi: 10.1007/BF00288269. [DOI] [PubMed] [Google Scholar]
- 14.Simmer JP, et al. Mammalian dihydroorotase: nucleotide sequence, peptide sequences, and evolution of the dihydroorotase domain of the multifunctional protein CAD. Proceedings of the National Academy of Sciences of the United States of America. 1990;87:174–178. doi: 10.1073/pnas.87.1.174. [DOI] [PMC free article] [PubMed] [Google Scholar]
- 15.Ben-Sahra I, Howell JJ, Asara JM, Manning BD. Stimulation of de novo pyrimidine synthesis by growth signaling through mTOR and S6K1. Science (New York, N Y) 2013;339:1323–1328. doi: 10.1126/science.1228792. [DOI] [PMC free article] [PubMed] [Google Scholar]
- 16.Wraith J. Ornithine carbamoyltransferase. Archives of Disease in Childhood. 2001;84:84–88. doi: 10.1136/adc.84.1.84. [DOI] [PMC free article] [PubMed] [Google Scholar]
- 17.Poli J, et al. dNTP pools determine fork progression and origin usage under replication stress. The EMBO journal. 2012;31:883–894. doi: 10.1038/emboj.2011.470. [DOI] [PMC free article] [PubMed] [Google Scholar]
- 18.Anglana M, Apiou F, Bensimon A, Debatisse M. Dynamics of DNA replication in mammalian somatic cells: nucleotide pool modulates origin choice and interorigin spacing. Cell. 2003;114:385–394. doi: 10.1016/s0092-8674(03)00569-5. [DOI] [PubMed] [Google Scholar]
- 19.Petermann E, Orta ML, Issaeva N, Schultz N, Helleday T. Hydroxyurea-stalled replication forks become progressively inactivated and require two different RAD51-mediated pathways for restart and repair. Molecular cell. 2010;37:492–502. doi: 10.1016/j.molcel.2010.01.021. [DOI] [PMC free article] [PubMed] [Google Scholar]
- 20.Labib K, Hodgson B. Replication fork barriers: pausing for a break or stalling for time? EMBO reports. 2007;8:346–353. doi: 10.1038/sj.embor.7400940. [DOI] [PMC free article] [PubMed] [Google Scholar]
- 21.Reichard P. Interactions between deoxyribonucleotide and DNA synthesis. Annual review of biochemistry. 1988;57:349–374. doi: 10.1146/annurev.bi.57.070188.002025. [DOI] [PubMed] [Google Scholar]
- 22.Shackelford DB, et al. LKB1 inactivation dictates therapeutic response of non-small cell lung cancer to the metabolism drug phenformin. Cancer cell. 2013;23:143–158. doi: 10.1016/j.ccr.2012.12.008. [DOI] [PMC free article] [PubMed] [Google Scholar]
- 23.Son J, et al. Glutamine supports pancreatic cancer growth through a KRAS-regulated metabolic pathway. Nature. 2013;496:101–105. doi: 10.1038/nature12040. [DOI] [PMC free article] [PubMed] [Google Scholar]
- 24.Mullen AR, et al. Oxidation of alpha-ketoglutarate is required for reductive carboxylation in cancer cells with mitochondrial defects. Cell Rep. 2014;7:1679–1690. doi: 10.1016/j.celrep.2014.04.037. [DOI] [PMC free article] [PubMed] [Google Scholar]
- 25.Yang C, et al. Glioblastoma cells require glutamate dehydrogenase to survive impairments of glucose metabolism or Akt signaling. Cancer research. 2009;69:7986–7993. doi: 10.1158/0008-5472.can-09-2266. [DOI] [PMC free article] [PubMed] [Google Scholar]
- 26.Jackson DA, Pombo A. Replicon clusters are stable units of chromosome structure: evidence that nuclear organization contributes to the efficient activation and propagation of S phase in human cells. The Journal of cell biology. 1998;140:1285–1295. doi: 10.1083/jcb.140.6.1285. [DOI] [PMC free article] [PubMed] [Google Scholar]
- 27.Huang J, et al. Dynamic Control of Enhancer Repertoires Drives Lineage and Stage-Specific Transcription during Hematopoiesis. Developmental cell. 2016;36:9–23. doi: 10.1016/j.devcel.2015.12.014. [DOI] [PMC free article] [PubMed] [Google Scholar]
- 28.Ran FA, et al. Genome engineering using the CRISPR-Cas9 system. Nature protocols. 2013;8:2281–2308. doi: 10.1038/nprot.2013.143. [DOI] [PMC free article] [PubMed] [Google Scholar]
- 29.Shalem O, et al. Genome-scale CRISPR-Cas9 knockout screening in human cells. Science (New York, NY) 2014;343:84–87. doi: 10.1126/science.1247005. [DOI] [PMC free article] [PubMed] [Google Scholar]
- 30.Comprehensive molecular profiling of lung adenocarcinoma. Nature. 2014;511:543–550. doi: 10.1038/nature13385. [DOI] [PMC free article] [PubMed] [Google Scholar]
Associated Data
This section collects any data citations, data availability statements, or supplementary materials included in this article.
Supplementary Materials
Supplementary Information Table 1: Targeted metabolomics in K and KL cells. A set of 111 metabolites was monitored in five cell lines each with the K or KL genotype (see row labeled “Class”). Average normalized metabolite abundances are shown for each cell line and for the average of all K and KL cell lines. Average fold changes and statistical assessment of metabolomics differences between the two genotypes are in columns BE and BF.
Supplementary Information Table 2: Variable Importance in the Projection (VIP) analysis of metabolomic differences between K and KL cells. Primary data used in the analysis are in Supplementary Information Table 1. Nitrogen-related metabolites are highlighted in orange here and in red on Fig. 1a. Metabolites with p values <0.01 after Bonferroni correction are in green.
Supplementary Information Table 3: Targeted metabolomics in K and KL human NSCLC tissues. A set of 133 metabolites was monitored in seven K and four KL tumors (see column labeled “Class”). Multiple fragments of each tumor were analyzed by metabolomics. Average normalized metabolite abundances are shown for all K and KL fragments in columns CP and CQ. Statistical assessment and average fold changes of abundance differences between the genotypes are in columns CR and CS.
Supplementary Information Table 4: VIP analysis of metabolomic differences between K and KL human NSCLC. Primary data used in the analysis are in Supplementary Information Table 3. Nitrogen-related metabolites are highlighted in orange here and in red on Extended Data Fig. 3b. Metabolites with p values <0.01 after Bonferroni correction are in green.
Supplementary Information Table 5: KRAS and STK11 mutation status of 203 cell lines. This Table lists the names and KRAS/STK11 mutation status for the 203 cell lines used in Fig. 1c and Extended Data Fig. 4b.
Supplementary Information Table 6: Expression of genes related to the urea cycle and metabolism of amino groups in K and KL cells. Microarray analysis of gene expression was performed in 203 cell lines. Relative mRNA abundance is displayed for 29 genes from the “Enzymes in Urea Cycle and Metabolism of Amino Group” gene set, plus NOS1 and NOS2. Expression distributions for eight genes in this pathway are shown for each genotype in Fig. 1c and Extended Data Fig. 1b.
Supplementary Information Table 7: Classification and mutation status of 94 lung cancer cell lines. This Table lists the names, biological characteristics and KRAS/LKB1 classification for the 94 cell lines used in Fig. 2a and Extended Data Fig. 5a.
Supplementary Information Table 8: Correlations between CPS1 mRNA abundance and 176 proteins/phosphoproteins. All cell lines listed in Supplementary Information Table 7 were analyzed by Illumina BeadArray for genome-wide mRNA abundance and by a reverse-phase protein array (RPPA) containing antibodies against 176 proteins and phosphoproteins, as described in the main text. This Table displays the correlation coefficients (r) and p values for correlations between CPS1 mRNA and the abundance of each of the RPPA targets. LKB1 is by far the most strongly anti-correlated protein with CPS1 mRNA.
Supplementary Information Table 9: Correlations between LKB1 protein abundance and genome-wide mRNA abundance. All cell lines in Supplementary Information Table 7 were analyzed by Illumina BeadArray for genome-wide mRNA abundance and by a reverse-phase protein array (RPPA) containing antibodies against 176 proteins and phosphoproteins, as described in the main text. This Table displays the correlation coefficients (r) and p values for correlations between LKB1 protein abundance as assessed by RPPA and all 19,579 transcripts detected by BeadArray. STK11, the gene encoding LKB1, was the 5th most strongly correlated transcript, and CPS1 was the second most anti-correlated transcript.
Supplementary Information Table 10: This table lists precursor and product ions (Q1 and Q3, respectively), retention time, dwell time, declustering potential (DP), collision energy (CE) and Collision Cell Exit Potential (CXP) for each transition of thymidine.
Data Availability Statement
All primary data are included in the supplement accompanying this article. Any additional information required to interpret, replicate, or build upon the methods or findings reported in the article are available upon request.


