Abstract
Visualization of subcellular organelles in vivo is critical for basic biomedical research and clinical applications. Two new flavonoids with an amide substituent were synthesized and characterized. The flavonoids were nearly non-fluorescent in aqueous environment, but exhibited two emission peaks (one λem at 495–536 nm and the other at 570–587 nm) in organic solvents, which were assigned to the excited normal (N*) and tautomer (T*) emission. When the dyes were examined on oligodendrocyte cells, they were found to selectively accumulate in the endoplasmic reticulum (ER), a eukaryotic organelle involved in lipid and protein synthesis, giving fluorescence turn-on. The ER-selective flavonoids could be a valuable tool due to its low molecular mass (<500), large Stokes’ shift, low toxicity, and biocompatibility.
Introduction
Optical visualization of subcellular organelles and biochemical processes in vivo is critical for basic biomedical research and the development of novel clinical diagnostics.1–3 The endoplasmic reticulum (ER) plays a central role in the biosynthesis of lipids and proteins. In the lumen of the endoplasmic reticulum, proteins fold and mature before being delivered to other compartments of cells or released extracellularly. An accumulation of unfolded or misfolded proteins causes disturbances in the normal functions of the ER, which induces a cellular stress response (or ER stress) that activates the unfolded protein response (UPR).1,2 UPR activation increases ER abundance to match needs by mediating expansion of the ER membrane.3 Since ER stress is involved in the feedback loops that establish and maintain homostasis, it plays a significant role in various diseases4 such as autoimmunity5 and metabolic disease.6,7 Because of the importance of the ER in disease, there is significant interest in developing new probes to track ER dynamics.8 An effective ER imaging probe has potential to identify perturbations in ER function that are associated with early disease pathology.
Oligodendrocytes are the myelinating glial cells of the central nervous system. The myelin sheath produced by these cells is a lipid-rich structure that insulates axons in the central nervous system (CNS) and promotes rapid conduction of nerve impulses.9 Myelin is a poorly hydrated structure containing 40% water, and the dry mass of myelin consists of ~70% lipids and 30% proteins. During the active phase of myelination (the process of forming myelin sheath), each oligodendrocyte in the CNS must produce as much as ~5000 μm2 of myelin surface area per day, and ~105 myelin-associated protein molecules per minute.10 ER stress can disturb lipid and protein synthesis and this has been linked to oligodendrocyte perikaryon degeneration and myelin sheath disintegration.11 In addition, ER stress in oligodendrocytes has been implicated in dysmyelinating diseases.12
Considerable interests exist in searching for novel fluorescent probes that can target specific biological tissues/molecules to meet the need for advanced bioimaging.13 Among the known probes, few are capable of targeting ER, partly due to the challenge in controlling ER selectivity. A recent ER-probe uses a nitro-furan group to target ER-associated proteins.14 The commercial ER-Tracker Green and Red contains a “gliberclamide” segment (Scheme 1), which binds to the sulphonylurea receptors of ATP-sensitive K+ channels15,16 that are prominent on ER.17 In the commercial ER probes, the necessary “gliberclamide” segment for ER selectivity has the mass of 494 Da, whose relative large moiety could cause significant perturbations to normal cell activity upon introduction. In order to avoid this potential side effect, an ideal ER probe should have the lowest possible molecular weight (e.g. Mw below 500 Da). In addition, the probe should be non-toxic for cells.
Scheme 1.
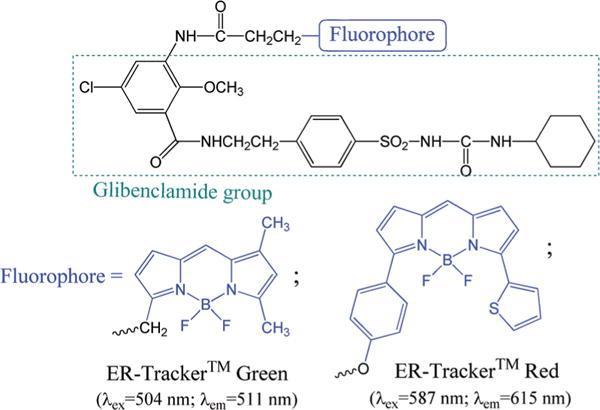
Structures of commercial ER-Tracker, where the fluorophore is shown in blue color.
As a broad class of natural substances normally occurring in diet, flavonoids exhibit a variety of beneficial health effects, including antioxidant properties and anticancer activities.18,19 With simple/minor structural modification, the flavonoids can also exhibit “excited-state intramolecular photon-transfer (ESIPT),” which provides intense fluorescence with large Stokes Shifts.20 The combination of the unique optical properties and biocompatibility makes flavonoid compounds a valuable template for sensor design. Our recent studies show that the flavonoid 1 (Scheme 2) with a suitable amino substituent (R2N–) is an environmentally sensitive dye, which can be tailored to target various biomolecular structures.21,22 Thus, via attaching a functional group at the C-3 position of “chromen-4-one” segment, flavonoid 1a can label mitochondria.21 Flavonoid 1b shows a large fluorescence turn-on upon selective binding to albumin proteins.22 The observed protein selectivity also raises the possibility for other protein binding-induced fluorescence turn-on. Herein we disclose that the flavonoid 2 with a small amide group on the C-6 position shows excellent selectivity for ER localization in mammalian cells.
Scheme 2.
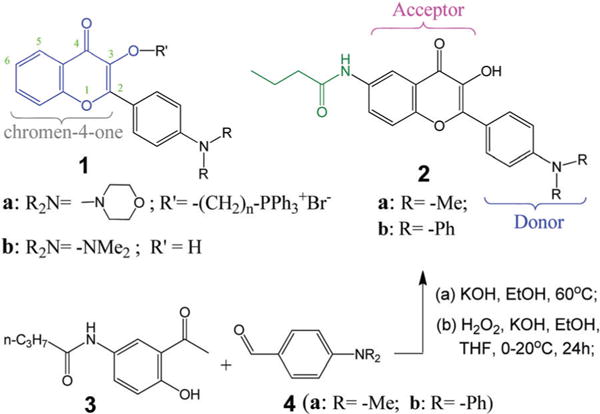
Chemical structures of flavonoids 1–2 and synthesis of 2.
Results and discussion
Synthesis of flavonoids
The new flavonoids 2a–2b include a donor–acceptor (D–A) interaction, which retains the desirable fluorescent solvatochromic property. Flavonoids 2 were synthesized by reaction of N-(3-acetyl-4-hydroxyphenyl)butyramide 3 with 4-(dialkylamino)benzaldehyde 4 in two steps (Scheme 2), i.e. by Claisen–Schmidt condensation followed by Algar–Flynn–Oyamada reaction.23,24 The crude product was purified by recrystallization from hexane/ethanol mixture in good yield.
Optical properties
Both flavonoid compounds showed a similar absorption, revealing λmax at 406 nm and 411 nm for 2a and 2b, respectively (Fig. 1). The emission of 2a revealed two peaks with λem at 495 and 570 nm, which could be attributed to the excited normal form (N*) and the tautomeric form (T*), respectively. The tautomer emission (from T*) was associated with the excited state intramolecular proton transfer (ESIPT) (see Scheme 3).25 In contrast, the emission λem from the N* and T* of 2b was at 536 and 587 nm, with about equal intensity. The observed large difference in the ratio of N- and T-emission indicated that the amino substituent in the electron-donor segment had a profound impact on the emissive property of flavonoids. By using rhodamine 6G in ethanol (QY = 95%)26 as a reference, the fluorescence quantum yield (QY) of 2a and 2b were determined to be 26% and 47%, respectively. Both 2a and 2b exhibited large Stokes’ shifts (~170 nm), which is highly desirable for fluorescence imaging. The observed large Stokes’ shift could be attributed to a combination of the intramolecular charge transfer (ICT) and ESIPT processes occurring in the flavonoids.
Fig. 1.
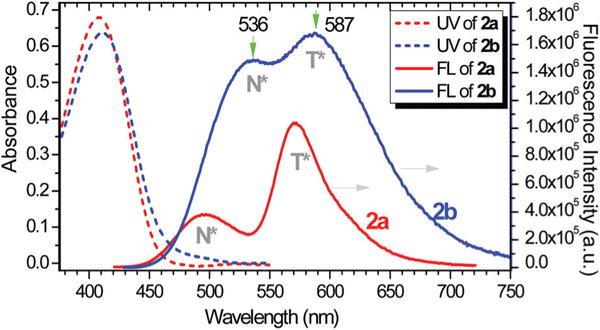
UV-vis (broken line) and fluorescence spectra (solid line) of 2a and 2b in CH2Cl2 (10 μM) at room temperature. The fluorescence excitation at 410 nm. The N* and T* indicate the emission from normal or tautomeric form.
Scheme 3.
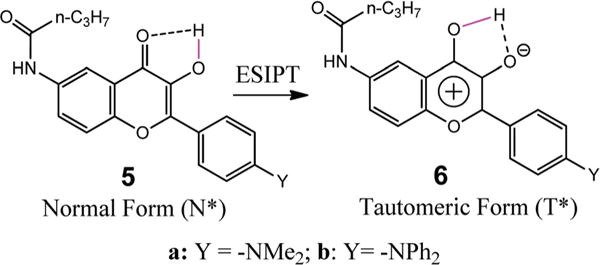
The ESIPT process of a representative flavonoid, showing the structural change from N-tautomer to T-tautomer.
Compound 2 appeared to be non-fluorescent in aqueous solution, possibly due to excessive hydrogen bonding to chromen-4-one unit (see 1 in Scheme 2). In a non-aqueous solution, however, the flavonoid gave a large fluorescence turn-on (Fig. 2). In a less polar solvent such as THF and toluene, the flavonoid gave a predominant emission from the excited tautomer (T*). It was also interesting to note that the T* emission wavelength was basically not influenced by the solvent polarity, although the tautomer had a more polar structure. This was in sharp contrast to the N* emission, whose emission wavelength was notably shifted to a longer wavelength as solvent polarity increased (e.g. from 487 nm in toluene to 540 nm in DMSO, see Fig. 2). One possible reason was that the solvent reorganization was not significant during the short lifetime of the excited tautomer T*.
Fig. 2.
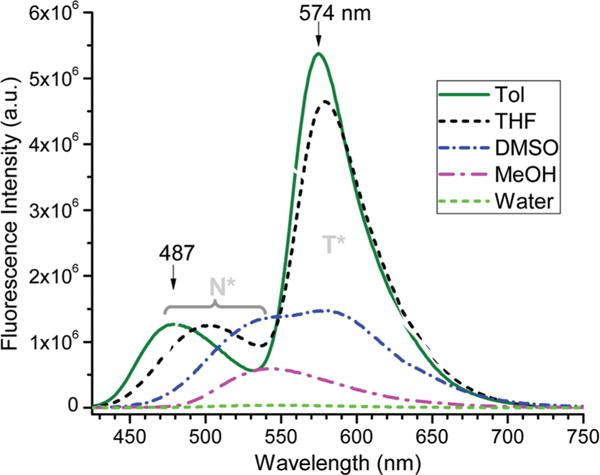
Fluorescence of 2b in different solvents at room temperature.
The environmental response of 2 was further examined on proteins. The weak fluorescence of 2b in aqueous solution was increased moderately upon addition of 1 equiv. of bovine serum albumin (BSA) or human serum albumin (HSA), giving only one emission peak at λem ≈ 532 nm (ESI,† Fig. S2). On the basis of the emission wavelength (532 nm), the observed emission from the albumin binding was likely from the N* form (Fig. 2), although it was not clear why the emission from the T* form was inhibited upon binding proteins.
Cytotoxicity of flavonoids was examined by using an MTT assay, showing that the half maximal inhibitory concentration (IC50) for 2a–2b was 25 μM. Low cytotoxicity of 2 encouraged us to further examine the staining of the flavonoids in MO3.13 cells. This human cell line has the properties of myelinating oligodendrocytes, and has abundant myelin basic proteins (MBP) which are almost exclusively found in oligodendrocyte.27 When the cells were incubated with 2 and imaged by confocal microscropy, the dye was found to quickly penetrate into cells, giving strong fluorescence (Fig. 3). Weak fluorescence could be observed immediately after adding dyes into cells and mounting the sample onto microscope (approximately in less than 1 minute). Since the dye was relatively non-fluorescent in an aqueous environment, the observed fluorescence was assumed to arise from its interaction with cellular lipids or hydrophobic pockets of proteins.
Fig. 3.
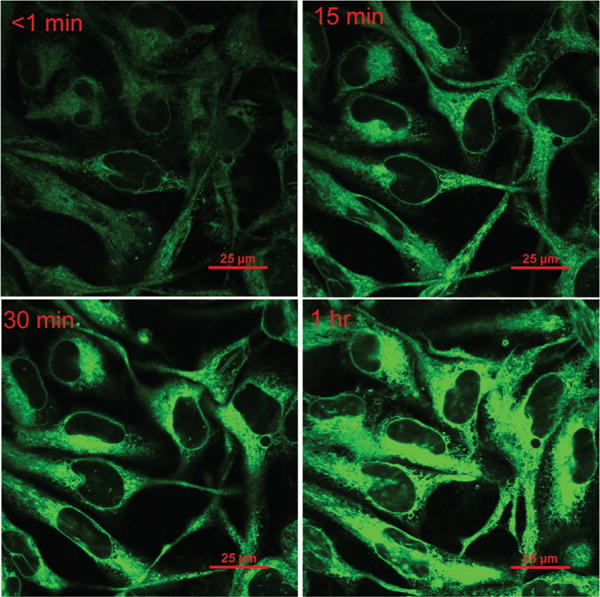
Confocal imaging of oligodendrocyte cells incubated with 2b (10 μM) at <1, 15, 30, and 60 minutes after probe addition. Magnification is 100×.
Colocalization of 2 and ER-Tracker in oligodendrocytes
To the MO3.13 cell media were added ER-Tracker™ Red (concentration 1 μM) along with flavonoid 2 to be tested (concentration 500 nM). Fluorescent probe DRAQ5 (10 μM) was also added to the tissue culture media for staining cell nuclei. The fluorescence confocal imaging (Fig. 4B) revealed that flavonoid 2 stained the cell components surrounding the nuclei. The sharp circles in fluorescence image of 2 (Fig. 3) were outer contour of nuclei, since they are not stained and non-fluorescent.
Fig. 4.
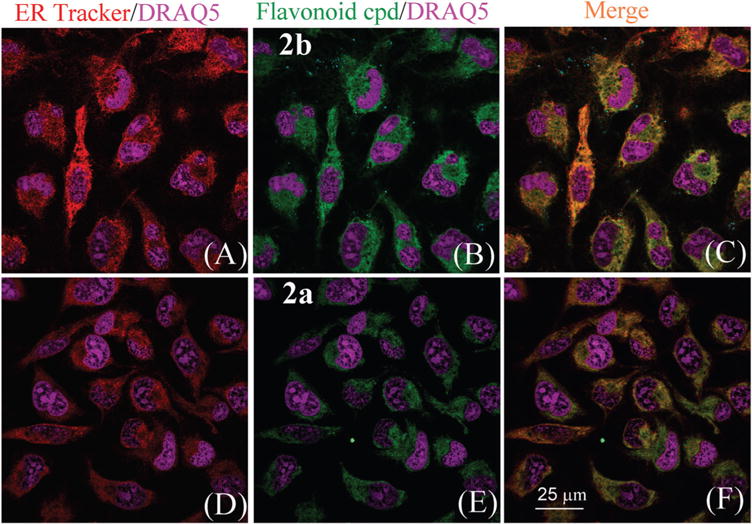
Confocal imaging of MO3.13 cells incubated with ER-Tracker (1 μM) (panels A and D), flavonoid compounds 2b (panel B) or 2a (panel E) (500 nM, for each dye respectively). Panels (C) and (F) are the merged images of ER Tracker Red and flavonoid probes. The nuclei of cells were stained with DRAQ5 (shown in purple).
The non-uniform stain of 2 on the cells suggests that the dyes might be selectively binding to intracellular organelles. In order to confirm the intracellular location and distribution of 2, we examined the colocalization of our dye with the commercial ER probe, ER-Tracker™ Red. Incubation of MO3.13 cells with ER–Tracker™ Red showed robust fluorescence in structures surrounding the nucleus, a pattern consistent with ER staining (Fig. 4A and D). Staining with both compounds 2a and 2b showed similar localization (Fig. 4E and B) and colocalization was observed when cells were incubated with both the commercial ER dye and our probes (Fig. 4C and F). The stained cells were scanned repeated at 5 minute interval for 3 hours (ESI,† Fig. S12), which revealed good stability in comparison with commercial ER Tracker (ESI,† Fig. S13).
It is well known that ER forms an interconnected network of membrane-enclosed sacs which are embedded with transmembrane proteins that contain hydrophobic structural motifs. It is attractive to speculate that the flavonoid dyes were binding to these types of hydrophobic structures. Such ER binding-induced fluorescence turn-on would be valuable for dynamic tracking, since 2 was nearly non-fluorescent in the aqueous environment. The assumption was confirmed by observation of clear cell contours without post-staining washing (Fig. 3), as the dyes outside the cells did not give observable fluorescence. Direct comparison also revealed that flavonoid 2b gave stronger green fluorescence than 2a under the same experimental conditions (Fig. 4B and E), illustrating that the ER binding-induced fluorescence turn on was also sensitive to substituents on the flavonoid.
In order to verify the ER selectivity, flavonoid 2b was further examined by staining in GL261 cells (astrocyte derived glioblastoma), which is a mouse glioblastoma multiforme (GBM) cell line and its growth is known to respond to ER stress.28 Colocalization of 2b with the commercial ER-Tracker™ Red revealed the identical patterns (Fig. 5A and B), showing that the flavonoid was indeed selective to ER. The ER selectivity was also examined on SIM-A9 cells (semi adherent microglial cells).29 As a type of glial cell located throughout the brain, microglial cells account for 10–15% of all cells found within the brain,30 and ER stress plays a significant role in the microglial cell death.31 Although the ER distribution in GL261 cells is quite different from that in SIM-A9 cells (Fig. 5A and D), colocalization of 2b with the commercial ER-Tracker™ Red revealed the same patterns.
Fig. 5.
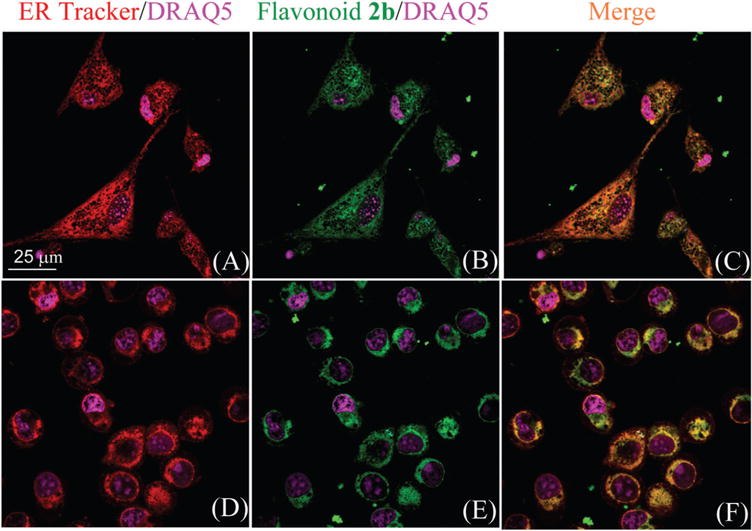
Confocal imaging of GL261 cells (panels A–C) and SIM A9 cells (panels D–F), which were incubated with ER-Tracker (1 μM, panels A and D), flavonoid 2b (500 nM, panels B and E) for 30 minutes. Panels (C) and (F) are the merged images of ER Tracker Red and flavonoid probes. The nuclei of cells were stained with DRAQ5 (shown in purple).
Zebrafish staining
The ability of 2b to penetrate cells (Fig. 3), in addition to its low toxicity, encouraged us to further examine its potential in vivo applications. When zebrafish of 48 hours post fertilization (hpf) was exposed to 2b, bright green fluorescence could be observed from the entire zebrafish (Fig. 6), indicating that flavonoid dye could easily penetrate into the fish for in vivo applications. Interestingly, the detailed cell structure could be clearly visible from the stained zebrafish (Fig. 6C), as the penetrated flavonoid dye did not exhibit fluorescence in aqueous solution.
Fig. 6.
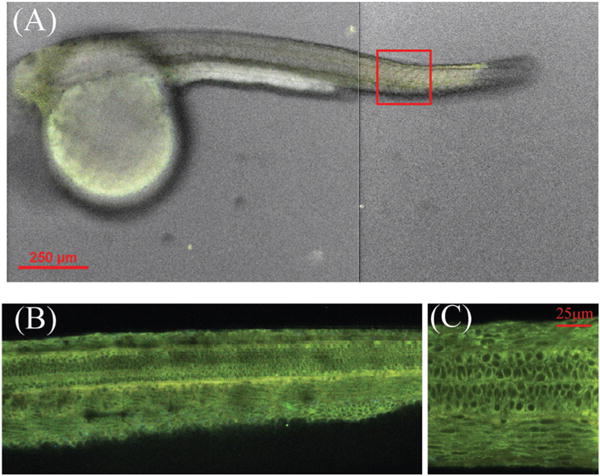
(A) Confocal image of zebrafish (48 hpf) at 10×magnification, after staining with flavonoid dye 2b. The images were taken from the head and tail sections. (B) and (C) Fluorescence confocal images of zebrafish from the tail section (approximate position is shown by a red square), at 20× and 100× magnification, respectively.
Experiment section
Synthesis of 2b
N-(3-Acetyl-4-hydroxyphenyl)butyramide (10 mmol) was added to a solution of 4-(diphenylamino)benzaldehyde (10 mmol) in ethanol (50 mL), then 50 mL of aqueous NaOH (4 g, 100 mmol) solution was added slowly to the solution at 0 °C over 1 hour period. The mixture was stirred at reflux (~80 °C) for 6 hours, and then cooled to room temperature for another 48 hours. H2O2 solution (10 mL of 30%) was slowly added into the reaction solution over 1 hour while cooled in an ice-water bath. After stirring at room temperature for 96 hours, the mixture was poured into ice water and then placed into the refrigerator overnight. The precipitate was collected via filtration, and washed with cold ethanol. The product was purified by recrystallization from ethanol three times. Yield = 17%. 1H NMR (d6-DMSO, 500 MHz): δ = 10.15 (s, 1H, –OH), 9.35 (s, 1H, –NH), 8.43 (d, 1H, J = 3.0 Hz), 8.09 (d, 2H, J = 9.0 Hz), 7. 90 (dd, 1H, J1 = 9.0 Hz, J2 = 2.5 Hz), 7.66 (d, 1H, J = 9.0 Hz), 7.38 (t, 4H), 7.16 (m, 6H), 7.04 (d, 2H, J = 9.0 Hz), 2.37 (t, 2H), 1.65 (m, 2H), 0.95 (t, 3H). 13C NMR (d6-DMSO, 125 MHz): d = 172.76, 171.80, 150.88, 149.06, 146.85, 145.92, 138.44, 136.32, 130.23, 129.39, 125.80, 124.65, 124.50, 121.90, 121.19, 119.13, 113.23, 38.77, 18.96, 14.07. MS, calcd for [C31H26N2O4 + Na]+ m/z: 513.2; found: 513.2.
Synthesis of 2a
Compound 2a was prepared from N-(3-acetyl-4-hydroxyphenyl)-butyramide (50 mmol) and 4-(dimethylamino)benzaldehyde (50 mmol) in ethanol (100 mL) under the same conditions used for 2b. The product was purified by recrystallization from hexane/ethanol (v/v = 1/1). Yield = 21%. 1H NMR (d6-DMSO, 500 MHz): δ = 10.13 (s, 1H, –OH), 9.07 (s, 1H, –NH), 8.40 (d, 1H, J = 2.5 Hz), 8.11 (d, 2H, J = 9.0 Hz), 7.89 (dd, 1H, J1 = 9.0 Hz, J2 = 2.5 Hz), 7.67 (d, 1H, J = 9.0 Hz), 6.85 (d, 2H, J = 9.0 Hz), 3.00 (s, 6H), 2.34 (t, 2H), 1.66 (m, 2H), 0.95 (t, 3H). 13C NMR (d6-DMSO, 125 MHz): d = 157.43, 157.02, 139.20, 138.55, 135.40, 126.91, 125.79, 119.78, 116.29, 113.27, 110.68, 110.24, 105.65, 104.43, 41.42, 40.27, 22.88, 18.58. ESI-MASS m/z calcd for [C21H22N2O4 + H]+: 367.2; found: 367.2.
Fluorescence quantum yield
The fluorescence quantum yields (QY) were measured using rhodamine 6G (sigma) as the standard (Φfl = 0.95, ethanol).26 The fluorescence quantum yields were calculated by using the following equation:
where the subscripts s and r refer to the sample and the standard (rhodamine 6G), respectively. Φ is the quantum yield, F is the integrated emission intensity, A is the absorbance, and n is the refractive index of the solution.
Live imaging
Imaging was performed on a Nikon A1 confocal system with a 100× Plan Apo λ, NA = 1.45 oil objective with both GaAsP dectectors and high sensitivity low noise PMTs for detection. The excitation used for our dyes was 405 nm with standard DAPI, FITC, and Texas Red filters. The ER-Tracker™ was excited using 560 nm and with a 600/50 nm bandpass filter used for emission. The nuclear dye, DRAQ5, was excited at 620 nm and 680/75 nm bandpass filter was used for emission. All imaging was done in an Okolab Bold Cage Incubator at 37 °C, and images were processed using NIS Elements or ImageJ Pro imaging software.
Cell culturing and staining
MO3.13 cells (oligodendrocytes), GL261 cells (astrocyte derived glioblastoma) or SIM A9 cells (semi adherent microglial) were plated on microscopy dishes at a density of 5×10⁵ cells per mL in DMEM media supplemented with 10% FBS and 1% penicillin/streptomycin. Cells were allowed to attach overnight at 37 °C and in 5% CO2. After cells attached, ER-Tracker™ Red (Sigma E34250) was added to the cell media at a final concentration of 1 μM along with a final concentration at 500 nM of the flavonoid dye to be tested. Cells were left to incubate for 2 hours, and then washed 5 times with PBS. Live Cell Imaging Solution (Thermo-Fisher A14291DJ) was then added, along with 10 μM of DRAQ5 (Sigma 62251) fluorescent probe, to stain cell nuclei. Cells were then left to incubate at room temperature for 30 minutes before imaging.
Zebrafish breeding and staining
Zebrafish were maintained as described in the Zebrafish Book by the University of Oregon. They were kept in 28.5 °C water for mating, male and female zebrafish were maintained in one tank on a 12 h light/12 h dark cycle. Spawning was triggered by light stimulation in the morning and eggs were immediately fertilized. All embryos were maintained in E3 medium (15 mM NaCl, 0.5 mM KCl, 1 mM MgSO4, 1 mM CaCl2, 0.15 mM KH2PO4, 0.05 mM Na2HPO4, 0.7 mM NaHCO3, and 10−5% methylene blue at 7.5 pH). All animal related procedures were approved by the Care and Use of Animals in Research Committee at The University of Akron.
A stock solution of the dye was prepared in DMSO at 1 mM. All stains were done at 10 μM with a 12 h incubation time and the fish were washed 3 times with E3 medium to limit potential background noise from aggregates. All fished were anesthetized with 0.5 mL of MS-2,2,2 20–30 minutes prior to imaging to limit movement. Once imaging was completed all the fish were euthanized using excess MS-2,2,2 before disposal.
Conclusion
In summary, we report the first example of flavonoid-based probes for ER sensing in living eukaryotic cells. The D–A type flavonoid 2 exhibits many attractive features, which include fluorescence turn-on, protein interaction, low toxicity, good biocompatibility, efficient cellular uptake, and ER-targeting. The peculiar ER-targeting has been independently observed in all the cell lines examined. The low molecular mass of 2 (<500 Dalton), in addition to its low toxicity, is anticipated to cause less perturbation to cellular function during imaging. It appears that the amide group plays an important role in the observed ER selectivity, as the control compounds without the amide side chain do not exhibit good selectivity to ER (ESI,† Fig. S3). The observed ER selectivity from 2 could be attributed to flavonoid’s binding to specific proteins. Further study will be carried out to fine tune the ER selectivity.
Supplementary Material
Acknowledgments
This work was supported by NIH (Grant No. 1R15EB014546-01A1). We also thank the Coleman endowment from the University of Akron for partial support.
Footnotes
Electronic supplementary information (ESI) available. See DOI: 10.1039/c6tb02456d
References
- 1.Xu C, Bailly-Maitre B, Reed JC. Endoplasmic reticulum stress: cell life and death decisions. J Clin Invest. 2005;115:2656–2664. doi: 10.1172/JCI26373. [DOI] [PMC free article] [PubMed] [Google Scholar]
- 2.Walter P, Ron D. The unfolded protein response: from stress pathway to homeostatic regulation. Science. 2011;334:1081–1086. doi: 10.1126/science.1209038. [DOI] [PubMed] [Google Scholar]
- 3.Kim I, Xu W, Reed JC. Cell death and endoplasmic reticulum stress: disease relevance and therapeutic opportunities. Nat Rev Drug Discovery. 2008;7:1013–1030. doi: 10.1038/nrd2755. [DOI] [PubMed] [Google Scholar]
- 4.Yoshida H. ER stress and diseases. FEBS J. 2007;274:630–658. doi: 10.1111/j.1742-4658.2007.05639.x. [DOI] [PubMed] [Google Scholar]
- 5.Todd DJ, Lee AH, Glimcher LH. The endoplasmic reticulum stress response in immunity and autoimmunity. Nat Rev Immunol. 2008;8:663–674. doi: 10.1038/nri2359. [DOI] [PubMed] [Google Scholar]
- 6.Fu S, Watkins SM, Hotamisligil G. The Role of Endoplasmic Reticulum in Hepatic Lipid Homeostasis and Stress Signaling. Cell Metab. 2012;15:623–634. doi: 10.1016/j.cmet.2012.03.007. [DOI] [PubMed] [Google Scholar]
- 7.Ozcan L, Tabas I. Role of Endoplasmic Reticulum Stress in Metabolic Disease and Other Disorders. Annu Rev Med. 2012;63:317–328. doi: 10.1146/annurev-med-043010-144749. [DOI] [PMC free article] [PubMed] [Google Scholar]
- 8.van Bergeijk P, Hoogenraad CC, Kapitein LC. Right Time, Right Place: Probing the Functions of Organelle Positioning. Trends Cell Biol. 2016;26:121–134. doi: 10.1016/j.tcb.2015.10.001. [DOI] [PubMed] [Google Scholar]
- 9.Baumann N, Pham-Dinh D. Biology of Oligodendrocyte and Myelin in the Mammalian Central Nervous System. Physiol Rev. 2001;81:871–927. doi: 10.1152/physrev.2001.81.2.871. [DOI] [PubMed] [Google Scholar]
- 10.Pfeiffer SE, Warrington AE, Bansal R. The oligodendrocyte and its many cellular processes. Trends Cell Biol. 1993;3:191–197. doi: 10.1016/0962-8924(93)90213-k. [DOI] [PubMed] [Google Scholar]
- 11.Praet J, Guglielmetti C, Berneman Z, Van der Linden A, Ponsaerts P. Cellular and molecular neuropathology of the cuprizone mouse model: clinical relevance for multiple sclerosis. Neurosci Biobehav Rev. 2014;47:485–505. doi: 10.1016/j.neubiorev.2014.10.004. [DOI] [PubMed] [Google Scholar]
- 12.Dhaunchak AS, Nave KA. A common mechanism of PLP/DM20 misfolding causes cysteine-mediated endoplasmic reticulum retention in oligodendrocytes and Pelizaeus–Merzbacher disease. Proc Natl Acad Sci U S A. 2007;104:17813–17818. doi: 10.1073/pnas.0704975104. [DOI] [PMC free article] [PubMed] [Google Scholar]
- 13.Wu J, Liu W, Ge J, Zhang H, Wang P. New sensing mechanisms for design of fluorescent chemosensors emerging in recent years. Chem Soc Rev. 2011;40:3483–3495. doi: 10.1039/c0cs00224k. [DOI] [PubMed] [Google Scholar]
- 14.Meinig JM, Fu L, Peterson BR. Synthesis of Fluorophores that Target Small Molecules to the Endoplasmic Reticulum of Living Mammalian Cells. Angew Chem, Int Ed. 2015;54:9696–9699. doi: 10.1002/anie.201504156. [DOI] [PMC free article] [PubMed] [Google Scholar]
- 15.Ashcroft FM, Gribble FM. Correlating structure and function in ATP-sensitive K+ channels. Trends Neurosci. 1998;21:288–294. doi: 10.1016/s0166-2236(98)01225-9. [DOI] [PubMed] [Google Scholar]
- 16.Hambrock A, Löffler-Walz C, Quast U. Glibenclamide binding to sulphonylurea receptor subtypes: dependence on adenine nucleotides. Br J Pharmacol. 2002;136:995–1004. doi: 10.1038/sj.bjp.0704801. [DOI] [PMC free article] [PubMed] [Google Scholar]
- 17.Smith AJ, Taneja TK, Mankouri J, Sivaprasadarao A. Molecular cell biology of KATP channels: implications for neonatal diabetes. Expert Rev Mol Med. 2007;9:1–17. doi: 10.1017/S1462399407000403. [DOI] [PubMed] [Google Scholar]
- 18.Nijveldt RJ, van Nood E, van Hoom DE, Boelens PG, van Norren K, van Leeuwen PA. Flavonoids: a review of probable mechanisms of action and potential applications. Am J Clin Nutr. 2001;74:418–425. doi: 10.1093/ajcn/74.4.418. [DOI] [PubMed] [Google Scholar]
- 19.Garcia-Lafuente A, Guillamon E, Villares A, Rostagno MA, Martinez JA. Flavonoids as anti-inflammatory agents: implications in cancer and cardiovascular disease. Inflammation Res. 2009;58:537–552. doi: 10.1007/s00011-009-0037-3. [DOI] [PubMed] [Google Scholar]
- 20.Klymchenko AS, Duportail G, Mely Y, Demchenko AP. Ultrasensitive two-color fluorescence probes for dipole potential in phospholipid membranes. Proc Natl Acad Sci U S A. 2003;100:11219–11224. doi: 10.1073/pnas.1934603100. [DOI] [PMC free article] [PubMed] [Google Scholar]
- 21.Liu B, Shah M, Ge Z, Liu Q, Pang Y. Biocompatible Flavone-Based Fluorogenic Probes for Quick Wash-Free Mitochondrial Imaging in Living Cells. ACS Appl Mater Interfaces. 2014;6:21638–21644. doi: 10.1021/am506698f. [DOI] [PMC free article] [PubMed] [Google Scholar]
- 22.Liu B, Pang Y, Bouhenni R, Duah E, Paruchuri S, McDonald L. A step toward simplified detection of serum albumin on SDS-PAGE using an environment-sensitive flavone sensor. Chem Commun. 2015;51:11060–11063. doi: 10.1039/c5cc03516c. [DOI] [PMC free article] [PubMed] [Google Scholar]
- 23.Gormley TR, O’Sullivan WI. Flavanoid epoxides XIII: acid and base catalysed reactions of 2′-tosyloxychalcone epoxides. Mechanism of the algar-flynn-oyamada reaction. Tetrahedron. 1973;29:369–373. [Google Scholar]
- 24.Liu B, Wang J, Zhang G, Bai R, Pang Y. Flavone-Based ESIPT Ratiometric Chemodosimeter for Detection of Cysteine in Living Cells. ACS Appl Mater Interfaces. 2014;6:4402–4407. doi: 10.1021/am500102s. [DOI] [PMC free article] [PubMed] [Google Scholar]
- 25.Shynkar VV, Klymchenko AS, Piemont E, Demchenko AP, Mely Y. Dynamics of Intermolecular Hydrogen Bonds in the Excited States of 4′-Dialkylamino-3-hydroxyflavones. On the Pathway to an Ideal Fluorescent Hydrogen Bonding Sensor. J Phys Chem A. 2004;108:8151–8159. [Google Scholar]
- 26.Magde D, Wong R, Seybold PG. Fluorescence Quantum Yields and Their Relation to Lifetimes of Rhodamine 6G and Fluorescein in Nine Solvents: Improved Absolute Standards for Quantum Yields. Photochem Photobiol. 2002;75:327–334. doi: 10.1562/0031-8655(2002)075<0327:fqyatr>2.0.co;2. [DOI] [PubMed] [Google Scholar]
- 27.Iwata K, Café-Mendes CC, Schmitt A, Steiner J, Manabe T, Matsuzaki H, Falkai P, Turck CW, Martins-de-Souza D. The human oligodendrocyte proteome. Proteomics. 2013;13:3548–3553. doi: 10.1002/pmic.201300201. [DOI] [PubMed] [Google Scholar]
- 28.Suzuki K, Gerelchuluun A, Hong Z, Sun L, Zenkoh J, Moritake T, Tsuboi K. Celecoxib enhances radiosensitivity of hypoxic glioblastoma cells through endoplasmic reticulum stress. Neuro-Oncology. 2013;15:1186–1199. doi: 10.1093/neuonc/not062. [DOI] [PMC free article] [PubMed] [Google Scholar]
- 29.Nagamoto-Combs K, Kulas J, Combs CK. A novel cell line from spontaneously immortalized murine microglia. J Neurosci Methods. 2014;233:187–198. doi: 10.1016/j.jneumeth.2014.05.021. [DOI] [PMC free article] [PubMed] [Google Scholar]
- 30.Lawson LJ, Perry VH, Gordon S. Turnover of resident microglia in the normal adult mouse brain. Neuroscience. 1992;48:405–415. doi: 10.1016/0306-4522(92)90500-2. [DOI] [PubMed] [Google Scholar]
- 31.Costa BM, Yao H, Yang L, Buch S. Role of Endoplasmic Reticulum (ER) Stress in Cocaine-Induced Microglial Cell Death. J Neuroimmune Pharmacol. 2013;8:705–714. doi: 10.1007/s11481-013-9438-8. [DOI] [PMC free article] [PubMed] [Google Scholar]
Associated Data
This section collects any data citations, data availability statements, or supplementary materials included in this article.


