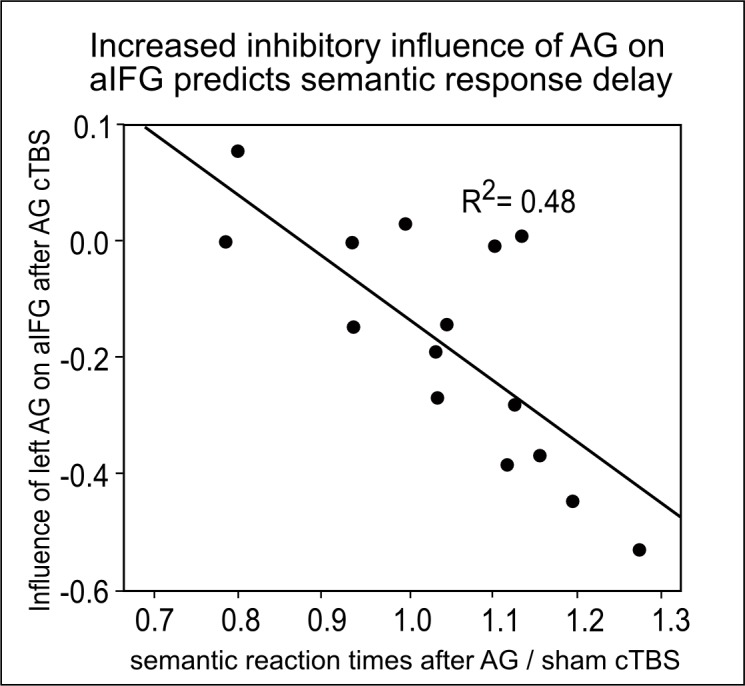
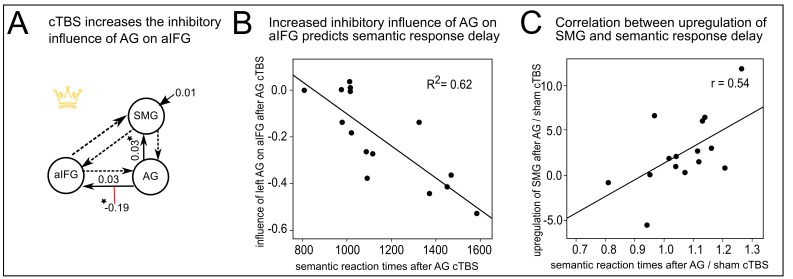
Figure 5. Effective connectivity in the semantic network.
(A) The winning DCM model assumed modulation of the connection from left AG to aIFG by cTBS of left AG. Mean parameter estimates are given for the significant driving input to SMG, the facilitatory intrinsic connections from AG to aIFG and SMG (solid arrows) and the inhibitory modulation of the connection from AG to aIFG by cTBS over AG (red line), (*)survived a Bonferoni-Holm correction. (B) Regression analysis. The increase in the inhibitory influence of AG on aIFG after AG cTBS predicted the individual semantic response delay. (C) The degree of the individual upregulation of left SMG after cTBS of AG (effect sizes for AG/sham extracted from the effect of interest at x,y,z= −45,–40, 46) was significantly correlated with the delay in semantic response speed after AG/sham cTBS.
Figure 5—figure supplement 1. Illustration of the different DCM-models.
Figure 5—figure supplement 2. Regression analysis.


