. 2017 May 26;6:e27389. doi: 10.7554/eLife.27389

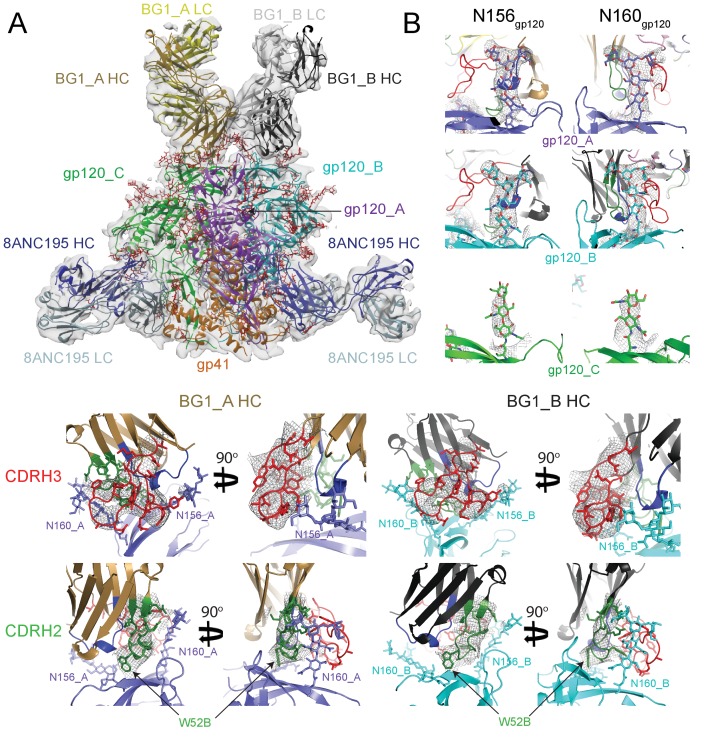
Figure 3. ~6.2 Å cryo-EM reconstruction of a BG1-Env-8ANC195 complex.

(A) EM density fit by coordinates for BG1_A (HC in brown; LC in yellow), BG1_B (HC in dark gray; LC in light gray), gp120s associated with BG1_A and BG1_B Fabs in purple and cyan, respectively; gp120_C in green, gp41 in orange, and 8ANC195 Fabs in dark blue (HC) and light blue (LC). (B) Close-up views of densities contoured at 6.0σ (0.0378 e/Å3) for glycans attached to Asn156gp120 and Asn160gp120 in the three gp120 protomers of Env trimer. Glycan residues built into the cryo-EM map densities are shown as sticks with oxygen atoms in red and nitrogen atoms in blue. (C, D) Close-up views of densities contoured at 6.0σ (0.0378 e/Å3) surrounding CDRH3 (panel C) and CDRH2 (panel D) in BG1-gp120_A and BG1_B-gp120_B interactions. Asn156gp120 and Asn160gp120 glycans are shown as sticks. CDRH2 residue Trp54 (Figure 1D) is identified with an arrow.

DOI: http://dx.doi.org/10.7554/eLife.27389.008

Figure 3.

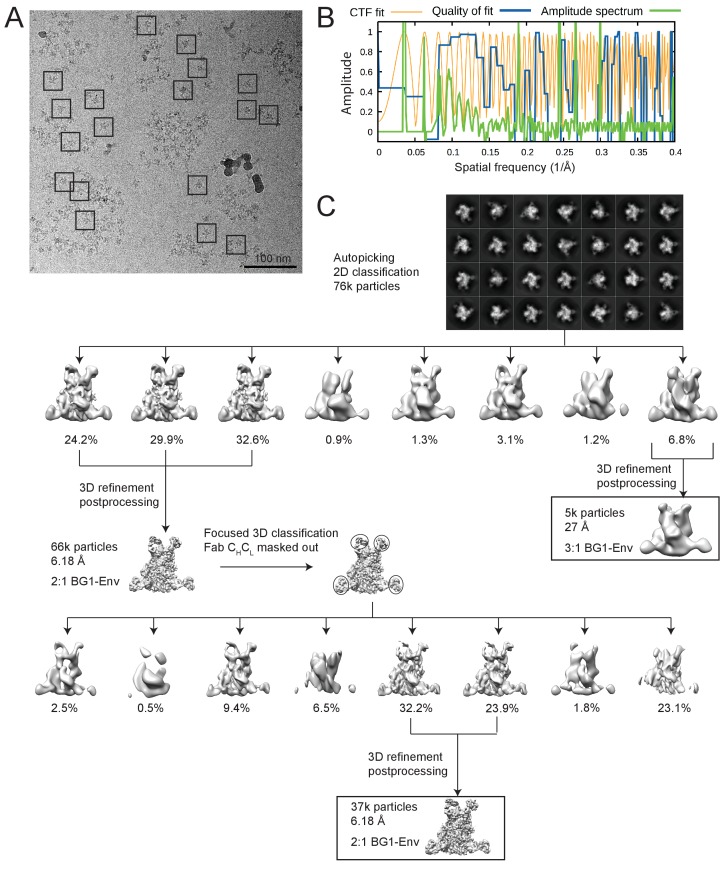
Figure 3—figure supplement 1. Cryo-EM data processing for the BG1-Env-8ANC195 complex structure.

Figure 3—figure supplement 1.

(A) Representative micrograph. Examples of complex particles are boxed. The accumulated dose and defocus values were ~80 e-/Å2 and ~1.8 µm underfocus. (B) CTF fitting of the left micrograph (generated using CTFFIND4) shows a good fit to 4.9 Å. (C) Data processing scheme. 2D classification of autopicked particles resulted in 76K particles that were 3D classified using a low-pass-filtered negative-stain 2:1 BG1-Env EM structure as a reference model. The particles from the best three 3D classes were refined to 6.18 Å resolution. One 3D class showed three BG1 bound to each Env trimer (see Figure 3—figure supplement 2). The particles in 6.18 Å reconstruction were further 3D classified with the Fab CHCL domains masked out. Then the best two 3D classes were refined to 6.18 Å resolution. (E) Gold-standard FSCs of reconstructions generated using different strategies (see Figure 3—figure supplement 2). (F) Local resolution estimation. The complex is shown from top (left), side (middle), and bottom (right) views.
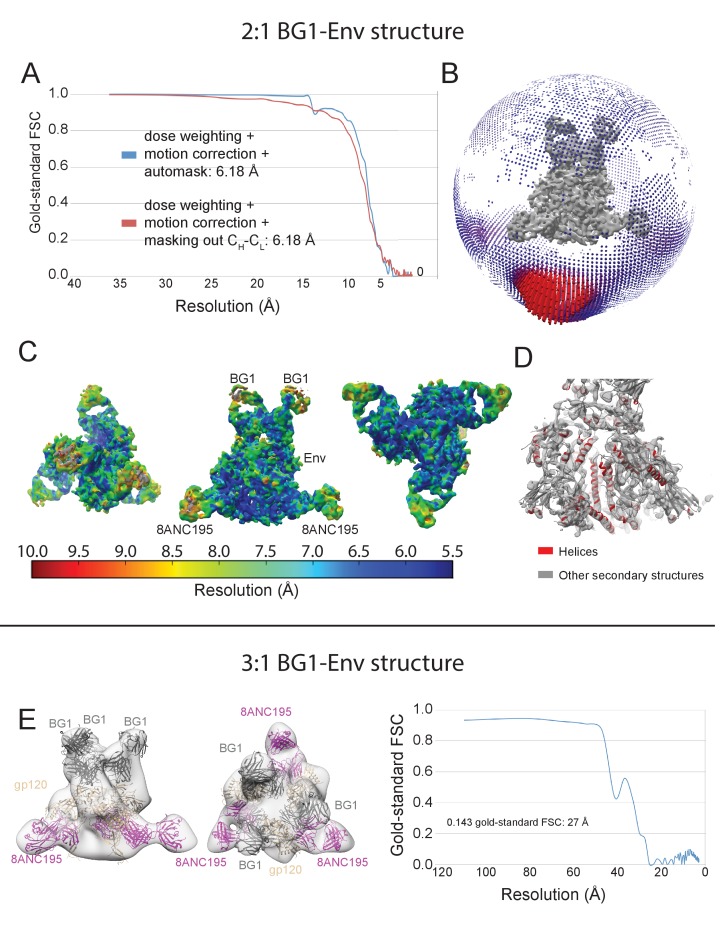
Figure 3—figure supplement 2. Validation of the 2:1 and 3:1 BG1-Env structures.

Figure 3—figure supplement 2.

(A) Gold-standard FSCs of 2:1 BG1-Env reconstructions generated using different strategies. (B) Orientation distribution of the 6.2 Å 2:1 BG1-Env reconstruction without masking out Fab CHCL domains. (C) Local resolution estimation for the 2:1 BG1-Env structure. The complex is shown from top (left), side (middle), and bottom (right) views. (D) Cryo-EM map contoured to show densities for α-helices (red); other secondary structures shown in grey. (E) 27 Å cryo-EM structure of a 3:1 BG1-Env complex. Cryo-EM map with fitted components are shown from side (left) and top (middle) views. Right: Gold-standard FSC indicating 27 Å resolution for the reconstruction.