Abstract
Retinal neurons and Müller glia are generated from a common population of multipotent retinal progenitor cells. We purposed to identify Müller glia-specific molecular signatures during retinal development. Using transgenic mice carrying the Hes1 promoter (pHes1) followed by EGFP, we purified EGFP-positive Müller glia and other EGFP-negative retinal cells from developing retinas and subjected them to RNA sequencing analysis. Gene expression pattern of EGFP-positive cell was similar to genes expressed in retinal progenitors, and they were downregulated in other cell lineages. Then, we examined the modification profiles of H3K27me3 and H3K4me3 by referring to chromatin immunoprecipitation-sequencing data of rods and other cells. Clustering of the H3K4me3 and H3K27me3 values followed by ontology analysis revealed a high incidence of transcription factors including Hes1 in clusters with high H3K27me3 levels. Hes1 expression level decreased dramatically, and the H3K27me3 level at the Hes1-locus was upregulated strongly during retinal development. Furthermore, the Hes1 expression level was upregulated in an Ezh2-knockout retina. These results suggest that downregulation of Müller glia-related genes in other lineage rather than upregulation of them in Müller glia contributed Müller-specific molecular features, and a role for modified H3K27me3 in suppressing Müller glia-related genes in other retinal cell lineages to avoid unfavorable expression.
Introduction
The vertebrate neural retina is organized into a laminar structure comprising multiple types of neurons and glial cells. Müller glia are the only glial cells derived from retinal progenitors, and their cell bodies are localized in the inner nuclear layer (INL). The major retinal cell classes in mice, including Müller glia, are generated from a common population of multipotent retinal progenitor cells that appear between embryonic day (E)11 and postnatal day (P)10 in a conserved temporal order1. This process is regulated by various molecular mechanisms, including transcriptional and post-transcriptional regulation.
We have been analyzing the roles of histone H3K27 methylation in retinal development2,3. Di and trimethylation of lysine 27 on histone H3 (H3K27me2/3) by Ezh2/Kmt6 together with polycomb repressive complex 2 acts as a gene repression mechanism4–6. We reported previously that the H3K27me3-specific demethylase Jmjd3 plays pivotal roles in maturing subsets of bipolar cells by demethylating Vsx1 and Bhlhb4 gene loci, which are essential for maturation of bipolar subsets2. On the other hand, the eyes of Ezh2 retina specific-knockout mice are microphthalmic, and postnatal proliferation is diminished3,7. In addition, early-onset rod photoreceptors and Müller glia cells are observed in these mice. These results suggest a role for H3K27me3 in defining the timing of neurogenesis and gliogenesis, and that a more detailed analysis of the cell lineage-specific roles of H3K27me3 is necessary. In contrast, H3K4me3, which is one of most well-studied histone methylations, acts on transcription of target genes8, and reportedly plays a role in photoreceptor differentiation9.
The rod photoreceptors constitute more than 70% of all cells in the mouse retina; therefore, data obtained using the whole retina often represent the rod photoreceptors. To explore the molecular signature of rods and other retinal subsets, we examined the H3K4me3 and H3K27me3 modifications of the rod lineage and those of other cells independently using purified developing retinal subsets. Commitment to the rod lineage occurs from E12 to P7–8 in mice, and peak differentiation occurs after birth10,11. We purified rod and photoreceptor precursors using specific expression of the cell surface marker Cd7312 from postnatal developing retinas, and we also purified the Cd73-negative population, which consists of interneurons, Müller glia, and RGCs. RNA sequencing (RNA-seq) and chromatin immunoprecipitation sequencing (ChIP-seq) for H3K4me3 and H3K27me3 were performed13.
In this study, we focused on Müller glia-specific molecular events using the retinas from Hes1 promoter-enhanced green fluorescent protein (EGFP) transgenic mice.
Methods
Mice
All animal experiments were approved by the Animal Care Committee of the Institute of Medical Science, University of Tokyo and conducted in accordance with the ARVO (Association for Research in Vision and Ophthalmology) statement for the use of animals in ophthalmic and vision research. ICR mice were obtained from Japan SLC Co. The transgenic mice of 2.5-kb promoter of Hes1 followed by destabilized EGFP (pHes1-EGFP mouse)14 was kindly provided by Dr. Ryoichiro Kageyama.
RNA sequencing (RNA-seq) and quantification
Total RNA was extracted from stored purified cell pellets using RNeasy Plus Micro Kit (Qiagen), and RNA quality was confirmed using a 2100 Bioanalyzer (Agilent Technologies). RNA-seq was done as previously described13,15. The original data set were deposited in GEO (GSE86199). The sequence reads were aligned to the mouse reference genome assembly (NCBI37/mm9) using TopHat (v2.0.8b) with the option (–coverage-search –max-multihits 50)16. Then, fragments per kilobase of exon per million mapped fragments (FPKM) was calculated from the aligned reads by using CuffLinks (v2.1.1) with the default option16 as previously described13. By using CuffLinks, 23,021 genes expression values (FPKM) were estimated, and small RNAs such as miRNAs were excluded, and remaining 19,954 genes were subjected to following analyses. K-means clustering was done using GeneSpring software (v. 12.6.1; Agilent Technologies). Flow of data analysis is shown in Supplemental Fig. 1. To verify H3K27me3 levels of genes in the clusters in pHes1_EPC and pHes1_ENC, three representative genes in each cluster were selected as follows. For each gene, the sum total of H3K27me3 level of Cd73 (P2N, P2P, P5N, P5P) was calculated, and top 18 genes from the biggest value were selected. Then, a square value of difference between P2N and P2P, and P5N and P5P were calculated. For C1, C2, C4, and C5 top 3 genes with from smallest difference were selected, and for C3, C6, and C7, top 3 genes with largest difference were selected as representative genes.
Immunostaining, Retinal explant culture, RT-qPCR, ChIP-quantitative polymerase chain reaction (ChIP-qPCR), and data mining of ChIP-sequencing results
Immunostaining of sections was done as described previously17. Primary antibodies, anti-EGFP (Chicken polyclonal, Abcam ab13970202) and anti-Glutamine synthetase antibody (Mouse monoclonal, Chemicon MAB30219), were visualized by using Alexa Fluor 488 or 594 dyes conjugated second antibodies (Molecular Probes), respectively. Samples were mounted in PBS containing 50% glicerol and analyzed by using a Zeiss Axio Vision 4.6 microscope. Retinal explant culture was performed at 34 °C on a chamber filter (Millicell) as previously described17. ChIP-qPCR was done as previously described2. For RT-qPCR, total RNA was purified from homogenized tissues using Sepasol RNA I Super G (nacalai tesque), and cDNA was synthesized using ReverTra Ace pPCR RT Master Mix (TOYOBO). Quantitative PCR (qPCR) was performed using the SYBR Green-based method, using the Roche Light Cycler 96 (Roche Diagnostics). Glyceraldehyde 3-phosphate dehydrogenase (Gapdh) was used as an internal control. The binding of Ezh2 was examined using anti-Ezh2 antibody (Active Motif, 39875) and mouse IgG (BioLegend, 401302). The histone modification value of H3K4me3 and H3K27me3 were calculated as follows. For test samples and input samples, the 1050 bp-window tags (50 bp sliding) were counted, and number of tags at each position was divided by the number of total tags. The values of the test samples were subtracted by that of input samples at each genome position. The values were converted into log2 scale, and the averaged values in TSS +/−5 kb (Refseq genes except for small RNAs) were subjected to quantile normalization.
Statistical analysis
For Figs 1, 2 and 3, the p values were calculated by student’s T test, and effect size of the results was examined by Pearson’s correlation coefficient (r).
Figure 1.
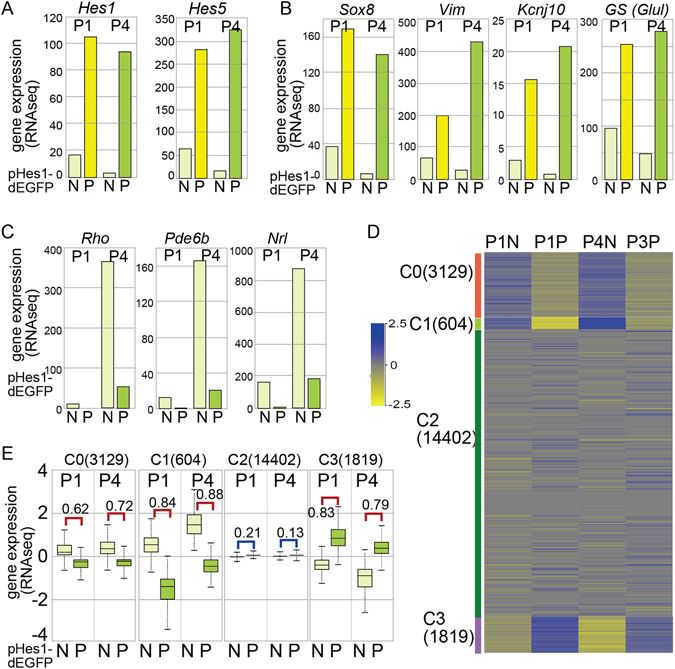
Fractionation of retinal cells by EGFP expression from pHes1-EGFP transgenic mouse retina. (A,B,C) RNA-seq using purified EGFP positive (P) and negative (N) cells of retina from pHes1-EGFP mouse at P1 and P4 was done. RNA-seq values of genes related to Müller glia (A,B) or photoreceptor (C) are shown. (D,E) Unsupervised K-means clustering of all genes on the RNA-seq to generate 4 clusters was done (D), and the distribution of gene expression of the clusters 0, 1, 2, and 3 in pHes1-EGFP positive (P) and negative (N) populations are shown (E). Numbers in parentheses are gene number in each cluster. Statistical analysis was done by student’s t test, and effect size of the results was examined by Pearson’s correlation coefficient (r) and indicated in the figure. N, negative; P, positive.
Figure 2.
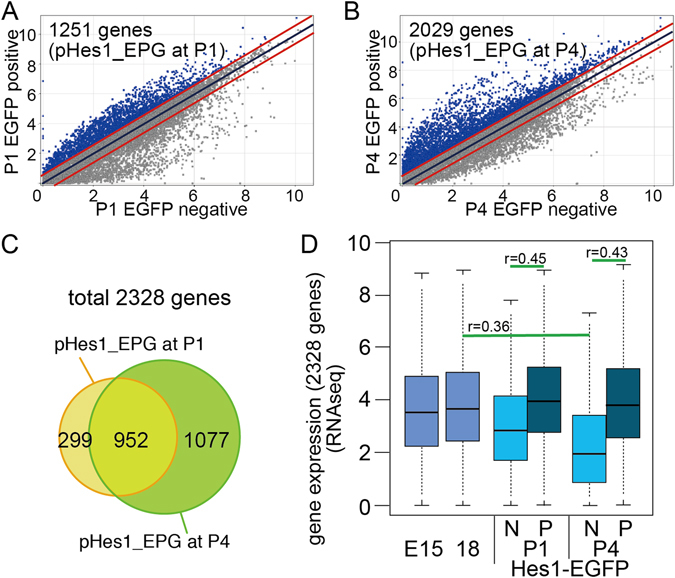
Identification of pHes1-EGFP positive cell specific genes. (A,B) Global gene expression levels of EGFP negative (horizontal axis) and EGFP positive (vertical axis) pattern of RNA-seq derived from P1 (A) and P4 (B) pHes1-EGFP mouse retina. Diagonal lines indicate median (middle line) and +/− 2 fold difference values (upper and lower lines). Genes predominantly expressed in either fraction was designated as pHes1-EPG and pHes1-ENG only if expressed at >2 fold than opponent fraction. (C) Venn diagram showing overlapping of genes of pHes1-EPG at P1 vs. pHes1-EPG at P4. (D) Average and distribution of gene expression levels of 2,328 genes, which expressed in higher in pHes1-EPG at P1 and/or P4. RNA-seq data of whole retina at E15 and E1813, and pHes1-EPC and -ENC are shown. N, negative; P, positive. The p values were calculated by student’s T test, and effect size of the results was examined by Pearson’s correlation coefficient (r).
Figure 3.
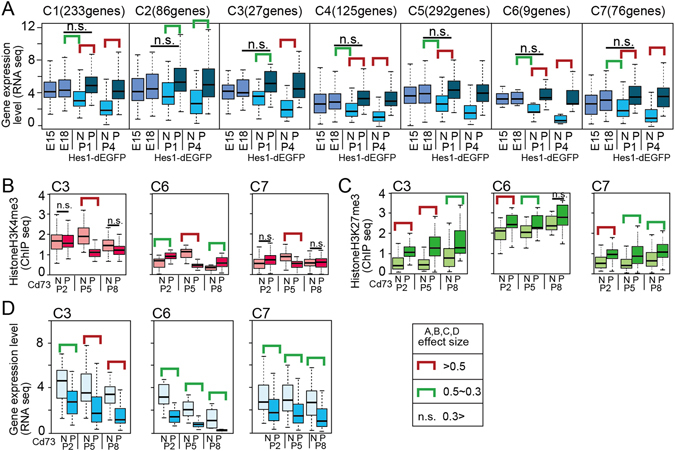
Characterization of genes commonly upregulated in P1 and P4 pHes1 EGFP positive cell populations. (A) Genes that expressed higher levels in pHes1-EPC than in pHes1-ENC at both P1 and P4 were sub-clustered to C1 to C7 by using their values of H3K4me3 and H3K27me3 ChIP-seq of Cd73_P and Cd73_N retinal fractions13. Average and distribution of gene expression levels (RNA-seq) are shown by box plot. RNA-seq data obtained from whole retina at E15 and E1813 are also shown. (B–D) Distribution of H3K4me3 (ChIP-seq, B), H3K27me3 (ChIP-seq, C), and transcripts level (RNA-seq, D) of genes in each sub-cluster are shown. ChIP-seq and RNA-seq were performed by using Cd73_P and Cd73_N retinal sub-fractions at P2, P5, and P813. Green and red bars indicate statistical significant. p values were calculated by student’s T test, and effect size of the results was examined by Pearson’s correlation coefficient (r). r; Red bar >0.5, 0.5> green bar >0.3, n.s. <0.3.
Primers sequences for qPCR
Hes1 5′-cggtctacaccagcaacagt-3′, 5′-aagagagaggtgggctaggg-3′
Ezh1 5′-catgacccagaacttttgtgaa-3′, 5′-gacaaccaggaaagcgattc-3′
Primers not listed had been published previously in ref.2.
Primer sequences for ChIP-qPCR
Epha3 5′-aaaacggaatggctcccaag-3′, 5′-ttgctggtggggtaggaaag-3′
Chst11 5′-tgtcacctaacctgcttctcg-3′, 5′-tgcgtgaacgtttccatgac-3′
Al504432 5′-aagccagtgagagtcagtgtac-3′, 5′-tctgcttttccagtgctgtg-3′
Grid2 5′-aaaaaccgtcaaggcaggtg-3′, 5′-aaaaccgcgctctcaattcc-3′
Irx5 5′-acacaaggcgtcagaatcctc-3′, 5′-gggctctgcttttggctttg-3′
Tubb6 5′-actaacagtaccgtggtgcag-3′, 5′-ttggtcctgacagctggaac-3′
Cdc42ep1 5′-aggtcatctaaggagcagtgg-3′, 5′-tcgggaatgttcgctctgtc-3′
Ugt8a 5′-tctggagcggagactttgatg-3′, 5′-tcaagccgtctctcaaacctc-3′
Il1rap 5′-tcttcagtggagcacaacgg-3′, 5′-aacgtgcaaggaagggctag-3′
Irx3 5′-caactttaagccgccttagctc-3′, 5′-gcttttgctcacctttctgc-3′
Cyp26a1 5′-aacccaggactccaaattccc-3′, 5′-tctttccttgtcctaggtgtgc-3′
Sox3 5′-aagctctcatcacgtcactcg-3′, 5′-tgatgagtcctggccaatcaac-3′
Fxyd7 5′-tttcggacaccccttgctg-3′, 5′-ttttcgcacaagaggcactg-3′
Fxyd1 5′-atcaaaggctggcagaacac-3′, 5′-tgctaggtttcctgggaatcag-3′
Cyr61 5′-gccaaccaacattcctgagatg-3′, 5′-agcccgccctttataatgcc-3′
Itgb8 5′-acctgtggaagaagctagcac-3′, 5′-tcacagggtgatgctgctttag-3′
Ccnd1 5′-acattcttccttggcttgcg-3′, 5′-ggggcttctttccctaagagg-3′
Irs1 5′-ccggaatgtagagcgagcag-3′, 5′-agaggagcaaaacacgtgac-3′
Oaf 5′-aagccagcctagaccacaaag-3′, 5′-aacagaaaccaccaggacctg-3′
Etv5 5′-gacctctgagggcgttgag-3′, 5′-tcttcaggcaaatccagctg-3′
Hey2 5′-cctctgccaacgcctctc-3′, 5′-acggtgtggctttctattgg-3′
Construction of plasmids encoding sh-RNA against Ezh1
For the construction of the shRNA vectors, a target sequence was selected using Gene Link RNAi Explorer (http://www.genelink.com). BLAST analysis showed no homology between each target sequence and any other sequence in the mouse genome database. Double-stranded DNA for the target sequences was constructed as previously18 using pU6 shRNA expression vector19. Target sequences are as follows; sh-Ezh1_1: 5′-gaaagataacaattctacaca-3′, sh-Ezh1_2: 5′-gaattcatttctgaatattgt-3′.
Flow cytometry and cell sorting
Retinas were isolated from enucleated eyes, and incubated with 0.25% Trypsin in PBS (500 μl) for 15 minutes at 37 °C. Samples were treated with DNaseI and stained with propidium iodide. EGFP positive and negative fractions were purified by using MoFlo cell sorter (Beckman Coulter). Purified cells were stored at −80 °C as cell pellet until use for RNA-seq.
Ingenuity pathway analysis
Categorized genes were imported into the Ingenuity Pathway Analysis (IPA; QIAGEN bioinformatics; https://www.qiagenbioinformatics.com/products/ingenuity-pathway-analysis/). In IPA each gene was assigned molecular type or biological function such as transcription regulator, cytokine, growth factor, and so on. The basis of the IPA program consists of the Ingenuity Pathway Knowledge Base (IPKB) which is derived from known functions and interactions of genes published in the literature.
Results
Comprehensive analysis of the gene expression patterns of Hes1 promoter (pHes1)-driven EGFP-positive and -negative populations
Hes1 is a well-known transcription factor expressed by Müller glia in the retina20. Transgenic mice harboring the 2.5-kb Hes1 promoter followed by dEGFP (pHes1-EGFP) expressed EGFP in almost all Müller glia in the postnatal retina14. We confirmed that specific expression of EGFP continued in Müller glia in the adult retina (Supplemental Fig. 2A and B).
To analyze the molecular signatures of the Müller glia, we purified pHes1-driven EGFP-positive cells (pHes1_EPCs) and -negative cells (pHes1_ENCs) at P1 and P4 using a cell sorter, and the purified cells were subjected to RNA-seq analysis. The RNA-seq data showed approximately 10- and 30-fold greater enrichment of Hes1 transcripts in the pHes1_EPC population than in the pHes1_ENC population at P1 and P4, respectively (Fig. 1A). Similar results were obtained for Hes5 expression (Fig. 1A). We then analyzed the expression of known genes expressed specifically in retinal sub-populations. Müller glia-specific genes21–24 were expressed dominantly in pHes1_EPCs (Fig. 1B). Expression of the rod photoreceptor-specific genes was low in both fractions at P1 because rod differentiation occurs mainly postnatally and was expressed in pHes1_ENCs at P4 (Fig. 1C).
To verify the RNA-seq data, we performed unsupervised K-means clustering and all genes in the RNA-seq to generate four clusters, which provided good resolution (Table S1). The gene expression levels (log transformed) across the four samples are shown as a heat map (Fig. 1D). Genes with higher median expression levels in pHes1-ENCs than in pHes1-EPCs were clustered as 0 and 1 (Fig. 1E). We subjected genes in clusters 0, 1, and 3 to an Ingenuity Pathway Analysis (Table S1). The genes categorized as transcription regulators are shown in Table S1. Transcription factors known to be involved in differentiation of Müller glia were found in C3 (Table S1, C3_TF), and those in the photoreceptor cell lineage were found in C1 (Table S1, C1_TF). These results confirm that pHes1-driven EGFP-dependent separation of retinal cells helped purify the Müller glia population.
Identification of Müller glia-specific genes
We considered pHes1-positive population-specific genes only if they had more than 2-fold higher absolute expression levels in pHes1_EPCs than in pHes1_ENCs. In total, 1,251 and 2,029 genes at P1 and P4, respectively, were listed as pHes1_EPC-specific genes (pHes1_EPGs) (Fig. 2A,B, genes above upper red line). Among them, 952 genes were upregulated in common in the pHes1_EPC population at P1 and P4 (Fig. 2C), therefore total 2,328 genes were identified as genes expressed in Hes1-EPC.
Interestingly, when we examined the expression levels of the 2,328 genes in retinal progenitors using our RNA-seq data13, the average levels of the genes in progenitors at E15 and E18 and in Hes1-positive cells were similar, and it was down regulated at Hes1-negative population at P4 (Fig. 2D). We then characterized the histone modifications at Müller glia-specific gene loci. We had previously performed a ChIP-seq analysis of H3K4me3 and H3K27me3 using Cd73-positive rod photoreceptors (Cd73_PCs) and other Cd73-negative cells (Cd73_NCs), including Müller glia in the developing mouse retina13. As photoreceptors constitute more than 70% of the total retinal population, signals from retinal sub-fractions other than rods should be stronger in the Cd73_NC population compared with that in the entire retina, although the values are the sum of multiple retinal sub-populations. Among the 952 genes (Fig. 2C), H3K4me3 and H3K27me3 values of 848 genes were detected in the ChIP-seq data13. We clustered the 848 genes by hierarchical clustering using the H3K4me3 and H3K27me3 values in Cd73_PCs and Cd73_NCs and obtained seven clusters, which were designated C1–C7 (Fig. 3A and Table S2). As expected, average RNA-seq values in the clusters were higher in pHes1_EPCs than in pHes1_ENCs (Fig. 3A). We had previously performed an RNA-seq analysis of retinal progenitors using whole retinas at E15 and E1813. Again, RNA-seq values of E18 retinas and pHes1_EPCs did not differ significantly; however, those of E18 retinas and pHes1_ENCs at P1 differed significantly in C1, 4, 5, 6, and 7 (Fig. 3A). These results suggested that pHes1_EPCs exhibited a gene expression pattern similar to that of retinal progenitor cells, and that the expression levels of genes specific to pHes1_ENCs decreased compared to genes in other cell lineages. We performed clustering using the H3K4me3 and H3K27me3 values. The H3K4me3 values were generally low and were particularly low in Cd73_PCs (Fig. 3B and Supplemental Fig. 3A). These results are consistent with higher expression of genes in the Cd73_NC population than the Cd73_PC population (Fig. 3D and Supplemental Fig. 3C), as Müller glia are included in the Cd73_NC population.
H3K27me3 levels were very low with no difference between Cd73_NCs and Cd73_PCs in the clusters except for C3, C6, and C7, which showed significantly higher levels in Cd73_PCs than in Cd73_NCs (Fig. 3C and Supplemental Fig. 3B). The genes in C3 and C6 showed very low expression levels in the Cd73_PC population, which was consistent with higher levels of H3K27me3 in Cd73_PCs (Fig. 3C,D and Supplemental Fig. 3B,C).
Differential H3K27me3 levels of pHes1_EPC-specific genes loci in pHes1-EPC and pHes1-ENC
We then examined H3K27me3 levels of representative genes of each cluster in pHes1-EPC and pHes1-ENC at P1 and P4. The genes examined were selected as described in Methods section, H3K27me3 modification levels of the gene loci in pHes1-EPC and pHes1-ENC at P1 and P4 were examined by ChIP-qPCR. As expected the genes in C3, C6, and C7 showed significantly different levels of H3K27me3 levels (Fig. 4). The gene loci of C1, C2 C5 showed no difference between two cell groups but the genes in C4 showed significant difference in some cases (Fig. 4).
Figure 4.
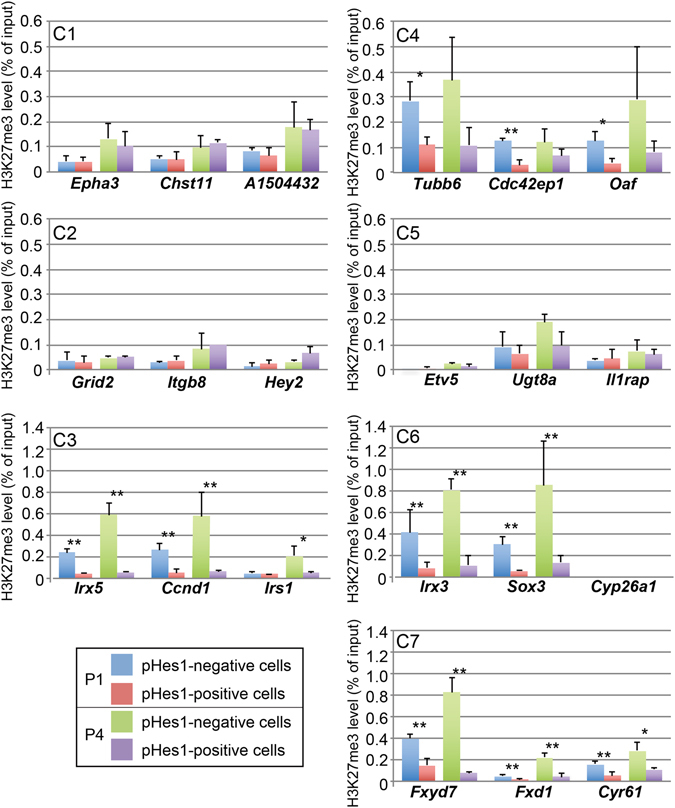
H3K27me3 levels of pHes1_EPC-specific genes loci in pHes1-EPC and pHes1-ENC. H3K27me3 levels of representative genes of each cluster in pHes1-EPC and pHes1-ENC at P1 and P4. ChIP using anti-H3K27me3 antibody was done using extracts of purified pHes1-EPC and pHes1-ENC from mouse retina at P1 and P4. qPCR was done using representative genes in each cluster. The experiments were done three times, and values are average of three samples with standard deviation. p value; **<0.01, *<0.05, or n.s. >0.05 was calculated by Student’s t-test.
Transcription factors are enriched in clusters C3 and C6
We subjected the genes in each cluster to an ontology analysis to examine the gene classification (Table S3). Interestingly, we found a high incidence of genes categorized as transcription regulators in the C3 and C6 clusters (Table S3 and Fig. 5A). The high degree of modification of H3K27me3 in the gene loci of the C3 and C6 clusters in Cd73_PCs (Fig. 3C) suggested that the lower expression levels of these genes in rods were regulated by modifying H3K27me3. Ezh2 is a major H3K27 metnyltransferase in the retina3, and expression levels of transcriptional regulators in each cluster of Cd73_P and Cd73_N retinal cells at P12 in retina-specific conditional knockout (CKO) Ezh2 mice showed that C3 genes in Cd73_PCs and Cd73_NCs were upregulated at P12 in the Ezh2-CKO retina3 (Fig. 5B and Supplemental Fig. 3D). These results suggest that the expression levels of these genes in C3 may be at least partly regulated by modifying H3K27me3.
Figure 5.
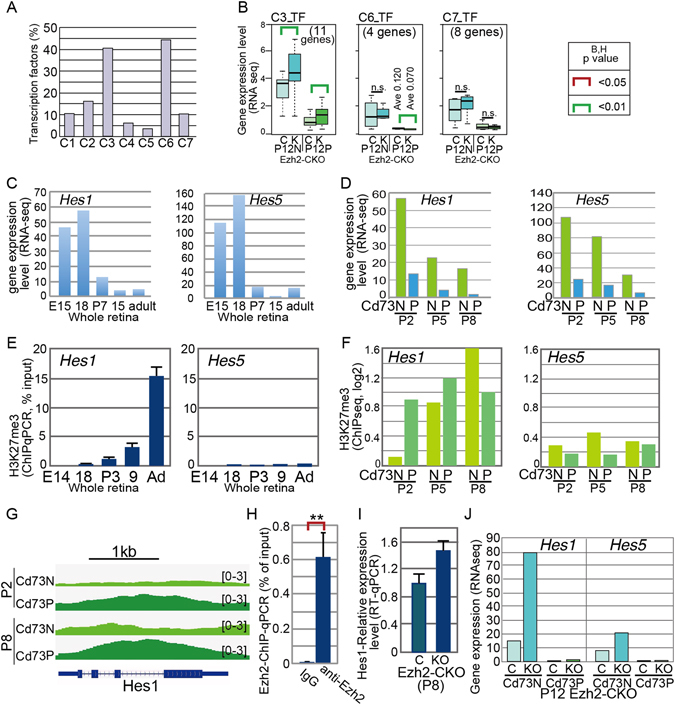
Molecular signature of Hes1 and Hes5 genes. (A) Percentage of genes categorized to transcription factors by IPA in total number of genes in the clusters is shown. (B) Box plots of average levels of transcription factors in each cluster of RNA-seq data of Ezh2-CKO retina3. Retinas from (C), control mouse; K, Ezh2-CKO mouse were13 used. P12N, Cd73 negative population at P12; P12P, Cd73 positive population at P12 retinas. (C) Expression of Hes1 and Hes5 transcripts during mouse retinal development examined by RNA-seq13 are shown. (D) Expression levels of Hes1 and Hes5 transcripts examined by RNA-seq using Cd73_P and Cd73_N cell fractions in indicated developmental stages. (E) H3K27me3 levels at 5′ genomic region of Hes1 and Hes5 loci examined by ChIP-qPCR using whole retina at indicated developmental stages using primers for Hes1 and Hes5 are shown. (F) H3K27me3 levels of Hes1 and Hes5 loci examined by ChIP-seq using Cd73_P and Cd73_N retinal cells. (G) Genome browser snapshots showing the Hes1 region of log2 ratio enrichment for H3K27me3. (H) ChIP-qPCR of anti-Ezh2 antibody of retinal cell extract from control mice. (I) The expression level of Hes1 in retina of Ezh2-CKO3 at P8 examined by RT-qPCR. (J) The expression level of Hes1 and Hes5 in Cd73 positive and negative population in retina of Ezh2-CKO at P12 examined by RNA-seq. E, embryonic day; P, postnatal day; N, negative; P, positive. H; The experiments were done three times, and values are average of three samples with standard deviation. p value; **<0.01 was calculated by Student’s t-test.
Hes1, but not Hes5, is suppressed by modifying H3K27me3 during the late phase of retinal development
Hes1 and Hes5 are critical transcription repressors for Müller glia differentiation25,26 and belonged to the C3 cluster category (Fig. 3A). The Hes1 and Hes5 transcripts were expressed strongly in the embryonic retina, but they were expressed only weakly in the mature retina (Fig. 5C). As expected, Hes1 and Hes5 were expressed in the Cd73_N population, predominantly at P2, P5, and P8, and expression levels decreased gradually in both fractions (Fig. 5D). ChIP-qPCR using whole retinal samples showed that the H3K27me3 level increased at the Hes1 locus as retinal development proceeded (Fig. 5E). In contrast, the H3K27me3 level at the Hes5 locus was constantly very low at all developmental stages examined (Fig. 5E). The H3K27me3-ChIP-seq data for the Hes1 locus in Cd73_PCs and Cd73_NCs showed a strikingly higher modification level in Cd73_PCs at P2; the levels were comparable at P5, but higher in Cd73_NCs than in Cd73_PCs at P8 (Fig. 5F). The levels of H3K27me3 in Cd73_PCs at P2, P5, and P8 were similar, and we surmise that the modification was once upregulated at P2 to shut off the expression of Hes1 when the cells started to differentiate, then kept at least until P8. The Hes1 level was not upregulated since positive transcription regulators for Hes1 may disappeared in the differentiated cell population. On the other hand, in Cd73_NCs, H3K27me3 level was upregulated during retinal development to actively suppress Hes1 expression. In contrast, again, the H3K27me3 level at the Hes5 locus was consistently very low in both the Cd73_P and Cd73_N populations (Fig. 5F). The genome browser pattern confirmed an H3K27me3 modification of the Hes1 gene at P2 in Cd73_PCs but not in Cd73_NCs (Fig. 5G). ChIP-qPCR by using anti-Ezh2 antibody suggested Ezh2 was in Hes1 locus (Fig. 5H). Finally, we examined Ezh2-CKO retinas3, and the Hes1 transcript level was increased at P8 in the Ezh2-CKO retina (Fig. 5I). Later stage RNA-seq data showed that Hes1 expression was increased in the Cd73_N fraction but not in the Cd73_P fraction (Fig. 5J). The increment of Hes1 expression indicates that Hes1 expression was released from the suppression by H3K27me3 modification. We surmised that the Hes1 transcript was not enhanced in the Cd73_P population because of the lack of positive transcription regulators for Hes1 in Cd73_PCs. H3K27me3 levels in Cd73_PCs were similar at P2, P5, and P8, suggesting that once the Hes1 locus was modified with H3K27me3, the modification was kept during development. Weak upregulated expression was observed for Hes5; however, this effect may have been secondary to Hes1 upregulation. Ezh2 homologue Ezh1 is also expressed in retina. We next asked roles of Ezh1 for regulation of Hes1 level. Plasmids encoding sh-RNA against Ezh1 were constructed (sh-Ezh1_1, sh-Ezh2_2), and the plasmids were transfected into NIH3T3 cells to examine the efficiency of sh-Ezh1s. After 48 hours, cells were harvested, and expression of Ezh1 and Ezh2 were examined by RT-qPCR (Supplemental Fig. 4A). Both sh-Ezh1_1 and sh-Ezh1_2 suppressed Ezh1 but not Ezh2. Then the plasmids were transfected to retinal explants prepared from mouse embryos at E18. After 9 days of culture, the explants were harvested, and mRNA levels were examined by RT-qPCR (Supplemental Fig. 4B). The expression levels of neither Hes1 nor Hes5 were upregulated by the sh-Ezh1_1 or sh-Ezh1_2. Hes1 expression was rather suppressed by both plasmids (Supplemental Fig. 4B).
Genes have higher expression levels in the P4- but not in the P1-Hes1-EGFP population
As shown in Fig. 2C, 1,077 genes exhibited higher expression levels in pHes1_EPCs than in pHes1_ENCs at P4, but not at P1. We examined H3K4me3 and H3K27me3 levels of the gene loci and found 926 of the 1,077 genes in the Cd73_P and Cd73_N ChIP-seq data13. We clustered the 926 genes using the H3K4me3 and H3K27me3 values and obtained six clusters by hierarchical clustering analysis (Table S4). The mean RNA-seq values in each cluster showed higher expression levels in pHes1_EPCs than in pHes1_ENCs at P4 but not at P1 in all clusters, as expected (Fig. 6A). A comparison of the RNA-seq data for the entire retina at E15 with that at E18 showed that gene expression levels in pHes1-EPCs at P4 were not higher than at E18 in all clusters, but levels in pHes1-ENCs at P4 of clusters 4 and 5 were lower than the levels at E18, suggesting that the genes in the pHes1-EN population were downregulated at later stages of development rather than being upregulated, as in the pHes1-EP population. The H3K4me3 level in the C1 cluster was lower in the Cd73_P fraction than in the Cd73_N fraction, but no differences were detected between other clusters in the Cd73_P and Cd73_N populations with some exceptions (Fig. 6B). Expression levels were relatively broadly distributed but tended to be higher in the Cd73_N population than the Cd73_P population (Fig. 6D). Levels of H3K27me3 were higher in the C1, C3, and C4 clusters of the Cd73_P population, whereas the levels were very low in the C2, C5, and C6 clusters of the Cd73_P and Cd73_N populations (Fig. 6C). We then subjected the genes in each cluster to an ontology analysis and detected a high frequency of transcription factors in the C1 and C3 clusters (Table S5 and Fig. 6E), suggesting strict regulation of transcription factors by histone modification. In fact, we observed downregulation of expression levels of the transcription factors in C1 and C3 populations in pHes1-ENC in compare with that of the whole retina at E18 (Fig. 6F). Furthermore, analyses of expression levels and histone H3K4/27me3 of these transcription factors showed that their expression and histone modification levels were clearly different between Cd73_P and Cd73_N populations (Fig. 6G–I).
Figure 6.
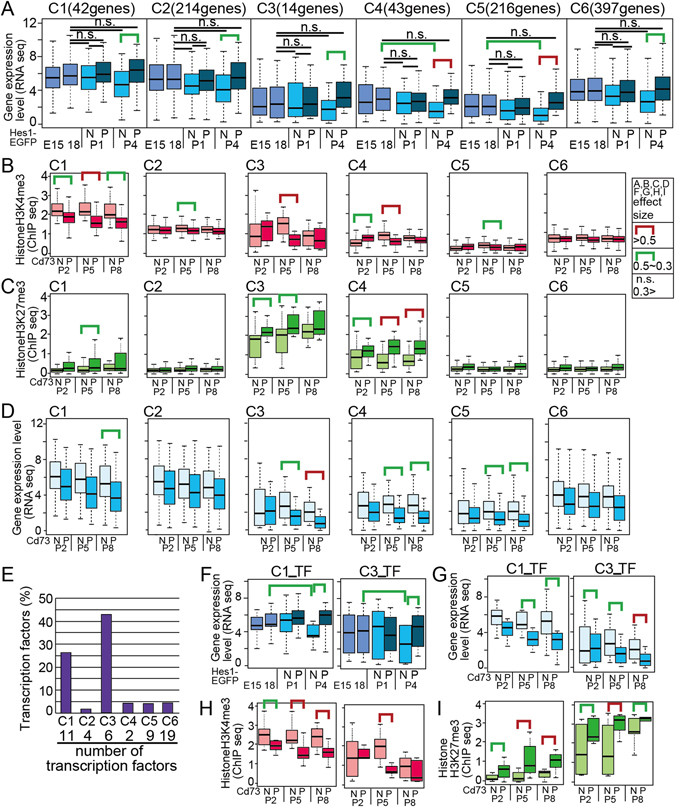
Characterization of genes upregulated in P4 but not in P1 in pHes- EGFP positive cell populations. Genes of pHes1-EPG at P4 but not included in pHes1-EPG at P1 were sub-clustered to C1 to C7 by using their values of H3K4me3 and H3K27me3 ChIP-seq of Cd73_P and Cd73_N fractions13, and distribution of gene expression levels (RNA-seq) in each cluster are shown by box plot (A). (B–D) Box plots of distribution of H3K4me3 (ChIP-seq, B), H3K27me3 (ChIP-seq, C), and transcripts level (RNA-seq, D) of genes in each sub-cluster are shown. ChIP-seqs and RNA-seq were performed by using Cd73_P and Cd73_N retinal sub-fractions at P2, P5, and P813. (E) Percentage of genes categorized to transcription factors by IPA in total number of genes in the clusters is shown. (F–I) Distribution of gene expression levels in pHes1-EPC or pHes1-ENC (F), or in Cd73_P and Cd73_N (G). Levels of H3K4me3 (H) and H3K27me3 (I) of Cd73_P and Cd73_N fractions of the transcription factors in each cluster are shown.
Comparison of gene expression between pHes1- and pHes5-labelled Müller glia cells
A previous study examined Müller glia specific gene expression in pHes5-EGFP mouse retina27, and we asked whether genes identified in our study and their study overlapped or not. Microarray analysis was employed to obtain comprehensive gene expression pattern in pHes5 drove GFP positive retinal cells from P0, to P21, and hierarchical clustering was done27. Cluster 1 contained genes that were expressed highly in pHes5-EGFP retinas at all ages, and cluster 10 contained genes that tended to increase in expression over the first three postnatal weeks27. We compared the genes listed in clusters 1 and 10 in the previous study with our 952 and 1,077 genes that were expressed higher in pHes1_EPCs than in pHes1_ENCs (Fig. 2C). Interestingly, only a small percentage of the genes were in common between all four comparisons, but transcription factors were among the genes listed in common (Fig. 7A). However, we found that most of the genes enriched in Müller glia and/or in astrocytes27 were included in either the 952 or 1,077 gene categories (Fig. 7B).
Figure 7.
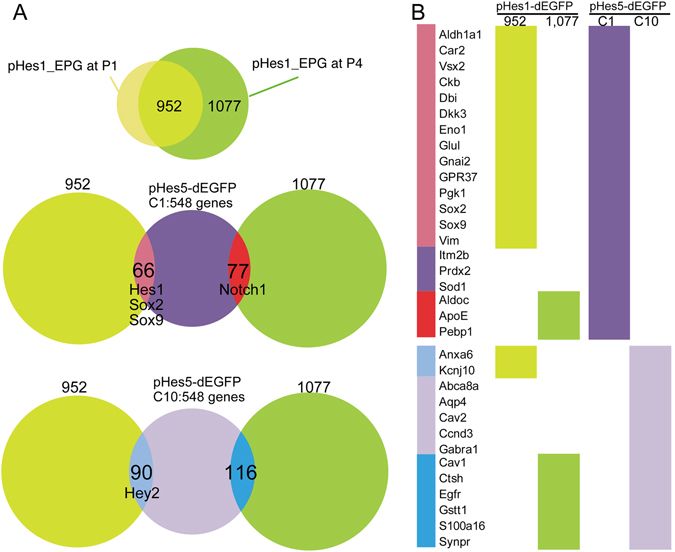
Comparison of gene expression patterns of pHes1-EGFP positive cells and pHes5-EGFP positive cells. (A) Schematic diagram of comparison of the gene expression. Venn diagram showing overlapping of genes of pHes1-EPG at P1 and P4 (upper panel), and these genes with pHes5-EGFP C1 genes27 (middle panel), and these genes with pHes5-EGFP C10 genes27 (lowest panel). (B) The genes enriched in Müller glia and/or in astrocytes27 are shown in the left column, and colors in the right column indicate which subgroup the genes were found. CRLBP-1 and Gnb1l were not listed in both pHes1-EGFP and pHes5-EGFP gene list.
Discussion
In this report, we characterized the Müller glia lineage-specific molecular signature in the developing retina. Purifying retinal cells using Hes1 promoter-dependent EGFP expression enriched the Müller glia, and we examined the genes expressed specifically in that fraction using RNA-seq. We initially defined Müller glia-specific genes by comparing the gene expression patterns between the pHes1-EGFP positive- and negative-fractions; however, the majority of pHes1-EGFP-specific genes were not upregulated after commitment to the Müller glia lineage, rather, these genes were downregulated in other cell lineages. These results suggest that progenitor cells and Müller glia share gene expression patterns. De-differentiation of Müller glia has been reported under various experimental conditions28–30, and a common gene expression pattern may support the ability of Müller glia to be reprogrammed to progenitor-like cells.
By combining a previously constructed ChIP-seq database of Cd73-positive and -negative developing retinal cells, we examined histone modification of gene loci that were enriched in pHes1-EPCs. The genes were subgrouped by their histone modification patterns, and interestingly, transcription factors were highly enriched in the clusters of genes in which their loci were highly H3K27me3 modified. Therefore, we speculate that H3K27 methylation regulates the expression of a particular set of transcription factors. Previously, we obtained results indicating an earlier timing for differentiation of Müller glia in retina-specific Ezh2 knockout mice3,7; therefore, the role of H3K27me3 in defining the time when Müller glia differentiation is initiated was surmised. However, H3K27me3 appeared to act as a shut-off mechanism for critical transcription factors playing roles in Müller glia differentiation in other lineages. This phenomenon was clearly indicative of regulation of Hes1 expression. In fact, modification of H3K27me3 at the Hes1 locus increased significantly with retinal development, and Ezh2 knockout released Hes1 transcription from suppression. It is interesting that the level of H3K27me3 modification at the Hes5 locus was very low at all developmental stages examined, although the time course of the Hes5 expression pattern was quite similar to that of Hes1. The Hes1 and Hes5 genes are transactivated by the Notch intracellular domain complex with Rbpj and Maml31; therefore, mechanisms to distinguish Hes1 and Hes5 gene loci for modifying H3K27me3 may be other than Notch related molecules.
The comparison of genes expressed in pHes1-EGFP-positive cells and pHes5-EGFP-positive cells suggested differences in pHes1 and pHes5 labeled cells. GFP was expressed in the central retina in pHes1-Tg mice, but was absent from peripheral regions, and pHes5-Tg mice expressed GFP more strongly in the peripheral retina, beginning at E13.514. The comparison of gene expression patterns in pHes1-EGFP-positive cells and pHes5-EGFP positive cells indicated that the major genes expressed in Müller glia were included in common in both lists; however, only a small fraction of all genes were listed in common. Because the methods used to analyze the genes (i.e., microarray vs. RNA-seq), the retinal developmental stage, and the bioinformatics methods used to list the Müller glia-specific genes differed between the two studies, currently we could not conclude that the difference of gene expression patterns was due to differences in the Hes1-positive and Hes5-positive cell populations. However, as the distributions of the two populations were quite different, we cannot exclude the possibility that peripheral and central Müller glia have different characteristics represented by different gene expression patterns.
The major H3K27 methyltransferase in the retina is Ezh2, but Ezh1 is also expressed at a later developmental stage3. The H3K27me3 level at the Hes1 locus increased in the Cd73_N fraction and maintained high level in Cd73_P fraction, but Ezh2 expression decreases in Cd73_N and Cd73_P cells as postnatal retinal development proceeds13. Ezh1 expression was weak but constant; however, shRNA based loss-of-function of Ezh1 rather decreased Hes1 level (Supplemental Fig. 4A,B), and Ezh1 knockout mice produced comparable levels of the Hes1 transcript in the adult retina (data not shown), suggesting that Ezh1 is less likely to have a role sustaining the H3K27me3 level during late retinal development. We hypothesize involvement of other enzyme(s) in H3K27 methylation during late differentiation and to maintain the mature retina.
Electronic supplementary material
Acknowledgements
We would like to gratefully acknowledge Dr. Ryoichiro Kageyama for the pHes1-dEGFP mice, and Dr. Shinya Sato for the discussion.
Author Contributions
K.U., T.I., H.K., and G.O. performed experiments. K.U., and M.N. performed bioinformatical analysis. Y.S. performed next generation sequence. H.N., and S.W. planned designed experiments. K.U. and S.W. wrote the manuscript. All authors reviewed the manuscript.
Competing Interests
The authors declare that they have no competing interests.
Footnotes
Kazuko Ueno and Toshiro Iwagawa contributed equally to this work.
A correction to this article is available online at https://doi.org/10.1038/s41598-018-27041-9.
Electronic supplementary material
Supplementary information accompanies this paper at doi:10.1038/s41598-017-03874-8
Publisher's note: Springer Nature remains neutral with regard to jurisdictional claims in published maps and institutional affiliations.
Change history
6/7/2018
A correction to this article has been published and is linked from the HTML and PDF versions of this paper. The error has been fixed in the paper.
References
- 1.Marquardt T, Gruss P. Generating neuronal diversity in the retina: one for nearly all. Trends Neurosci. 2002;25:32–38. doi: 10.1016/S0166-2236(00)02028-2. [DOI] [PubMed] [Google Scholar]
- 2.Iida A, et al. Histone demethylase Jmjd3 is required for the development of subsets of retinal bipolar cells. Proc Natl Acad Sci USA. 2014;111:3751–3756. doi: 10.1073/pnas.1311480111. [DOI] [PMC free article] [PubMed] [Google Scholar]
- 3.Iida A, et al. Roles of Histone H3K27 tri-methylase Ezh2 in retinal proliferation and differentiation. Develop Neurobiol. 2015;75:947–960. doi: 10.1002/dneu.22261. [DOI] [PubMed] [Google Scholar]
- 4.Hansen KH, et al. A model for transmission of the H3K27me3 epigenetic mark. Nat.Cell Biol. 2008;10:1291–1300. doi: 10.1038/ncb1787. [DOI] [PubMed] [Google Scholar]
- 5.Marqueron R, et al. Role of the polycomb protein EED in the propagation of repressive histone marks. Nature. 2009;461:762–767. doi: 10.1038/nature08398. [DOI] [PMC free article] [PubMed] [Google Scholar]
- 6.Cao R, Zhang Y. The functions of E(Z)/EZH2-mediated methylation of lysine 27 in histone H3. Current Opin Genetics & Develop. 2004;14:155–164. doi: 10.1016/j.gde.2004.02.001. [DOI] [PubMed] [Google Scholar]
- 7.Zhang J, et al. Ezh2 maintains retinal progenitor proliferation, transcriptional integrity, and the timing of late differentiation. Dev. Biol. 2015;403:128–138. doi: 10.1016/j.ydbio.2015.05.010. [DOI] [PMC free article] [PubMed] [Google Scholar]
- 8.Kooistra SM, Helin K. Molecular mechanisms and potential functions of histone demethylases. Nature Rev Mol Cell Biol. 2012;13:305–311. doi: 10.1038/nrm3327. [DOI] [PubMed] [Google Scholar]
- 9.Kizilyaprak C, Spehner D, Devys D, Schultz P. In Vivo Chromatin Organization of Mouse Rod Photoreceptors Correlates with Histone Modifications. Plos One. 2010;5:e11039. doi: 10.1371/journal.pone.0011039. [DOI] [PMC free article] [PubMed] [Google Scholar]
- 10.Carter-Dawson LD, LaVail MM. Rods and cones in the mouse retina. J Comp Neurol. 1979;188:263–272. doi: 10.1002/cne.901880205. [DOI] [PubMed] [Google Scholar]
- 11.Young R. Cell differentiation in the retina of the mouse. Anat Rec. 1985;212:199–205. doi: 10.1002/ar.1092120215. [DOI] [PubMed] [Google Scholar]
- 12.Koso H, et al. CD73 is a novel cell surface antigen characterizes retinal photoreceptor precursor cells. Invest. Ophthalmol. Vis. Sci. 2009;5411–5418:5411–5418. doi: 10.1167/iovs.08-3246. [DOI] [PubMed] [Google Scholar]
- 13.Ueno, K. et al. Transition of differential histone H3 methylation in photoreceptors and other retinal cells during retinal differentiation. Sci Rep 6 (2016). [DOI] [PMC free article] [PubMed]
- 14.Ohtsuka T, et al. Visualization of embryonic neural stem cells using Hes promoters in transgenic mice. Mol. Cell. Neurosci. 2006;31:109–122. doi: 10.1016/j.mcn.2005.09.006. [DOI] [PubMed] [Google Scholar]
- 15.Yamashita R, et al. Genome-wide characterization of transcriptional start sites in humans by integrative transcriptome analysis. Genome Research. 2011;21:775–789. doi: 10.1101/gr.110254.110. [DOI] [PMC free article] [PubMed] [Google Scholar]
- 16.Kim D-Y, et al. TopHat2: accurate alignment of transcriptomes in the presence of insertions, deletions and gene fusions. Genome Biol. 2013;25:R36. doi: 10.1186/gb-2013-14-4-r36. [DOI] [PMC free article] [PubMed] [Google Scholar]
- 17.Tabata Y, et al. Retinal fate specification of mouse embryonic stem cells by ectopic expression of Rx/rax, a homeobox gene. Mol. Cell. Biol. 2004;24:4513–4521. doi: 10.1128/MCB.24.10.4513-4521.2004. [DOI] [PMC free article] [PubMed] [Google Scholar]
- 18.Lin Y, Ouchi Y, Satoh S, Watanabe S. The HMG-transcription factor Sox2 is sufficient for the induction of amacrine cells in mouse retina. Invest. Ophthalmol. Vis. Sci. 2008;50:68–74. doi: 10.1167/iovs.07-1619. [DOI] [PubMed] [Google Scholar]
- 19.Yamamichi N, et al. The Brm gene suppressed at the post-transcriptional level in various human cell lines is inducible by transient HDAC inhibitor treatment, which exhibits anti-oncogenic potential. Oncogene. 2005;24:5471–5481. doi: 10.1038/sj.onc.1208716. [DOI] [PubMed] [Google Scholar]
- 20.Kageyama R, Ohtsuka T, Hatakeyama J, Ohsawa R. Roles of bHLH genes in neural stem cell differentiation. Exp Cell Res. 2005;306:343–348. doi: 10.1016/j.yexcr.2005.03.015. [DOI] [PubMed] [Google Scholar]
- 21.Muto A, Iida A, Satoh S, Watanabe S. The group E Sox8 and Sox9 are regulated by Notch signaling and are required for Muller glial cell development in mouse retina. Exp Eye Res. 2009;89:549–558. doi: 10.1016/j.exer.2009.05.006. [DOI] [PubMed] [Google Scholar]
- 22.Ishii M, et al. Expression and clustered distribution of an inwardly rectifying potassium channel, KAB-2/Kir4.1, on mammalian retinal Muller cell membrane: their regulation by insulin and laminin signals. J Neurosci. 1997;17:7725–7735. doi: 10.1523/JNEUROSCI.17-20-07725.1997. [DOI] [PMC free article] [PubMed] [Google Scholar]
- 23.Rich KA, Figueroa SL, Zhan Y, Blanks JC. Effects of Muller cell disruption on mouse photoreceptor cell development. Exp Eye Res. 1995;61:235–248. doi: 10.1016/S0014-4835(05)80043-0. [DOI] [PubMed] [Google Scholar]
- 24.Drager UC, Edwards DL, Brnstable CJ. Antibodies against filamentous components in discrete cell types of the mouse retina. J Neurosci. 1984;4:2025–2042. doi: 10.1523/JNEUROSCI.04-08-02025.1984. [DOI] [PMC free article] [PubMed] [Google Scholar]
- 25.Furukawa T, Mukherjee S, Bao Z-Z, Morrow EM, Cepko C. L. rax, Hes1, and notch1 promote the formation of muller glia by postnatal retinal progenitor cells. Neuron. 2000;26:383–394. doi: 10.1016/S0896-6273(00)81171-X. [DOI] [PubMed] [Google Scholar]
- 26.de Melo J, et al. Lhx2 is an essential factor for retinal gliogenesis and notch signaling. J Neurosci. 2016;36:2391–2405. doi: 10.1523/JNEUROSCI.3145-15.2016. [DOI] [PMC free article] [PubMed] [Google Scholar]
- 27.Nelson, B. R. et al. Genome-wide analysis of Muller glial differentiation reveals a requirement for notch signaling in postmitotic cells to maintain the glial fate. Plos One6, e22817 22811–22814 (2011). [DOI] [PMC free article] [PubMed]
- 28.Sanges D, et al. Reprogramming Muller glia via in vivo cell fusion regenerates murine potoreceptors. J Clin Invest. 2016;126:3104–3116. doi: 10.1172/JCI85193. [DOI] [PMC free article] [PubMed] [Google Scholar]
- 29.Wohl SG, Reh T. A. miR-124-9-9* potentiates Ascl1-induced reprogramming of cultured Muller glia. Glia. 2016;64:743–762. doi: 10.1002/glia.22958. [DOI] [PMC free article] [PubMed] [Google Scholar]
- 30.Goldman D. Muller glial cell reprogramming and retina regeneration. Nat Rev Nerosci. 2014;15:431–442. doi: 10.1038/nrn3723. [DOI] [PMC free article] [PubMed] [Google Scholar]
- 31.Kageyama R, Shimojo H, Imayoshi I. Dynamic expression and roles of Hes factors in neural development. Cell Tissue Res. 2015;359:125–133. doi: 10.1007/s00441-014-1888-7. [DOI] [PubMed] [Google Scholar]
Associated Data
This section collects any data citations, data availability statements, or supplementary materials included in this article.


