

Abstract
Substance abuse and addiction are worldwide concerns. In China, populated with over 1.3 billion people, emerging studies show a steady increase in substance abuse and substance-related problems. Some of the major challenges include a lack of an effective evaluation platform to determine the health status of substance-addicted subjects. It is known that the intestinal microbiota is associated to the occurrence and development of human diseases. However, the changes of bacterial diversity of intestinal microbiota in substance-addicted subjects have not been clearly characterized. Herein, we examined the composition and diversity of intestinal microbiota in 45 patients with substance use disorders (SUDs) and in 48 healthy controls (HCs). The results show that the observed species diversity index and the abundance of Thauera, Paracoccus, and Prevotella are significantly higher in SUDs compared to HCs. The functional diversity of the putative metagenomes analysis reveals that pathways including translation, DNA replication and repair, and cell growth and death are over-represented while cellular processes and signaling, and metabolism are under-represented in SUDs. Overall, the analyses show that there seem to be changes in the microbiota that are associated with substance use across an array of SUDs, providing fundamental knowledge for future research in substance-addiction assessment tests.
Introduction
Substance abuse and addition cause issues to both personal and family health, which causes a serious problem in China1. Substance addiction has been shown to lead to increased violence, prostitution, substance-related sexually transmitted diseases (i.e. acquired immune deficiency syndrome: AIDS) and death. Yunnan is a Chinese border province, geographically adjacent to Southeast Asia’s “Golden Triangle”, known as the world hub for opium and heroin manufacturing and trafficking. Over the past two decades, Yunan province has experienced a remarkable rise in illegal substance use. At the end of 2014, it was estimated that there were 2.9 million substance-addicts in China and over 188,000 registered substance addicts in Yunnan province2.
Substance addiction is a chronic disease, in which addicted patients compulsively seek and take substances, even though they are aware of its harmful consequences3. The substance-addicted patients often have co-occurring medical conditions, including malnutrition, AIDS, Hepatitis C, cardiovascular diseases, stroke, and mental disorders. In addition, most of substance abusers are often addicted to alcohol and tobacco. To treat substance addiction and to help former substance addicts return back to society, community-based drug rehabilitation centers have been developed in Yunnan province. However, a major challenge is a lack of effective evaluations/tests to determine the health status of the patients and the effects of drug rehabilitation, both physically and mentally.
The microorganisms that live within and on the surface of the human body are composed of over 100 trillion species4. It is estimated to outnumber human body cells by at least an order of magnitude. Recent findings suggest that these microorganisms play significant roles in maintaining human health, and the microbiota: the compositions of the microorganisms that directly reflect health status of an individual5, 6. For example, emerging evidences show that the intestinal microbiota contributes to fat deposition and glucose metabolism, because certain changes in the intestinal microbiota were observed in obese patients7, 8. Therefore, intestinal microbiota diversity has emerged as an indicator of overall health of the host. In addition, low community richness has been correlated with metabolic disorders (i.e. adiposity, insulin resistance, and overall inflammatory phenotypes) and gastrointestinal conditions (i.e. inflammatory bowel disease, colorectal cancer, and irritable bowel syndrome)9. Various external variables such as stress, probiotic or antibiotic use, and alcohol consumption have been found to instigate changes in the human microbiota10, 11.
In this study, we examined the composition and the dynamics of the intestinal microbiota of 45 patients with substance use disorders (SUDs) and 48 healthy controls (HCs) in order to determine whether there is an association between substance abuses and/or the length of substance addiction with the changes of intestinal microbiota. To our knowledge, this is the first study comprehensively comparing the composition and diversity of intestinal microbiota between SUDs and HCs.
Results
Characteristics of Participants in the Study
In total 101 male subjects who take substances including heroin, ice, ephedrine, heroin + ephedrine, and heroin + ice provided fecal samples in this study. 8 subjects were excluded due to the intake of antibiotics before sampling. It is noticeable that all subjects with substance use disorders are involved in daily smoking and drinking. The detailed demographic and clinical characteristics were summarized in Table 1.
Table 1.
Characteristics of 101 Participants.
| HCs | SUDs | |
|---|---|---|
| Gender | Male (n = 51) | Male (n = 50) |
| Age at collection | ||
| Mean ± SD | 25 ± 3 | 32 ± 7 |
| Range | 20~37 | 18~46 |
| Substance_Time (month) | ||
| Mean ± SD | NA | 54 ± 69 |
| Range | 3~348 | |
| Substance_Type | ||
| Heroin | NA | 26 |
| Methamphetamine | 15 | |
| Ephedrine | 4 | |
| Others | 5 | |
| Substance_Manner | ||
| Snorting | NA | 45 |
| Injection | 5 | |
| Re-addiction Times | ||
| 1st time | NA | 17 |
| 2nd time | 21 | |
| More than twice | 12 | |
Data are shown as median (interquartile range).
Substance addition affects intestinal microbiota in SUDs
First, we performed a principle component analysis (PCA) to distinguish the differences among subjects addicted to different groups of substances, including 45 SUDs and 48 HCs (Supplementary Figure S1). We found that there is no significant clustering based on substance types, with HC cluster far away from samples of SUDs. Therefore, we divided the subjects into two groups, “healthy” vs. “addicted”- SUDs with alcohol and tobacco as additional substances.
Then we analyzed the intestinal microbiota diversity on all 45 SUDs and 48 HCs, and tested whether intestinal microbiota diversity could be related to substance addiction. The overall intestinal microbiota profile was obtained using deep sequencing of the 16S rRNA gene, and microbial diversity was then analyzed.
The alpha diversity indices of Chao1 and observed species diversity are shown in Fig. 1. The Chao1 diversity index was higher in SUDs compared to the HCs, but there were no significant differences between the groups by t-test (Fig. 1A). However, the observed species diversity index was significantly different between all 48 SUDs and all 45 HCs (Fig. 1B, p = 0.03). To exclude potential effects of age on the profiles of microbial diversity in SUDs, additional analysis was applied to 29 SUDs and 28 age-matched HCs aging from 19 to 37 (Table 2). Both Chao1 diversity index and observed species diversity index were higher in SUDs compared to HCs, but there were no significant differences between groups through a t-test (Data not shown). Beta diversity was further evaluated with unweighted-UniFrac analysis, which showed a global difference in microbial community composition from 48 SUDs from 45 HCs (Fig. 1C). Furthermore, UniFrac-based Principal Coordinate Analysis (PCoA) showed that samples were clustered by subject (Fig. 1D, R2 = 0.067, Pr (>F) = 0.001). We also performed a weighted-UniFrac PCoA analysis with R2 = 0.017, Pr (>F) = 0.187 (Supplementary Figure S2). These results suggest that factors associated with substance addiction may strongly influence the diversity of intestinal microbiota.
Figure 1.
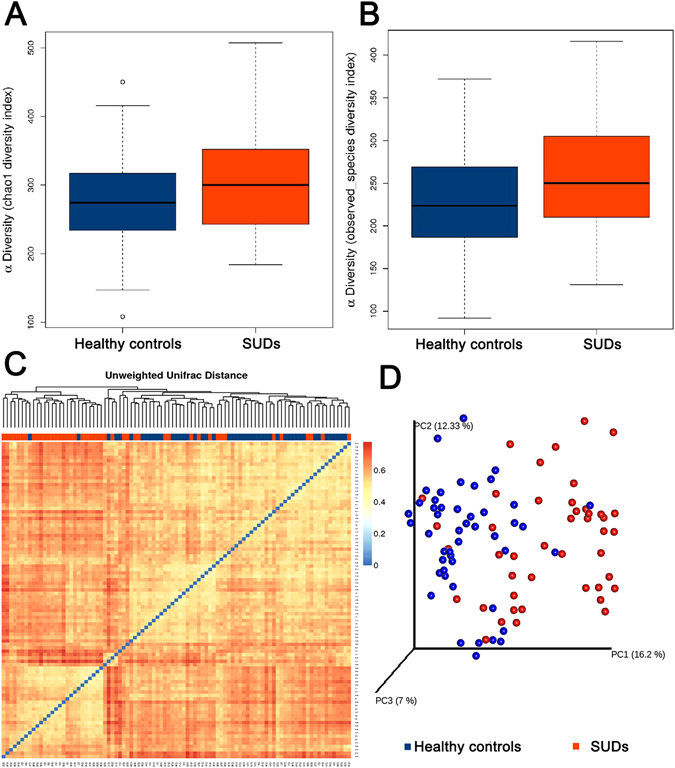
Analysis of alpha diversity in HC (blue) vs SUDs (orange) predicted diversity by Chao 1 estimator (A), p = 0.11 and observed species (B), p = 0.03. Beta diversity measures in SUDs vs HCs. (C) Hot map was performed basing on the unweighted-unifrac distances matrix using the R package “vegan”, orange for the SUDs and blue for the HCs. (D) Principal Coordinate Analysis (PCoA) and UPGMA tree of unweighted-unifrac distances of samples, blue for the HCs and red for the SUDs (adonis test, R2 = 0.067, Pr (>F) = 0.001).
Table 2.
Characteristics of 57 Participants.
| HCs | SUDs | |
|---|---|---|
| Gender | Male (n = 28) | Male (n = 29) |
| Age at collection | ||
| Mean ± SD | 27 ± 3 | 29 ± 5 |
| Range | 25~37 | 19~36 |
| Substance_Time (month) | ||
| Mean ± SD | NA | 37 ± 42 |
| Range | 8~192 | |
| Substance_Type | ||
| Heroin | NA | 15 |
| Methamphetamine | 10 | |
| Ephedrine | 2 | |
| Others | 2 | |
| Substance_Manner | ||
| Snorting | NA | 26 |
| Injection | 3 | |
| Re-addiction Times | ||
| 1st time | NA | 8 |
| 2nd time | 15 | |
| More than twice | 6 | |
Data are shown as median (interquartile range).
Bacterial Abundance and Distribution in SUDs vs. HCs
We then analyzed the intestinal microbiota abundance and distribution on the 45 SUDs and the 48 HCs, and tested whether intestinal microbiota abundance and distribution could be related to substance addiction. Nonmetric multidimensional scaling revealed that the bacterial profiles of SUDs differed from those of HCs (Fig. 2). We investigated the potential bacterial groups responsible for the changes observed in the profiles of SUDs and used Kruskal-Wallis ANOVA test to see if there is any particular OTU of interest.
Figure 2.
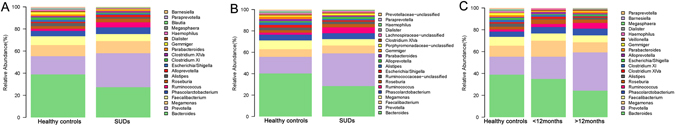
Genus-level taxonomic distribution of intestinal microbiota and top 20 genera in (A) 45 SUDs vs 48 HCs, (B) 29 age-matched SUDs vs 28 age-matched HCs, and (C) long-term SUDs vs short-term SUDs. Stacked columns for each of the group show the mean of abundance of a given genus as a percentage of the total bacterial sequences in the corresponding group.
At the genus level, bacteria from Bacteroides (24.20% vs 33.97%), Faecalibacterium (5.62% vs 6.93%), Alistipes (1.21% vs 2.49%), Gemmiger (0.49% vs 1.68%), Clostridium XI (0.77% vs 1.83%), Escherichia/Shigella (0.99% vs 1.65%), Dialister (0.43% vs 0.98%), Paraprevotella (0.19% vs 0.72%), Megasphaera (0.23% vs 0.70%), Haemophilus (0.37% vs 0.80%), Parabacteroides (1% vs 1.29%), Barnesiella (0.26% vs 0.53%), and Blautia (0.44% vs 0.48%) were less abundant whereas those from Prevotella (27.20% vs 14.42%), Ruminococcus (3.97% vs 1.64%), Phascolarctobacterium (5.37% vs 4.15%), Alloprevotella (1.76% vs 0.91%), Megamonas (9.64% vs 8.86%), Roseburia (2.94% vs 2.16%), and Clostridium XlVa (1.19% vs 1.10%) were more abundant in SUDs compared to HCs (Fig. 2A and Table S1). The same analysis was also applied to the selected 29 SUDs and 28 age-matched HCs (Fig. 2B and Table S2): at the genus level, bacteria from Bacteroides (26.62% vs 37.02%), Megamonas (5.27% vs 7.35%), Gemmiger (0.44% vs 2.06%), Escherichia/Shigella (1.10% vs 2.45%), Alistipes (1.17% vs 2.22%), Parabacteroides (1.07% vs 1.80%), Paraprevotella (0.23% vs 0.76%), Dialister (0.47% vs 1.00%), Haemophilus (0.50% vs 0.90%), Veillonella (0.57% vs 0.69%), Blautia (0.36% vs 0.55%), Megasphaera (0.25% vs 0.51%), Parasutterella (0.19% vs 0.47%), and Clostridium XlVa (1.05% vs 1.07%) were less abundant whereas those from Prevotella (27.80% vs 13.40%), Ruminococcus (5.05% vs 1.80%), Roseburia (2.87% vs 2.04%), Alloprevotella (1.73% vs 0.99%), Faecalibacterium (6.60% vs 6.41%), and Phascolarctobacterium (4.95% vs 4.79%) were more abundant in SUDs compared to HCs. The majority of the grouped bacteria were observed in both comparisons, Clostridium XI, Megasphaera, Barnesiella, and Blautiawas only shown in the comparison between SUDs and HCs, suggesting that age may be an affecting factor for the abundance and distribution of these four bacteria. To further determine whether bacterial profile changes during long-term addiction, we compared intestinal microbiota composition of those SUDs with a longer history of substance use to those of a shorter one. At genus level, the abundance of Prevotella (14.42% vs 18.26% vs 30.83%), Ruminococcus (1.64% vs 2.45% vs 4.59%), Alistipes (2.49% vs 0.54% vs 1.49%), Parabacteroides (1.29% vs 0.41% vs 1.23%), Escherichia/Shigella (1.65% vs 0.73% vs 1.10%), Megasphaera (0.70% vs 0.02 vs 0.31%), Dialister (0.98% vs 0.41% vs 0.44%), Barnesiella (0.53% vs 0.14% vs 0.31%), Phascolarctobacterium (4.15% vs 5.36% vs 5.37%), Gemmiger (1.68% vs 0.42% vs 0.52%), and Paraprevotella (0.72% vs 0.14% vs 0.21%) were increased, whereas Bacteroides (33.97% vs 31.18% vs 21.36%), Megamonas (8.86% vs 13.14% vs 8.22%), Roseburia (2.16% vs 3.67% vs 2.64%), Haemophilus (0.80% vs 0.99% vs 0.12%), Clostridium XI (1.83% vs 1.38% vs 0.53%), Clostridium XlVa (1.10% vs 1.76% vs 0.96%), Blautia (0.48% vs 0.71% vs 0.33%) and Faecalibacterium (6.93% vs 5.86% vs 5.53%) were decreased in long-term SUDs compared to the short-term SUDs (Fig. 2C and Table S3). Among all three-comparison groups, bacteria from Bacteroides and Haemophilus were consistently less abundant whereas the number of bacteria from Prevotella, Phascolarctobacterium and Ruminococcus were consistently increased in SUDs vs HCs, and in long-term SUDs vs short-term SUDs (Fig. 3 and Table S1–3). These results suggest that the abundance of Bacteroides and Prevotella inintestinal microbiota that have significant difference compared to controlscould be utilized as potential biomarkers for SUDs and predict the status or length of substance use. In addition, bacteria from Alloprevotella, Clostridium XlVa and Roseburia were more abundant in overall SUDs comparing to those in HCs from the very beginning. However, the abundance of these 3 bacteria decreased in SUDs over a 12-month period. In contrast, bacteria from Alistipes and Paraprevotella, which were identified with lower abundance in overall SUDs comparing to controls, were increased in long-term SUDs. These results suggest that the abundance of bacteria from Alloprevotella, Clostridium XlVa, Roseburia, Alistipes and Paraprevotella changed in those SUDs and could be potentially recovered after longer period of substance use and addiction.
Figure 3.
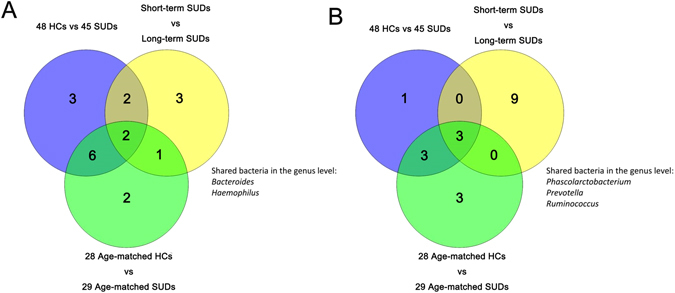
Three-group shared bacteria in the VENN. Bacteria from Bacteroides, and Haemophilus (A) were consistently less abundant whereas the number of bacteria from Prevotella, Phascolarctobacterium and Ruminococcus (B) were consistently increased in SUDs vs HCs, and in long-term SUDs vs short-term SUDs.
Differential Microbiota Compositions and Functionality
At the same time, we found significant differences in the community compositions between all 45-tested SUDs and 48 HCs. As shown in Fig. 4, there were eightsignificantly different families, which were composed by Prevotellaceae, Rhodobacteraceae and Rhodocyclaceae that are enriched in the SUDs group, and Bacteroidaceae, Rikenellaceae, Streptococcaceae, Erysipelotrichaceae, and Desulfovibrionaceae that are enriched in the HC group. The microbial composition was also significantly different at the genus level, with eighteen significantly different genera between groups. These differentially abundant taxa can be considered as potential biomarkers (LDA score > 2.0, p < 0.05) (Fig. 4A). Bacilli (p = 0.0316), Alphaproteobacteria (p < 0.0001), Deltaproteobacteria (p = 0.0020) and Erysipelotrichia (p = 0.0133) representation of significantly different at the class level between two groups was performed by LEfSe (Linear discriminant analysis Effect Size) (Fig. 4B)12.
Figure 4.

Taxonomic biomarkers. (A) Linear discriminative analysis (LDA) effect size LEfSe analysis between the HCs (red) and SUDs (green). (B) Cardiogram showing differentially abundant taxonomic clades with an LDA score > 2.0 among cases and controls, p < 0.05.
The microbial composition was also significantly different at the genus level among groups (Fig. 5A). Thauera (p < 0.0001), Paracoccus (p < 0.0001), and Prevotella (p = 0.0092) exhibited a relatively higher abundance in SUDs. Anaerostipes (p = 0.0015), Bilophila (p = 0.0020), Clostridium XVIII (p < 0.0001), Dorea (p = 0.0071), Enterobacteriaceae_unclassified (p = 0.0010), Fusicatenibacter (p = 0.0026), Gemmiger (p = 0.0034), Ruminococcus2 (p = 0.0057), and Streptococcus (p = 0.0053) were relatively more abundant in HC group. However, when comparing the 29 tested SUDs with the 28 age-matched HCs (Fig. 5B), Anaerostipes (p = 0.0284), Bilophila (p = 0.0388), Clostridium XVIII (p = 0.0011), Enterobacteriaceae-unclassified (p = 0.0179), Fusicatenibacter (p = 0.0145), Gemmiger (p = 0.0282), Megasphaeram (p = 0.0389), Parabacteroides (p = 0.004), Paracoccus (p < 0.0001), Prevotella (p = 0.0097), Streptococcus (p = 0.0046), and Thauera (p < 0.0001) at the genus level consistently differed between the 2 groups, while Clostridium IV (p = 0.0216) was only shown in the comparison between 29 SUDs and 28 age-matched HCs.
Figure 5.
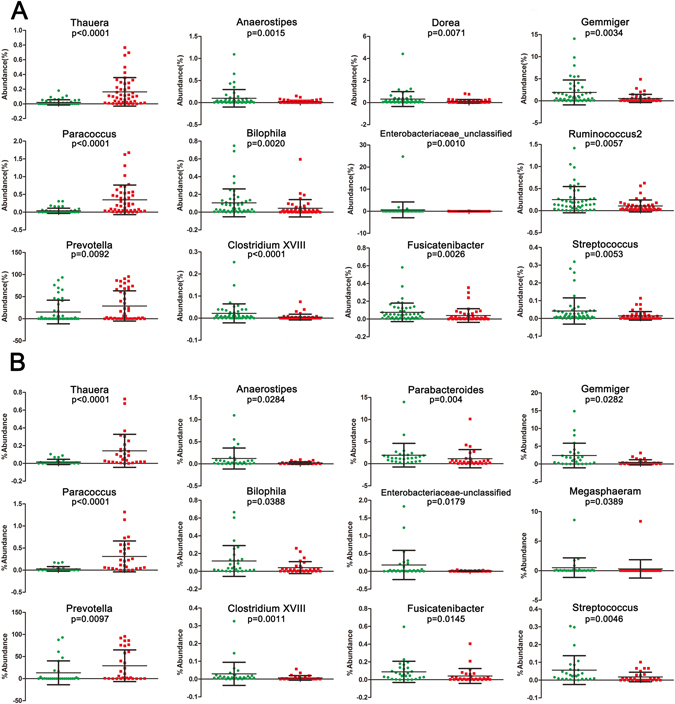
Scatterplots of bacterial taxa indicative of SUDs. HC samples are shown as green dots and samples from SUDs are shown as red dots. p-values were calculated using the Mann-Whitney test (A) for 93 samples analysis, while (B) had 57 samples analysis.
In addition, the functional diversity of the different putative metagenomes was assessed using the PICRUSt software13, which allows the prediction of metabolic pathways from the 16S rRNA reads. Pathways displaying a difference in mean proportions between SUDs and HCs at least 0.1% were represented (Fig. 6). Some pathways including translation (p = 0.015), DNA replication and repair (p = 0.03) and cell growth and death (p = 0.041) were over-represented in SUDs, whereas cellular processes and signaling (p = 0.03) and metabolism (p = 0.033) were under-represented in SUDs. These results indicate that factors associated with substance addiction may also influence the functional diversity, especially the metabolism of the different putative metagenomes.
Figure 6.
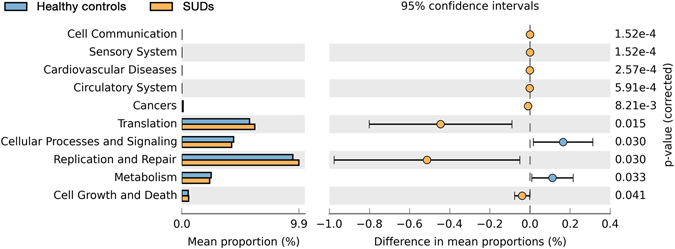
Compare the difference notability function in KEGG module prediction using 16S data with PICRUSt.
Discussion
A comprehensive and thorough investigation of the bacterial diversity of intestinal microbiota is essential for understanding their etiologies and for developing potential treatment strategies for SUDs in the future. The high-throughput sequencing has provided new insights into the compositions and structures of microbial communities. In this report, we used amplicon-sequencing to explore the bacterial diversity and the community structure in 93 fecal samples by sequencing the 16S rDNA hypervariable V3–V4 region. The V3–V4 region has been used in the study14 because it can provide a greater phylogenetic resolution and better analysis of the diversity and abundance.
We obtained 4,872,436 high-quality sequences with an average of 52,392 sequences per sample. At 97% identity, 148 OTUs belonging to 51 genera, 25 families, 16 orders, 12 classes, and 5 phyla were obtained, after filtering out the low-credibility OTUs and use Ribosomal Database Project (RDP) for assigning taxonomy to the sequences with a threshold 0.8~1. At the genus level, 51 different genera were identified in the samples, out of which 14 genera had abundances higher than 1% (Data not shown). We have shown that Clostridium XI, Megasphaera, Barnesiella, and Blautia were correlated with substance abuse and addiction regardless of the factor of age (Fig. 2). However, Prevotellaceae-unclassified, Ruminococcaceae-unclassified, Porphyromonadaceae-unclassified, and Lachnospiraceae-unclassified were only shown in the comparison of all 29 SUDs vs 28 HCs, but not identified in the comparison between age-matched groups. It is consistent with previous reports that some of these bacteria have been correlated with age15. In addition, certain bacteria gradually increase in abundance during substance use, thus they were regarded as potential biomarkers for the length of substance addiction. Furthermore, we screened potential biomarkers (Thauera, Paracoccus, and Prevotella) for substance addiction with LEfSe analysis. Therefore, our analyses proved adistinguished intestinal microbiota profile in SUDs, which provides a clue that may lead to strategies to identify or evaluate potential substance addicts.
To investigate whether there is an impact from bacterial function, PICRUSt was applied to the 16S rRNA deep sequencing data to infer bacterial metabolic functions. Interestingly, we found higher abundance of cell communication (p = 0.000152), cardiovascular disease (p = 0.000257), circulatory system (p = 0.000591), cell growth and death (p = 0.041), translation (p = 0.015) and replication and repair (p = 0.03) in SUDs comparing to HCs. Diseases in cardiovascular system, circulatory system and digestive system have been known as the consequences of substance addiction16, 17. Increased alpha diversity of the intestinal microbiota, as well as the enrichment of bacterial function related cardiovascular system, circulatory system and digestive system might reveal both harmful and protective bacterial effects on cardiovascular system, circulatory system and digestive system18, 19. Volpe et al. recently reported a characterization of the microbiome in cocaine users showed having a higher relative abundance of Bacteroidetes than in nonusers20. Kiraly et al. demonstrated in mice that perturbations of the gut microbiome affected behavioral response to cocaine in mice2. It is noticeable that intestinal microbiota in SUDs would change specifically with substance addiction, but not specific to any type of substance (Figure S1), suggesting a global switch of life style due to substance abuse in general could cause the significant change of intestinal microbiota in SUDs. It is also known that almost all patients with SUDs are involved in alcohol and tobacco addiction. Therefore, alcohol and tobacco use may also account for the large part of the effect. However, how substance abuse influences intestinal microbiota is still largely unknown. Further investigation is urgently needed to uncover the functions of intestinal microbiota in cardiovascular, circulatory and digestive systems in substance addicts.
In summary, amplicon-sequencing technology has greatly expanded our knowledge regarding the microbiota diversity and community structure in SUDs and HCs. We observed vast intestinal microbiota diversity with 4,872,436 high-quality sequences. Bacterial diversity in SUDs was higher than that in HCs and gradually increased with the length of substance abuse. More importantly, we identified Thauera, Paracoccus, and Prevotella as substance-related bacteria, although the specific functions of these bacteria require further testing and verification. Future analyses investigating the effects of anti-substance treatments on those substance addicts, using intestinal microbiota, would be valuable for developing new evaluation platforms to identify and treat these substance addicts.
Methods
Study Participants
Fecal samples were obtained from 50 SUDs and 51 HCs who come from Kunming Drug Rehabilitation Center. All subjects signed an informed consent form. The experimental protocol was approved by Medical Ethics Committee of the First Affiliated Hospital of Kunming Medical University and this study was conducted in accordance with the recommendations of the Medical Ethics Committee of the First Affiliated Hospital of Kunming Medical University. Inclusion criteria of subjects were as follows: an age of 19 ~ 46 years old (male), no incidence of antibiotics use within the three months prior to sampling. The detailed clinical parameters of the 101 participants are shown in the Table 1. Eight subjects were excluded from the study due to the intake of antibiotics before sampling. Exclusion criteria for all subjects were based on factors known or likely to impact the intestinal microbiota or known to be associated with microbial translocation21, including antibiotic or probiotic use with the previous 3 months, gastrointestinal morbidity, opportunistic infection, and evidence of human immunodeficiency virus, hepatitis B or C virus infection22, 23. HCs do not smoke or drink.
Sample Collection, DNA extraction and 16S rRNA gene sequencing
Fecal sampling was performed 2 hours after breakfast. Samples were collected in a sterile container and immediately stored at −80 °C until further processing. Bacterial DNA was extracted using the QIAamp DNA Stool Mini Kit (Qiagen, USA) following manufacturer’s instructions. The adequacy of the amount of extracted DNA from the samples was verified with fluorometric quantitation (Qubit, Life Technologies, USA). Primers 5′CCTACGGGRSGCAGCAG3′ and 5′GGACTACVVGGGTATCTAATC3′ were used to amplify the V3–V4 hypervariable regions of 16S rDNA to comprehensively define the bacterial composition and abundance in a number of SUDs and HCs. Using Illumina HiSeq2500 platform, the 93 fecal samples yielded 4,872,436 high-quality reads (PE250) in total. On average, each sample yielded 52,392 sequences, ranging from 39,817 to 60,571. Clustering of all high-quality sequences at 97% identity resulted in 1691 OTUs, which were BLAST-searched against the RDP database for taxonomic assignments. After removing the low-credibility OTUs (together contributing only 8.9% of all sequences), a modified OTU table was obtained consisting of 148 OTUs with an average of 118 OTUs per sample (ranging from 62 to 166).
Intestinal microbiota analysis
The Quantitative Insights Into Microbial Ecology pipeline was employed to process the sequencing data (QIIME ver. 1.9.0, http://qiime.org/). Briefly, raw sequences with exact matches to the barcodes were assigned to respective samples and identified as valid sequences whose primers and barcodes were trimmed for further quality control. Paired-end reads merged using PANDAseq24, sequences were de-noised using USEARCH (ver. 8.0.1623)25, and chimera checked with UCHIME26. Operational Taxonomic Units (OTUs) were picked using uclust at 97% similarity25, and representative sequences were generated. Sequences were aligned with PyNAST27 using Greengenes database and taxonomy assigned to the lowest possible taxonomic level using the Ribosomal Database Project Classifier at a 80% bootstrap value threshold28. OTUs found in above 50% samples were retained. The numbers of sequences were normalized for further analyses. Alpha-diversity indexes were compared in QIIME using a nonparametric two-sample t test, whereas adonis tests were used for beta-diversity comparisons. The upper limit of rarefaction depths (−e 39810) was used as the cut-off value. Metagenomic biomarker discovery use the online LEfSe program (http://huttenhower.sph.harvard.edu/galaxy/root/index)29. The function of intestinal microbiota was performed by online phylogenetic investigation of communities by reconstruction of unobserved states program (PICRUSt, http://picrust.github.io/picrust/). Functional modules were compared between SUDs and HCs with STAMP v2.1.3 (http://kiwi.cs.dal.ca/Software/STAMP) using Welch’s t-test. Statistical analyses were performed using R software package. GraphPad Prism was used to generate scatterplots of bacterial taxa.
Statistics
The p-values are not corrected with FDR or Bonferroni in both LEfSe and PICRUSt.
Electronic supplementary material
Acknowledgements
This work was supported by the joint-key project of Yunnan Provincial Science and Technology Department and Kunming medical University (No. 2013FB105), the National Natural Science Foundation of China (No. 81360069); the Major project of Yunnan Provincial Bureau of Education (No. ZD2015010), the Key Science and Technology planning Project of Yunnan Provincial Science and Technology Department (No. 2016FC005), Foundation of Yunnan Institute of Digestive Disease (No. 2016NS001 and 2016NS004), and the Key Science and Technology planning Project of Kunming Science and Technology Bureau and the China Guanghua Foundation.
Author Contributions
Y.X. and Z.X. designed the experiments, carried out the molecular experiments, participated in the sequence alignment, bioinformatics, data analysis, and wrote the manuscript; Z.S. and Q.W. collected samples; H.W. participated in the design of the study, supervised the project, participated in the drafting of the manuscript; G.Y., G.Y., X.C. and X.L. supervised the project, participated in the drafting of the manuscript; K.W. designed the experiments, supervised the project and participated in the drafting of the manuscript. All authors read and approved the final manuscript.
Competing Interests
The authors declare that they have no competing interests.
Footnotes
Yu Xu, Zhenrong Xie and Huawei Wang contributed equally to this work.
Electronic supplementary material
Supplementary information accompanies this paper at doi:10.1038/s41598-017-03706-9
Publisher's note: Springer Nature remains neutral with regard to jurisdictional claims in published maps and institutional affiliations.
References
- 1.Xu X, et al. A significant association between BDNF promoter methylation and the risk of drug addiction. Gene. 2016;584:54–59. doi: 10.1016/j.gene.2016.03.010. [DOI] [PubMed] [Google Scholar]
- 2.Kiraly DD, et al. Alterations of the Host Microbiome Affect Behavioral Responses to Cocaine. Scientific Reports. 2016;6:35455. doi: 10.1038/srep35455. [DOI] [PMC free article] [PubMed] [Google Scholar]
- 3.Tsuang MT, et al. Co-occurrence of abuse of different drugs in men: the role of drug-specific and shared vulnerabilities. Arch Gen Psychiatry. 1998;55:967–972. doi: 10.1001/archpsyc.55.11.967. [DOI] [PubMed] [Google Scholar]
- 4.Leclercq S, et al. Intestinal permeability, gut-bacterial dysbiosis, and behavioral markers of alcohol-dependence severity. Proceedings of the National Academy of Sciences of the United States of America. 2014;111:E4485. doi: 10.1073/pnas.1415174111. [DOI] [PMC free article] [PubMed] [Google Scholar]
- 5.Marchesi JR, et al. The gut microbiota and host health: a new clinical frontier. Gut. 2016;65:330–339. doi: 10.1136/gutjnl-2015-309990. [DOI] [PMC free article] [PubMed] [Google Scholar]
- 6.Kahrstrom CT, Pariente N, Weiss U. Intestinal microbiota in health and disease. Nature. 2016;535:47. doi: 10.1038/535047a. [DOI] [PubMed] [Google Scholar]
- 7.Armougom F, Henry M, Vialettes B, Raccah D, Raoult D. Monitoring bacterial community of human gut microbiota reveals an increase in Lactobacillus in obese patients and Methanogens in anorexic patients. PLoS One. 2009;4:e7125. doi: 10.1371/journal.pone.0007125. [DOI] [PMC free article] [PubMed] [Google Scholar]
- 8.Million M, et al. Obesity-associated gut microbiota is enriched in Lactobacillus reuteri and depleted in Bifidobacterium animalis and Methanobrevibacter smithii. International Journal of Obesity. 2012;36:817–825. doi: 10.1038/ijo.2011.153. [DOI] [PMC free article] [PubMed] [Google Scholar] [Retracted]
- 9.Ott SJ, et al. Reduction in diversity of the colonic mucosa associated bacterial microflora in patients with active inflammatory bowel disease. Gut. 2004;53:685–693. doi: 10.1136/gut.2003.025403. [DOI] [PMC free article] [PubMed] [Google Scholar]
- 10.Sekirov I, Russell SL, Antunes LC, Finlay BB. Gut microbiota in health and disease. Physiol Rev. 2010;90:859–904. doi: 10.1152/physrev.00045.2009. [DOI] [PubMed] [Google Scholar]
- 11.Sommer F, Backhed F. The gut microbiota–masters of host development and physiology. Nat Rev Microbiol. 2013;11:227–238. doi: 10.1038/nrmicro2974. [DOI] [PubMed] [Google Scholar]
- 12.Segata N, et al. Metagenomic biomarker discovery and explanation. Genome Biol. 2011;12:R60. doi: 10.1186/gb-2011-12-6-r60. [DOI] [PMC free article] [PubMed] [Google Scholar]
- 13.Langille MG, et al. Predictive functional profiling of microbial communities using 16S rRNA marker gene sequences. Nature Biotechnology. 2013;31:814–821. doi: 10.1038/nbt.2676. [DOI] [PMC free article] [PubMed] [Google Scholar]
- 14.Wang Y, Qian PY. Conservative fragments in bacterial 16S rRNA genes and primer design for 16S ribosomal DNA amplicons in metagenomic studies. PloS one. 2009;4:e7401. doi: 10.1371/journal.pone.0007401. [DOI] [PMC free article] [PubMed] [Google Scholar]
- 15.Marathe N, Shetty S, Lanjekar V, Ranade D, Shouche Y. Changes in human gut flora with age: an Indian familial study. BMC microbiology. 2012;12:1. doi: 10.1186/1471-2180-12-222. [DOI] [PMC free article] [PubMed] [Google Scholar]
- 16.Seltenhammer MH, et al. Micromorphological changes in cardiac tissue of drug-related deaths with emphasis on chronic illicit opioid abuse. Addiction. 2013;108:1287–1295. doi: 10.1111/add.12106. [DOI] [PMC free article] [PubMed] [Google Scholar]
- 17.Degenhardt L, Larney S, Randall D, Burns L, Hall W. Causes of death in a cohort treated for opioid dependence between 1985 and 2005. Addiction. 2014;109:90–99. doi: 10.1111/add.12337. [DOI] [PubMed] [Google Scholar]
- 18.Quince C, et al. Extensive Modulation of the Fecal Metagenome in Children With Crohn|[rsquo]|s Disease During Exclusive Enteral Nutrition. American Journal of Gastroenterology. 2015;110:1718–1729. doi: 10.1038/ajg.2015.357. [DOI] [PMC free article] [PubMed] [Google Scholar]
- 19.Konturek PC, et al. Emerging role of fecal microbiota therapy in the treatment of gastrointestinal and extra-gastrointestinal diseases. J Physiol Pharmacol. 2015;66:483–491. [PubMed] [Google Scholar]
- 20.Volpe GE, et al. Associations of cocaine use and HIV infection with the intestinal microbiota, microbial translocation, and inflammation. Journal of Studies on Alcohol & Drugs. 2014;75:347–357. doi: 10.15288/jsad.2014.75.347. [DOI] [PMC free article] [PubMed] [Google Scholar]
- 21.Casén C, et al. Deviations in human gut microbiota: a novel diagnostic test for determining dysbiosis in patients with IBS or IBD. Alimentary Pharmacology & Therapeutics. 2015;42:71–83. doi: 10.1111/apt.13236. [DOI] [PMC free article] [PubMed] [Google Scholar]
- 22.Dinh DM, et al. Intestinal Microbiota, Microbial Translocation, and Systemic Inflammation in Chronic HIV Infection. Journal of Infectious Diseases. 2015;211:19–27. doi: 10.1093/infdis/jiu409. [DOI] [PMC free article] [PubMed] [Google Scholar]
- 23.Chen Y, et al. Dysbiosis of small intestinal microbiota in liver cirrhosis and its association with etiology. Scientific Reports. 2016;6:34055. doi: 10.1038/srep34055. [DOI] [PMC free article] [PubMed] [Google Scholar]
- 24.Masella AP, Bartram AK, Truszkowski JM, Brown DG, Neufeld JD. PANDAseq: paired-end assembler for illumina sequences. BMC bioinformatics. 2012;13:1. doi: 10.1186/1471-2105-13-31. [DOI] [PMC free article] [PubMed] [Google Scholar]
- 25.Edgar RC. Search and clustering orders of magnitude faster than BLAST. Bioinformatics. 2010;26:2460–2461. doi: 10.1093/bioinformatics/btq461. [DOI] [PubMed] [Google Scholar]
- 26.Edgar RC, Haas BJ, Clemente JC, Quince C, Knight R. UCHIME improves sensitivity and speed of chimera detection. Bioinformatics. 2011;27:2194–2200. doi: 10.1093/bioinformatics/btr381. [DOI] [PMC free article] [PubMed] [Google Scholar]
- 27.Caporaso JG, et al. PyNAST: a flexible tool for aligning sequences to a template alignment. Bioinformatics. 2010;26:266–267. doi: 10.1093/bioinformatics/btp636. [DOI] [PMC free article] [PubMed] [Google Scholar]
- 28.Wang Q, Garrity GM, Tiedje JM, Cole JR. Naive Bayesian classifier for rapid assignment of rRNA sequences into the new bacterial taxonomy. Applied and environmental microbiology. 2007;73:5261–5267. doi: 10.1128/AEM.00062-07. [DOI] [PMC free article] [PubMed] [Google Scholar]
- 29.Segata N, et al. Metagenomic biomarker discovery and explanation. Genome biology. 2011;12:1. doi: 10.1186/gb-2011-12-S1-P1. [DOI] [PMC free article] [PubMed] [Google Scholar]
Associated Data
This section collects any data citations, data availability statements, or supplementary materials included in this article.