Abstract
The transient diffusion of fluorescent tracers into biofilm cell clusters of Staphylococcus epidermidis was visualized by time lapse confocal scanning laser microscopy. Rhodamine B diffused into the center of cell clusters that were 200 to 600 μm in diameter within a few minutes. The apparent effective diffusion coefficient calculated from these data averaged 3.7 × 10⁻⁷ cm2 s−1 or 11% of the value in pure water. Fluorescein diffused into biofilm more rapidly, with a diffusion coefficient that averaged 1.6 × 10⁻⁶ cm2 s−1, or 32% of the value in water. This study provides direct, visual confirmation that solutes the size of many antibiotics and biocides can diffuse rapidly into biofilms.
One long-standing explanation for the antibiotic tolerance of microorganisms in biofilms is that the biofilm matrix constitutes a barrier to effective penetration of antimicrobial agents. If an antibiotic simply does not reach cells in the interior of a cluster, the failure of the agent to kill these cells is easy to understand. On the other hand, if the antibiotic can be shown to penetrate throughout the biofilm, then one must turn to biological explanations for antibiotic tolerance.
The objective of this study was to directly visualize the penetration of an antibiotic-sized tracer molecule into the interior of biofilm cell clusters, noninvasively and in real time. This was accomplished by using fluorescent dyes that were imaged by confocal scanning laser microscopy. Quantitative image analysis was performed to extract numerical values of the effective diffusion coefficient in the biofilm.
MATERIALS AND METHODS
Bacteria and media.
Staphylococcus epidermidis strain RP62A (ATCC 35984) was grown on tryptic soy broth (TSB) at 37°C. Full strength TSB was used to grow shake flask cultures that provided the inoculum for biofilm experiments. Biofilms were grown on 1/10 strength TSB.
Biofilm reactor.
Biofilms were grown in glass capillary tubes (Friedrich and Dimmock, Millville, N.J.) under continuous-flow conditions. Glass tubes were used rather than a more clinically relevant material because glass provided an optically clear substratum for microscopy. In addition, these capillary tubes had a square cross-section, which facilitated microscopic observation of the biofilm through the capillary walls. The nominal inside dimension of the tube was 0.9 mm, and it was approximately 10 cm long. Autoclaved 1/10 strength TSB was delivered to the capillary by gravity feed from a 5-liter carboy. The head difference from the feed carboy to the waste outlet was approximately 1.5 m. The flow rate of medium, which was monitored by counting drops passing through a flow break between the feed carboy and capillary, was between 120 and 180 ml h−1. This flow rate corresponds to a Reynolds number of 37 to 56 based on the hydraulic radius of the clean tube. The medium carboy and the reactor itself were placed inside separate 37°C incubators stacked on top of each other. The reactor was inoculated by injecting 1 to 2 ml of overnight culture into a septum just downstream of the glass capillary. The inoculated reactor was allowed to stand without flow for 2 h, after which flow was initiated. Biofilms were allowed to develop for 24 h in the continuous-flow mode. For microscope observations of biofilm, the capillary was placed in a holder (Biosurface Technologies, Bozeman, Mont.) that could be mounted on the microscope stage.
Tracer experiment and microscopy.
Two fluorescent tracers, rhodamine B and fluorescein, were used to study diffusion in S. epidermidis biofilms. These dyes were chosen because they are similar in size to many antibiotics and because they are relatively inexpensive. There are a few commercially available fluorescent antibiotics, but their cost would be prohibitive when used in a continuous-flow system like the one we describe. Biofilms were imaged by a Leica NT confocal scanning laser microscope in transmission mode with excitation from a 488-nm laser. For imaging rhodamine B diffusion, a 568-nm laser line was used for excitation and the fluorescent signal was detected in a red channel (585- to 615-nm band pass filter). For imaging fluorescein, a 488-nm laser line was used for excitation and the fluorescence emission was detected in a green channel (500- to 550-nm band pass filter). A 20× oil immersion objective was used for these experiments. After a suitable cell cluster was located in the transmission mode, the focal plane was set approximately 10 to 20 μm below the glass and inside the cluster. The microscope settings were changed from transmission mode to fluorescence mode to image either rhodamine B or fluorescein. A time series was initiated in which an image was collected every 5 s. At the same time, the flow of phosphate-buffered saline through the capillary was changed to buffer containing 5 mg of rhodamine B (Eastman Organic Chemicals, Rochester, N. Y.) per liter or 50 mg of disodium fluorescein (Sigma Aldrich, Milwaukee, Wis.) per liter. The time series typically ran for 5 to 10 min. Images were analyzed in MetaMorph software (Universal Imaging Corporation, Downington, Pa.).
Some experiments were performed in which a biofilm was exposed to both rhodamine B and fluorescein. This was done sequentially. First the biofilm was stained with rhodamine B. Then buffer was pumped through, and the experimenter waited for the rhodamine B to desorb and diffuse out of the biofilm. The fluorescein penetration experiment was then performed while the same spot in the biofilm was examined.
Estimation of diffusion coefficient.
The fluorescence intensity at the center of a biofilm cell cluster was extracted at each time point by using the MetaMorph software. The resulting intensity versus time data were exported to a spreadsheet. The solution to the diffusion equation in spherical coordinates (1) was fitted to the experimental data by adjusting the values of two parameters, the steady-state staining intensity and the effective diffusion coefficient, to minimize the sum or errors squared. The mean radius of the cell cluster was estimated from the transmission image of the cell cluster.
RESULTS
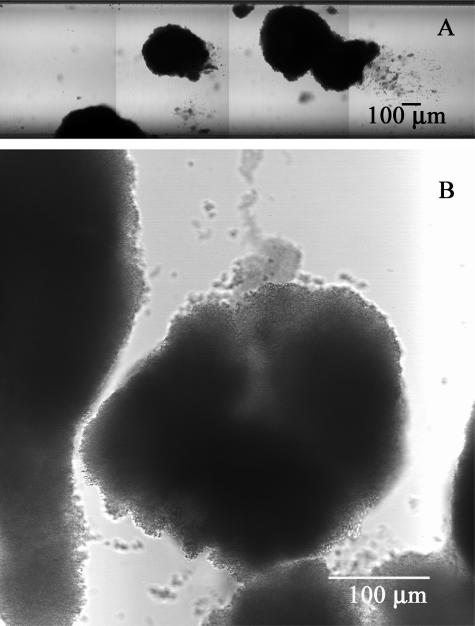
S. epidermidis formed extensive, heterogeneous biofilms in glass capillary tubes after 24 h of continuous development at 37°C (Fig. 1A). Thick biofilm formed in the corners of the flow cell and also occasionally as large clusters in the middle of the tube walls (Fig. 1B). These isolated, rounded clusters were used for diffusion measurements. There were significant areas of the tube that had little or no biofilm accumulation.
FIG. 1.
Transmission mode scanning laser microscopy of S. epidermidis biofilms grown in glass capillary tubes. Panel A shows a section of the tube at low magnification, and panel B shows a cell cluster used for a diffusion experiment. Flow was from left to right in panel A and top to bottom in panel B.
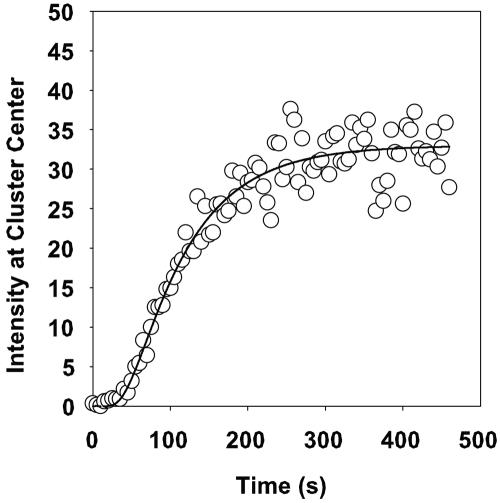
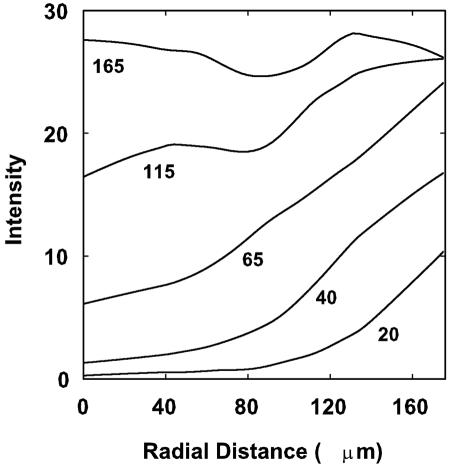
The diffusion of rhodamine into the interior of cell clusters was imaged (Fig. 2). The dye first stained the periphery of a cell cluster and then progressively moved inward toward the center of the cluster (Fig. 2). A movie of this sequence can be viewed at http://www.erc.montana.edu/Res-Lib99-SW/Movies/Database/MD_DisplayScript.asp. The centers of cell clusters were the last regions to take up the stain. Image analysis of the intensity of red fluorescence at the center of the cell cluster allowed the diffusive penetration of the dye to be quantified (Fig. 3). Typical S-shaped curves were measured in these experiments. Image analysis was also applied to describe the radial profiles of staining intensity at different time points (Fig. 4).
FIG. 2.
Transient diffusion of rhodamine B into a S. epidermidis biofilm cell cluster imaged by confocal scanning laser microscopy. The time indicated is the time, in seconds, after the first appearance of the dye in the flow cell. The cell cluster shown is the same as that shown in Fig. 1B. A movie of this sequence can be viewed at http://www.erc.montana.edu/Res-Lib99-SW/Movies/Database/MD_DisplayScript.asp.
FIG. 3.
Rhodamine B staining intensity at the center of a S. epidermidis biofilm cell cluster for the experiment dated 14 February 2003. Time zero corresponds to the first appearance of the dye in the flow cell. Open circles represent experimental data, and the line indicates the fitted diffusion equation in spherical coordinates.
FIG. 4.
Profiles of rhodamine B staining intensity along radial transects through a S. epidermidis biofilm cell cluster for the experiment dated 14 February 2003. Zero on the x axis corresponds to the center of the cell clusters. Each curve is labeled with a time, in seconds, where time zero corresponds to the first appearance of the dye in the flow cell. Data were smoothed by the Lowess function to obtain the curves shown.
We attempted to use a higher-magnification objective to address the question of whether there could be localized regions in the cluster interior where some of the cells were not stained by rhodamine B. While individual cells at the periphery of cell clusters could be resolved, it was not possible to obtain clear images of individual cells in the interior of cell clusters. This is probably due to the high cell density and relative opacity of these biofilms. Though clear pictures are lacking, these high-magnification explorations turned up no evidence for pockets of cells that were not accessed by the stain. Images at higher magnification suggested tight mosaics of cells, all of which were stained by the dye.
The time scale for diffusive penetration of rhodamine B into S. epidermidis cell clusters, defined as the time required to attain 90% of the equilibrium staining intensity at the center of the cell cluster, ranged from 1.1 to 6.7 min for cell clusters ranging in diameter from about 240 to 590 μm (Table 1). The effective diffusion coefficients derived from these data ranged from 2.0 × 10⁻⁷ to 6.5 × 10⁻⁷ cm2 s−1, or 6 to 18% of the diffusion coefficient in pure water (Table 1). The mean relative effective diffusion coefficient (the value in biofilm divided by the value in water) was 0.11 ± 0.05. The uncertainty indicated is the standard deviation. The diffusion coefficient of rhodamine B in water at 21.5°C, as calculated from the Wilke-Chang correlation, is 3.6 × 10⁻⁶ cm2 s−1. There was no apparent trend of diffusion coefficient with cluster size.
TABLE 1.
Summary of measured effective diffusion coefficients of rhodamine B in S. epidermidis biofilma
| Date of expt (mo-day-yr) | R (μm) | T50 (s) | T90 (s) | De (cm2/s) | De/Daq |
|---|---|---|---|---|---|
| 2-14-03 | 176 | 104 | 227 | 4.2 × 10⁻⁷ | 0.12 |
| 4-2-03 | 156 | 170 | 365 | 2.0 × 10⁻⁷ | 0.06 |
| 4-9-03 | 118 | 30 | 65 | 6.5 × 10⁻⁷ | 0.18 |
| 9-26-03 | 149 | 97 | 210 | 3.2 × 10⁻⁷ | 0.09 |
| 9-26-03 | 121 | 93 | 204 | 2.2 × 10⁻⁷ | 0.06 |
| 10-3-03 | 182 | 140 | 312 | 3.2 × 10⁻⁷ | 0.09 |
| 10-17-03 | 208 | 206 | 390 | 3.1 × 10⁻⁷ | 0.09 |
| 10-31-03 | 293 | 177 | 400 | 6.5 × 10⁻⁷ | 0.18 |
| 11-7-03 | 179 | 164 | 349 | 2.8 × 10⁻⁷ | 0.08 |
R, cell cluster radius; T50, time required to attain 50% of the equilibrium concentration at the cluster center; T90, time required to attain 90% of the equilibrium concentration at the cluster center; De, effective diffusion coefficient; De/Daq, relative effective diffusion coefficient. Mean De, 3.7 × 10⁻⁷; mean De/Daq, 0.11.
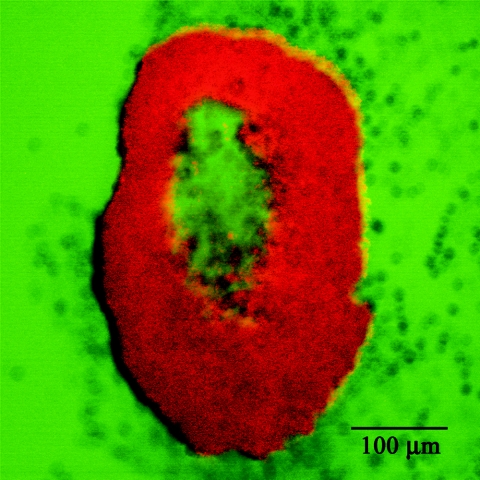
The behavior exhibited by fluorescein in S. epidermidis biofilm was different from that of rhodamine B. Rhodamine B fluorescence was brighter in biofilm than it was in the bulk fluid (Fig. 5), suggesting that this dye bound to the biofilm matrix and was concentrated there. In contrast, fluorescein did not stain the biofilm. Fluorescein fluorescence was strongest in the fluid outside the biofilm, while the biofilm itself remained dark even after prolonged incubation with the dye (Fig. 5). This suggested that fluorescein did not bind to the biofilm but was repelled by the biofilm matrix. Fluorescein fluorescence may also be quenched by the extracellular polymeric matrix of the biofilm. In some biofilm cell clusters, hollow centers were noted. These hollow regions were evident as zones that failed to stain with rhodamine B (Fig. 5) but did exhibit fluorescein fluorescence (Fig. 5). This observation shows that while fluorescein did not sorb to the biofilm matrix, it was able to permeate the matrix.
FIG. 5.
A hollow S. epidermidis biofilm cell cluster stained with rhodamine B (red) and negatively stained by fluorescein (green).
We note that the holes seen in some cell clusters are real; they have been confirmed by microscopic examination of cryosections, by transmission electron microscopy, and by magnetic resonance microscopy (data not shown).
In several cell clusters with such hollow centers, the diffusive penetration of fluorescein was measured by time lapse microscopy by using the same protocols used for rhodamine B. The time required to attain 90% of the equilibrium staining intensity at the center of the cell cluster ranged from 1.4 to 2.2 min for cell clusters ranging in diameter from about 360 to 590 μm (Table 2). The effective diffusion coefficients derived from these data ranged from 1.0 × 10⁻⁶ to 2.1 × 10⁻⁶ cm2 s−1, or 20 to 43% of the diffusion coefficient in pure water (Table 2). The mean relative effective diffusion coefficient for fluorescein was 0.32 ± 0.10, where the uncertainty indicated is the standard deviation. The diffusion coefficient of fluorescein in water at 21.5°C, as calculated from the Wilke-Chang correlation, is 4.9 × 10⁻⁶ cm2 s−1.
TABLE 2.
Summary of measured effective diffusion coefficients of fluorescein in S. epidermidis biofilma
| Date of expt (mo-day-yr) | R (μm) | T50 (s) | T90 (s) | De (cm2/s) | De/Daq |
|---|---|---|---|---|---|
| 10-3-03 | 182 | 49 | 105 | 9.6 × 10⁻⁷ | 0.20 |
| 10-3-03 | 234 | 39 | 85 | 1.9 × 10⁻⁶ | 0.39 |
| 10-17-03 | 208 | 48 | 130 | 1.2 × 10⁻⁶ | 0.24 |
| 10-17-03 | 231 | 47 | 110 | 1.6 × 10⁻⁶ | 0.32 |
| 10-31-03 | 293 | 59 | 109 | 2.1 × 10⁻⁶ | 0.43 |
R, cell cluster radius; T50, time required to attain 50% of the equilibrium concentration at the cluster center; T90, time required to attain 90% of the equilibrium concentration at the cluster center; De, effective diffusion coefficient; De/Daq, relative effective diffusion coefficient. Mean De, 1.6 × 10⁻⁶; mean De/Daq, 0.32.
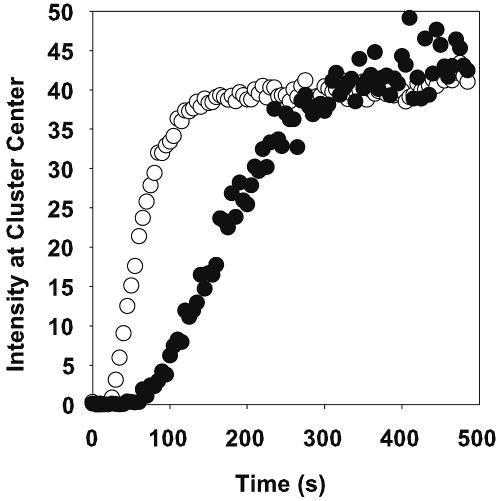
The relative diffusion coefficient of fluorescein was statistically significantly greater than that for rhodamine B by a factor of 2.9 (P = 0.006 by two-sided t test). In three experiments in which the diffusion of rhodamine B and fluorescein was measured in the same cell cluster, the diffusion coefficient for fluorescein averaged 3.0 times that for rhodamine (Fig. 6). In these three experiments, the relative effective diffusion coefficient for fluorescein averaged 2.4 times that for rhodamine B.
FIG. 6.
Rhodamine B (•) and fluorescein (○) staining intensity at the center of the same S. epidermidis cell cluster. Time zero corresponds to the first appearance of the dye in the flow cell.
DISCUSSION
Confocal scanning laser microscopy has enabled the direct visualization of the diffusive penetration of fluorescent dyes into staphylococcal biofilm cell clusters, noninvasively and under continuous-flow conditions. Fluorescent tracers with molecular weights (MWs) of approximately 400 saturated the interior of cell clusters that were a few hundred micrometers in diameter within a few minutes. This qualitative result shows that the biofilm matrix does not exclude solutes of this size. By approximating cell clusters as hemispheres, it was possible to make quantitative determinations of effective diffusion coefficients in these biofilms.
The relative diffusion coefficients for rhodamine B (0.32) and fluorescein (0.11) in a staphylococcal biofilm measured in this investigation agree with reported relative effective diffusion coefficients for solutes of similar size in biofilms. The MW of rhodamine B is 442 and of fluorescein is 376. The mean relative effective diffusion coefficient for sucrose (MW, 342) in various biofilms is 0.19 (5). The relative diffusivity of the antibiotic ciprofloxacin (MW, 330) in Pseudomonas aeruginosa biofilms was reported to be 0.31 (8). The relative diffusion coefficient of chlorhexidine digluconate (MW, 898) in Candida albicans biofilms was approximately 0.2 (7). Tatevossian (9) reported a relative effective diffusion coefficient of inulin (MW, ∼5,200) of 0.12 in dental plaque. Together these measurements suggest that solutes with MWs in the range of a few hundred to a few thousand diffuse in biofilms at 10 to 35% of the rate they do in pure water.
Our conclusion that antibiotic-sized solutes penetrate S. epidermidis biofilms is consistent with the few reports in which antibiotic penetration has been experimentally measured in biofilms formed by this microorganism (2, 3, 10, 11). The rapid penetration we observed is also in agreement with the work of Stone et al. (6), who used confocal scanning laser microscopy to demonstrate tetracycline permeation throughout Escherichia coli biofilms within 3 min.
The progressive pattern of inward diffusion (Fig. 2) was symmetric in every experiment. More specifically, there was no difference in the permeation of dyes on the upstream and downstream edges of a cell cluster. If convective flow within the cell cluster contributed to the transport of the tracer, then one would expect to see greater penetration of dyes on the upstream edge of the cluster than on the downstream edge. The fact that this was not observed confirms that convective transport inside the cell cluster was insignificant.
The slower diffusion of rhodamine B compared to fluorescein was likely due to adsorbtion of rhodamine B to the biofilm matrix. Sorption is predicted, on theoretical grounds, to retard the penetration of a solute diffusing in a heterogeneous medium (4). While rhodamine B clearly bound to the biofilm, there was no indication that fluorescein interacted with the biofilm matrix (Fig. 5).
The inability of antimicrobial agents to control microorganisms in biofilms is often attributed to the failure of these agents to penetrate the biofilm. This explanation is simple and intuitive and could apply to antimicrobial agents of diverse chemistries. But this hypothesis is probably incorrect. As the visual and quantitative data reported in this article demonstrate, there is no generic physical barrier to the permeation of solutes the size of most biocides and antibiotics into microbial biofilm. Antimicrobial agents likely do penetrate biofilms in most cases, except when subject to rapid neutralizing reactions in the biofilm (4, 5). Mechanisms of biofilm protection that derive from the biology of microorganisms in biofilms should be pursued.
Acknowledgments
This work was supported by an award from the W. M. Keck Foundation.
REFERENCES
- 1.Carslaw, H. S., and J. C. Jaeger. 1959. Conduction of heat in solids. Oxford University Press, Oxford, United Kingdom.
- 2.Darouiche, R. O., A. Dhir, A. J. Miller, G. C. Landon, I. I. Raad, D. M. Musher. 1994. Vancomycin penetration into biofilm covering infected prostheses and effect on bacteria. J. Infect. Dis. 170:720-723. [DOI] [PubMed] [Google Scholar]
- 3.Dunne, W. M., Jr., E. O. Mason, Jr., and S. L. Kaplan. 1993. Diffusion of rifampin and vancomycin through a Staphylococcus epidermidis biofilm. Antimicrob. Agents Chemother. 37:2522-2526. [DOI] [PMC free article] [PubMed] [Google Scholar]
- 4.Stewart, P. S. 1996. Theoretical aspects of antibiotic diffusion into microbial biofilms. Antimicrob. Agents Chemother. 40:2517-2522. [DOI] [PMC free article] [PubMed] [Google Scholar]
- 5.Stewart, P. S. 2003. Diffusion in biofilms. J. Bacteriol. 185:1485-1491. [DOI] [PMC free article] [PubMed] [Google Scholar]
- 6.Stone, G., P. Wood, L. Dixon, M. Keyhan, and A. Matin. 2002. Tetracycline rapidly reaches all the constituent cells of uropathogenic Escherichia coli biofilms. Antimicrob. Agents Chemother. 46:2458-2461. [DOI] [PMC free article] [PubMed] [Google Scholar]
- 7.Suci, P. A., G. G. Geesey, and B. J. Tyler. 2001. Integration of Raman microscopy, differential interference contrast microscopy, and attenuated total reflection Fourier transform infrared spectroscopy to investigate chlorhexidine spatial and temporal distribution in Candida albicans biofilms. J. Microbiol. Meth. 46:193-208. [DOI] [PubMed] [Google Scholar]
- 8.Suci, P. A., M. W. Mittelman, F. P. Yu, and G. G. Geesey. 1994. Investigation of ciprofloxacin penetration into Pseudomonas aeruginosa biofilms. Antimicrob. Agents Chemother. 38:2125-2133. [DOI] [PMC free article] [PubMed] [Google Scholar]
- 9.Tatevossian, A. 1979. Diffusion of radiotracers in human dental plaque. Caries Res. 13:154-162. [DOI] [PubMed] [Google Scholar]
- 10.Yasuda, H., Y. Ajiki, T. Koga, and T. Yokota. 1994. Interaction between clarithromycin and biofilms formed by Staphylococcus epidermidis. Antimicrob. Agents Chemother. 38:138-141. [DOI] [PMC free article] [PubMed] [Google Scholar]
- 11.Zheng, Z., and P. S. Stewart. 2002. Penetration of rifampin through Staphylococcus epidermidis biofilms. Antimicrob. Agents Chemother. 46:900-903. [DOI] [PMC free article] [PubMed] [Google Scholar]


