

Abstract
Lafora disease (LD, OMIM 254780) is a fatal rare disorder characterized by epilepsy and neurodegeneration. Although in recent years a lot of information has been gained on the molecular basis of the neurodegeneration that accompanies LD, the molecular basis of epilepsy is poorly understood. Here, we present evidence indicating that the homeostasis of glutamate transporter GLT-1 (EAAT2) is compromised in mouse models of LD. Our results indicate that primary astrocytes from LD mice have reduced capacity of glutamate transport, probably because they present a reduction in the levels of the glutamate transporter at the plasma membrane. On the other hand, the overexpression in cellular models of laforin and malin, the two proteins related to LD, results in an accumulation of GLT-1 (EAAT2) at the plasma membrane and in a severe reduction of the ubiquitination of the transporter. All these results suggest that the laforin/malin complex slows down the endocytic recycling of the GLT-1 (EAAT2) transporter. Since, defects in the function of this transporter lead to excitotoxicity and epilepsy, we suggest that the epilepsy that accompanies LD could be due, at least in part, to deficiencies in the function of the GLT-1 (EAAT2) transporter.
Keywords: Lafora disease, epilepsy, glutamate transport, ubiquitination, endocytosis, protein recycling, EAAT2, GLT-1
1.- INTRODUCTION
Lafora progressive myoclonus epilepsy (Lafora disease, LD, OMIM 254780) is a fatal rare autosomal recessive neurodegenerative disorder with an onset when the patients are around 6 to 19 years of age. It is characterized by generalized multiple types of seizures, myoclonus and the accumulation of insoluble polyglucosan inclusions, called Lafora bodies (LBs), in the cytoplasm of neurons and other cells in peripheral tissues. As the disease progresses, patients present a rapid progressive dementia concomitant with an amplification of seizures leading to death within a decade after the first symptoms [1],[2]. Up to now, two main causative genes have been identified, EPM2A which encodes the dual specificity phosphatase laforin and EPM2B which encodes the E3-ubiquitin ligase malin. Although both proteins might have independent functions, it is now well known that laforin and malin form a functional complex, explaining why patients with mutations in the genes encoding either laforin or malin are neurologically and histologically indistinguishable [3]. It has been recently described that laforin and malin participate in several processes, such as glycogen biosynthesis [4],[5] or regulation of cellular protein homeostasis (proteostasis) (see [6] for review). However, in spite of the advances in the understanding of the molecular basis of LD, the mechanisms that lead to epilepsy are poorly known. Only recently it has been suggested that inhibitory GABAergic neurons could be affected in LD [7],[8], yielding some preliminary insights into how epilepsy develops in LD patients.
In this work we present evidence indicating that the homeostasis of glutamate transporter GLT-1, called EAAT2 (Excitatory AminoAcid Transporter 2) in humans, is affected in mouse primary astrocytes lacking either EPM2A or EPM2B genes. Glutamate is the main excitatory neurotransmitter in the central nervous system and it is implicated in important physiological and pathological processes. It is also well known the importance of the homeostasis of this neurotransmitter in a healthy brain: when glutamate is released in the synaptic cleft, it must be rapidly taken up by different transporters in order to prevent glutamate receptors overstimulation, as this can lead to neuronal injury and death in a process known as excitotoxicity [9]. GLT-1 (EAAT2) transporter is responsible of up to 90% of glutamate uptake, and it is expressed mainly in perisynaptic astrocytes [10],[11],[12],[13]. This transporter is incorporated into the astrocytic plasma membrane by exocytosis in a Ca2+ dependent manner [14], and recycled by endocytosis upon PKC activation and Nedd4.2-mediated ubiquitination [15],[16],[17]. Other groups have also described the sumoylation at the C-terminal tail as a mechanism of regulation of EAAT2 localization, since EAAT2 sumoylation retains the transporter in intracellular compartments [18]. However, the mechanisms regulating EAAT2 trafficking are still far from being understood.
There is an increasing evidence of the importance of EAAT2 dysfunction in different neurological disorders. Defects in the clearance of glutamate from the synaptic cleft by EAAT2 appear in a wide variety of neurodegenerative diseases, ranging from Alzheimer’s disease [19], to amyotrophic lateral sclerosis (ALS) [20], including epilepsy [21]. Dysfunctions in the regulation of the subcellular localization of EAAT2 may conduct to altered glutamate uptake and excitotoxicity [13], [22], and this could be responsible for the establishment of these and other neurological disorders. Thus, understanding the molecular elements participating in the homeostasis of EAAT2 becomes an interesting goal to achieve. In this work we present evidence indicating that the subcellular location of GLT-1 (EAAT2) transporter is altered in Lafora disease cellular and mouse models and that laforin and malin affects the endocytic recycling of this transporter.
2.- MATERIALS AND METHODS
2.1.- Ethic statement, animal care, mice and husbandry
This study was carried out in strict accordance with the recommendations in the Guide for the Care and Use of Laboratory Animals of the Consejo Superior de Investigaciones Cientificas (CSIC, Spain). All mouse procedures were approved by the animal committee of the Instituto de Biomedicina de Valencia-CSIC [Permit Number: INTRA12 (IBV-4)]. All efforts were made to minimize animal suffering. To eliminate the effect of differences in the genetic background of the animals, we backcrossed Epm2a−/− and Epm2b−/− mice (with a mixed background 129sv:C57BL/6) previously described [23],[24] with control C57BL/6JRccHsd mice obtained from Harlan laboratories (Barcelona, Spain), ten times to obtain homozygous Epm2a−/− and Epm2b−/− in a pure background. Mice were maintained in the IBV-CSIC facility on a 12/12 light/dark cycle under constant temperature (23°C) with food and water provided ad libitum.
2.2.- Mammalian cell cultures
Human neuroblastoma SH-SY5Y cells [kindly provided by Dr. Domingo Barettino (Institute of Biomedicine of Valencia, CSIC, Valencia, Spain)] were grown in Dulbecco’s Modified Medium/Nutrient Mixture F-12 (Life Technology, Madrid, Spain) supplemented with 15% inactivated fetal bovine serum (FBS) (Invitrogen, Madrid, Spain), 1% L-glutamine, 100 units/ml penicillin and 100 μg/ml streptomycin. Human embryonic kidney (HEK293) cells were grown in Dulbecco’s Modified Medium (Lonza, Barcelona, Spain), supplemented with 10% inactivated FBS, 1% L-glutamine, 100 units/ml penicillin and 100 μg/ml streptomycin. Both cell types were grown in a humidified atmosphere at 37°C and 5% CO2.
2.3.- Mouse primary astrocyte cell cultures
Mouse primary astrocyte cell cultures from control, Epm2a−/− and Epm2b−/− mice were obtained from newborn mice cortices as previously described [25]. Cells were grown in Dulbecco’s modified Eagle’s medium (Lonza, Barcelona, Spain) containing 20% of inactivated fetal bovine serum (FBS), supplemented with 1% L-glutamine, 1% glucose, 1% fungizone, 100 units/ml penicillin and 100 μg/ml streptomycin, in a humidified atmosphere at 37°C with 5% CO2. After the first week, FBS was reduced to 10%. The purity of astrocytes was confirmed by immunofluorescence using anti-GFAP (an astrocyte marker; Sigma-Aldrich, Madrid, Spain), anti-Neurotrophin 3 (a neuron marker; Chemicon International, Madrid, Spain) and anti-Iba-1 (a microglia marker; Wako Chemicals, Richmond, USA).
2.4.- Flow cytometry analyses
Mouse primary astrocytes and human neuroblastoma SH-SY5Y cells were plated in 60 mm diameter culture dishes and grown in the corresponding media described above in a humidified atmosphere at 37°C with 5% CO2. Cells were transfected with the indicated plasmids and 24 hours after transfection, they were washed twice with cold PBS, incubated with anti-EAAT2 antibodies (Santa Cruz Biotechnology, Madrid, Spain) at 4°C for 30 minutes, washed twice with cold PBS and incubated with phycoerythrin-conjugated goat anti-mouse antibodies (Santa Cruz Biotechnology, Madrid, Spain) for 30 min at 4°C. Cells were washed again twice with cold PBS and fixed with 4% paraformaldehyde in PBS for 20 minutes. Cells were finally detached with trypsin for 5 minutes at 37°C and suspended. Cell bound fluorescence was measured in a BD FACSCanto flow cytometer (BD Biosciences, Madrid, Spain) and analyzed by the software provided by the manufacturer.
2.5.- Glutamate uptake
Mouse primary astrocyte cell cultures from control, Epm2a−/− and Epm2b−/− mice were seeded 48h before the assay at a density of 2 × 10⁵ cells/well in a 48 wells plate and grown in Dulbecco’s modified Eagle’s medium (Lonza, Barcelona, Spain), supplemented with 100 units/ml penicillin, 100 μg/ml streptomycin, 2 mM glutamine and 10% of inactivated fetal bovine serum (Lonza, Barcelona, Spain) in a humidified atmosphere at 37°C with 5% CO2. Cells were washed twice with PBS at 37°C and then incubated with L-glutamate [2 μCi/ml L− [3H]glutamate (PerkinElmer, Madrid Spain)] in PBS at 37°C for 10 min. Incubations were carried out in triplicate. For each assay, parallel determinations were performed in a sodium-free PBS (NaCl was iso-osmotically substituted by choline chloride). Assays were stopped by aspiration followed by two washes with ice-cold PBS or sodium-free PBS respectively. Cells were lysed in 0.2 M NaOH and accumulated radioactivity measured in a liquid scintillation counter (PerkinElmer Liquid Scintillation Analyzer Tri-Carb 2800TR). Glutamate uptake was expressed as the fold change in radioactivity incorporation between cells treated with PBS and cells treated with sodium-free PBS, as sodium is required for the GLT-1 mediated co-transport of glutamate. Each experiment was repeated at least three times.
2.6.- Immunohistochemistry and immunohistofluorescence analyses
Male mice of 12 months of age were sacrificed by cervical dislocation. Brain was recovered and the two hemispheres separated, one conserved at −80°C for processing for western blot analyses, and the other hemisphere fixed in 4% paraformaldehyde in phosphate buffer saline (PBS) and dehydrated for posterior histological analyses. Dehydrated tissues were embedded in paraffin and sectioned at 4 μm. For immunohistochemistry analyses (IHC), sections were deparaffined, rehydrated, and warmed at 95°C for 10 min in 10 mM citrate buffer for antigen retrieval. Sections were blocked in blocking buffer (1% BSA – 5% FBS, in PBS) and incubated overnight at 4°C with primary anti-Nedd4 (Abcam, Cambridge, UK) antibody diluted at 1/200 in blocking buffer. After three washes of 10 min in PBS, sections were incubated for one hour at room temperature with biotin-conjugated rabbit secondary antibody diluted at 1/250 in blocking buffer, washed three times with PBS for 5 min, incubated with the immunopure ABC kit (Fisher scientific, Madrid, Spain) for 30 min in darkness, washed three times in PBS for 5 min and developed using metal enhanced dab method (Fisher scientific, Madrid, Spain). IHC sections were finally counterstained with haematoxylin (Sigma, Madrid, Spain), dehydrated and mounted in DPX (Merck, Germany). Images were acquired with a DM6000 Leica Microscope and analyzed with Image J software (NIH, Bethesda, MD).
For immunohistofluorescence analyses (IHF), sections were deparaffined, rehydrated, blocked with sodium borohydrate (1mg/mL) for 40 minutes to avoid autofluorescence and warmed at 95°C for 10 minutes in 10 mM citrate buffer for antigen retrieval. Sections were blocked in blocking buffer (1% BSA – 5%-FBS) and incubated overnight at 4°C with anti-EAAT2 antibody (Santa Cruz Biotechnology, Madrid, Spain), anti-glutamine synthase (Sigma, Madrid, Spain) or anti-GFAP (Sigma, Madrid, Spain), as indicated in each case. After three washes of 10 minutes in PBS, sections were incubated with Alexa Fluor 488-conjugated anti-mouse (Invitrogen, Madrid, Spain), Alexa Fluor 594-conjugated anti-rabbit (Invitrogen, Madrid, Spain), Texas Red-conjugated anti-mouse (Invitrogen, Madrid, Spain) or Alexa Fluor 488-conjugated anti-rabbit (Invitrogen, Madrid, Spain) for 45 minutes at room temperature in darkness. After two 10-minutes PBS washes, sections were incubated with DAPI 0.2 μg/mL (Sigma, Madrid, Spain) in PBS for ten minutes, washed again three times in PBS and mounted using Aqua-Poly/Mount coverslip medium (Polysciences, Inc. Eppelheim, Germany). Images were acquired with a Leica TCS SP8 confocal microscope (Leica, Wetzlar, Germany) and were processed with ImageJ software (NIH, Bethesda, MD).
2.7.- Immunofluorescence analyses
Mouse primary astrocyte cultures were grown on 12-wells plates containing coverslips during 24 hours. Cells were washed twice with cold phosphate saline buffer (PBS) at 4°C. Then, they were incubated with anti-EAAT2 antibody (Santa Cruz Biotechnology, Madrid, Spain) 30 minutes at 4°C. Cells were then washed twice with cold PBS and incubated with TexasRed-conjugated anti-mouse antibodies (Invitrogen, Madrid, Spain) for 30 minutes at 4°C. Cells were washed again with cold PBS and incubated with Wheat Germ Agglutinin (WGA) Alexa Fluor 488 conjugate (Invitrogen, Madrid, Spain) during 20 minutes at 4°C. After two washes with cold PBS, cells were finally fixed with 4% paraformaldehyde (PFA) in PBS for 20 minutes, washed three times in PBS and mounted on slices using Aqua-Poly/Mount coverslip medium (Polysciences, Inc. Eppelheim, Germany). Images were acquired with a Leica TCS SP8 confocal microscope (Leica, Wetzlar, Germany) and were processed with ImageJ software (NIH, Bethesda, MD).
2.8.- Plasmids
pCMV-6xHis-ubiquitin, pHA-malin, pFlag-malin, pHA-laforin and pFlag-laforin plasmids have been previously described [26]. pCMV-HA-Nedd4.2 plasmid was from Dr. Lynne Yenush (Instituto de Biologia Molecular y Celular de Plantas, CSIC, Valencia, Spain). pcDNA3-EAAT2 plasmid was a generous gift from Dr. Peter Dodd (School of Chemistry and Molecular Biosciences, University of Queensland, Queensland, Australia).
2.9.- Western blot analyses
Mouse brain homogenates were lysed in RIPA buffer [20 mM Tris-HCl, pH 7.5; 150 mM NaCl; 1 mM EDTA; 1% NP-40; 1 mM Na3VO4 and complete protease inhibitor cocktail (Roche Diagnostics, Barcelona, Spain)] for 20 min at 4°C and centrifuged at 10,000 g for 15 min. Cell culture extracts were prepared using lysis buffer [25 mMTrisHCl pH 7.4, 15 mM EDTA, 50 mM NaF, 0.6 M sucrose, 15 mM Na4P2O7, 1% nonidet P40, 10 mM NaCl, 1 mM PMSF, and a complete protease inhibitor mixture (Roche Diagnostics, Barcelona, Spain)]. Cells were lysed by repeated passage through 24G×5/8″ needle and whole lysates were centrifuged at 10,000 × g for 15 min. Supernatants were collected and 30 μg of total protein subjected to SDS-PAGE, transferred into nitrocellulose blotting membranes (GE Healthcare Life Sciences, Barcelona, Spain) and incubated with the appropriated antibodies: anti-EAAT2 from Santa Cruz Biotech (Barcelona, Spain); anti-Nedd4.2 and anti-Nedd4 from Abcam (Cambridge, UK), anti-actin, anti-HA and anti-Flag (Sigma, Madrid, Spain). After that, they were revealed using goat anti-mouse IRDye 680LT (LI-COR Biosciences, Germany) or goat anti-rabbit IRDye 800CW (LI-COR Biosciences, Germany) and images obtained with the Odyssey Infrared Imaging System (LI-COR Biosciences, Germany). The results were analyzed using the software Image Studio Lite version 3.1 (LI-COR Biosciences, Germany).
2.10.- Analysis of ubiquitination
HEK293 cells were co-transfected with plasmids pcDNA3-EAAT2, pCMV-6xHis-ubiquitin and, when indicated, with pFlag-malin and pFlag-laforin, or pCMV-HA-Nedd4.2, using X-treme GENE transfection reagent, according to the manufacturer’s instructions (Roche Diagnostics, Barcelona, Spain). After 18 h of transfection, cells were lysed in guanidinium hydrochloride to inhibit the action of deubiquitinases and ubiquitinated proteins purified by metal affinity chromatography as in [27]. Bound proteins and clarified extracts were analyzed by immunoblotting with the appropriate antibodies.
2.11.- Nedd4-2 and Nedd4 degradation assay
HEK293 cells were transfected with pFlag-laforin and pFlag-malin plasmids using X-treme GENE transfection reagent (Roche Diagnostics, Barcelona, Spain). 24 hours after transfection, 350 μM cycloheximide (Sigma, Madrid, Spain) was added to stop protein synthesis. At the indicated times (0 to 24 hours), cells were removed and lysed to analyze the amount of endogenous Nedd4-2 and Nedd4 relative to actin by SDS-PAGE and Western blot.
2.12.- qRT-PCR analyses
Dissected brain biopsies or primary astrocyte cultures were frozen in liquid nitrogen and stored at −80°C. Thawed samples were homogenized in 2 ml TRIPURE reagent (Roche Diagnostics, Manheim, Germany) and total RNA was isolated according to the manufacturer’s instructions. The concentration of the total RNA was determined using Thermo NanoDrop 2000 (Thermo Fisher Scientific inc., Waltham, USA). First strand cDNA was synthesized from 1 μg of total RNA using random hexamer and expand reverse transcriptase (Roche Diagnostics, Manheim, Germany). cDNA was used as a template for real-time PCR. PCR primers and fluorogenic TaqMan probe sets for each gene were designed using Universal probe library Service (Roche Molecular Biochemicals) to meet all TaqMan design guidelines (Universal probe #103 and suggested primers for SLC1A2 gene). Each PCR was carried out in a final volume of 25 μl of PCR Master Mix (Applied Biosystems), containing 200 nM of each primer and 40 nM of specific fluorescent probe. The cycle conditions were 20 s at 95°C for initial denaturing, followed by 35 cycles of 95°C for 3 s and 60°C for 30 s in the 7500 Fast Real-time PCR system (Applied biosystems). GAPDH was used as an internal standard. Each reaction was done in triplicate from at least three independent experiments. The relative amount of each mRNA was calculated using the second derivative comparative Ct method.
2.13.- Statistical analysis
Data are expressed as means with standard deviation. Statistical significance of differences between the groups was evaluated by a paired Student’s t-test with two-tailed distribution or by an ANOVA test in case of having more groups. The significance has been considered at * p < 0.05, ** p < 0.01, *** p < 0.001, as indicated in each case.
3.- RESULTS
3.1.- LD mice present a marked reactive astrogliosis in different brain areas
We have recently described that Epm2b−/− mice present a clear reactive astrogliosis in different areas of the hippocampus [28]. These results were in agreement with previous reports [29]. In order to check whether reactive astrogliosis was also present in Epm2a−/− mice we carried out an immunohistofluorescence analysis of hippocampal regions of both Epm2a−/− and Epm2b−/− mice of 12 months of age and compared them with healthy control animals. As shown in Fig. 1, both Epm2a−/− and Epm2b−/− mice presented an increased GFAP (Glial Fibrillary Acidic Protein) related staining, a recognized marker of reactive astrogliosis, in comparison with control animals. However, we observed no differences in the staining when we used anti-glutamine synthase (GS) antibodies (a general astrocyte marker) in the assay. Thus, we conclude that although there is no evident change in the number of total astrocytes in the studied sections, there is an increase in the number of astrocytes that have become reactive in Epm2a−/− and Epm2b−/− mouse brains. Similar results were obtained in the cortex and other brain sections (not shown). Therefore, both Epm2a−/− and Epm2b−/− mice present reactive astrogliosis in different brain areas.
Figure 1.
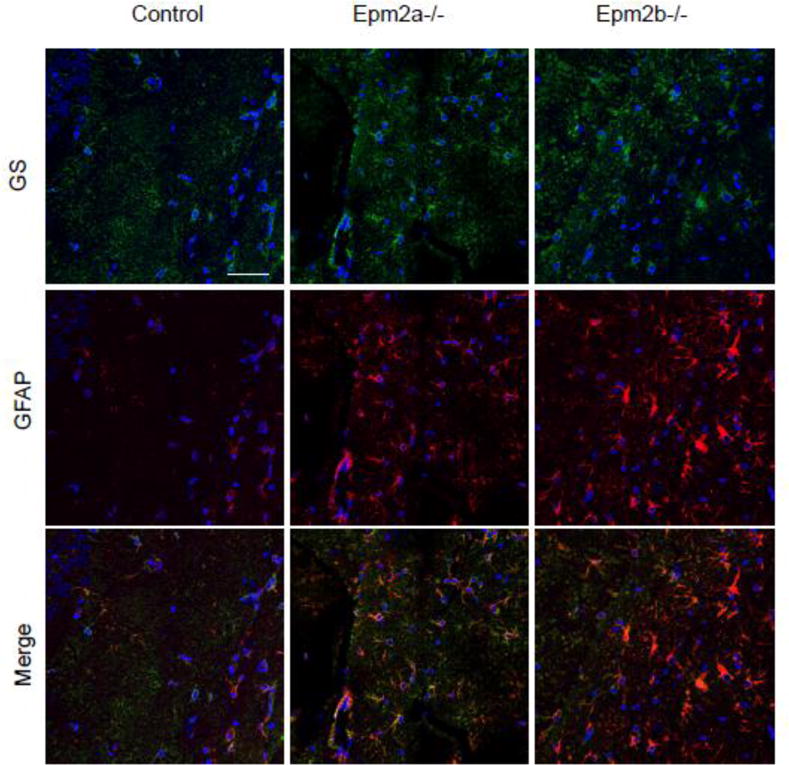
GFAP expression is increased in LD mice, indicating reactive astrogliosis. Hippocampal regions from 12 months old control, Epm2a−/− and Epm2b−/− mice were analyzed by immunohistofluorescence using anti-glutamine synthase (GS, in green, upper panels) and anti-GFAP (in red, middle panels) as primary antibodies and Alexa Fluor-488 conjugated anti-rabbit ant Texas red-conjugated anti-mouse as secondary antibodies. A merged analysis of both fluorescences is presented in the lower panels. A representative picture of the analysis of samples from three different mice of each type is presented. White bar: 50 μm.
3.2.- Astrocytes from LD mice present decreased levels of GLT-1 at the plasma membrane
Since reactive astrogliosis may change the physiological properties of affected astrocytes, and since one of the hallmarks of Lafora disease is epilepsy, we planned to study the functionality of different astrocytic channels and/or transporters related to epileptogenesis. We started the analysis with GLT-1 (EAAT2 in humans) glutamate transporter, since it is responsible of up to 90% of glutamate uptake [10],[11],[12],[13]. We analyzed the expression of the SLC1A2 gene encoding GLT-1 transporter and the total protein levels of this protein in different areas of the brain (hippocampus and cortex) of 12 month old mice by qRT-PCR, Western blotting and immunohistofluorescence. However, we found no statistical differences between control and Epm2a−/− or Epm2b−/− mice (Supplementary Fig. S1), suggesting that expression of GLT-1 is not affected in the brain of old LD mice is spite of the reactive astrogliosis present (Fig. 1).
Then, we analyzed the ability of primary astrocytes to transport glutamate and found that astrocytes from both Epm2a−/− and Epm2b−/− mice had lower capacity of glutamate uptake in comparison to primary astrocytes from control mice (Fig. 2). These results suggested that astrocytes from LD mice have reduced capacity for glutamate transport. We analyzed next whether there were differences in the levels of GLT-1 transporter, but again we found similar levels both at the level of the expression of corresponding SLC1A2 gene (Fig. 3A) and total protein (Fig. 3B) in the primary astrocytes from LD mice in comparison to healthy animals. Since GLT-1 is a protein mainly located at the plasma membrane of the astrocytes, being its localization regulated by ubiquitin-dependent endocytosis [15],[16],[17],[30], we decided to study whether the localization of this transporter was affected in primary astrocytes from LD mouse models. With this aim, we stained them with anti-EAAT2 antibodies and analyzed them by flow cytometry under native conditions, to label only the protein that was present at the outer surface of the plasma membrane. As observed in Fig. 3C, the relative fluorescence at the membrane surface was diminished in primary astrocytes from Epm2a−/− and Epm2b−/− mice respect to control mice, with a mean reduction of around 80% in the case of Epm2a−/− and around 64% in the case of Epm2b−/− mice. Primary astrocytes were also analyzed by immunofluorescence using anti-EAAT2 antibodies and wheat germ agglutinin (WGA, a plasma membrane marker) under native conditions. As observed in Fig. 3D, astrocytes from control mice presented a GLT-1-related fluorescence at the outer surface of the plasma membrane that co-localized with the wheat germ agglutinin marker. However, we observed a clear decrease in the fluorescence associated to GLT-1 protein in the case of the astrocytes from Epm2a−/− and Epm2b−/− in comparison to control mice. All these results indicate that astrocytes from LD mice present a decrease in the levels of GLT-1 at the plasma membrane and that this decrease is not due to altered total GLT-1 protein levels.
Figure 2.
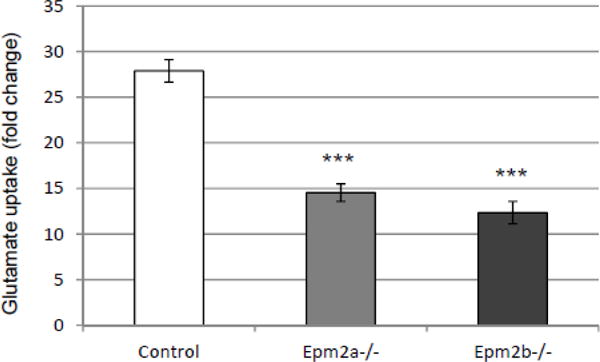
Glutamate uptake is impaired in primary astrocytes from LD mice. Glutamate uptake was carried out as described in Materials and Methods. As GLT-1 co-transports glutamate and Na+, results are expressed as the ratio between the glutamate uptake in a buffer containing Na+ and the glutamate uptake in an osmotically-equivalent buffer lacking Na+. Values are the mean of 5 different experiments (bars indicate standard deviation, asterisks denote significant differences comparing the corresponding groups with values from control astrocytes; ***p<0.001 using ANOVA test).
Figure 3.
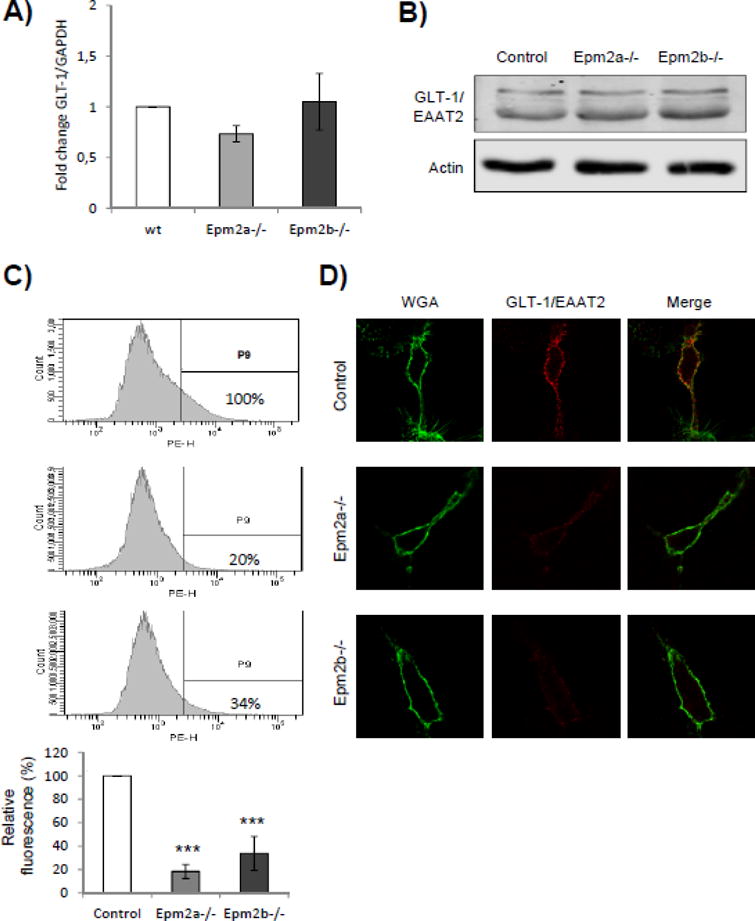
Levels of GLT-1 transporter are decreased at the plasma membrane of primary astrocytes from LD mice. A) qRT-PCR analysis of the expression of SLC1A2 gene encoding the GLT-1 glutamate transporter. qRT-PCR was performed in at least three independent samples of primary astrocytes from control and LD mice, as described in Materials and Methods; bars indicate standard deviation. B) Western blot analyses of the total levels of GLT-1 in primary astrocytes. Crude extracts (30 μg) from primary astrocytes from control and LD mice were prepared and analyzed by immunoblotting using anti-EAAT2 and anti-actin (loading control) antibodies. No differences were observed in the total amount of GLT-1 in the different samples. C) Analysis of the levels of GLT-1/EAAT2 transporter at the plasma membrane by flow cytometry. Primary astrocytes from control and LD mice were analyzed under native conditions by flow cytometry, as described in Materials and Methods, using mouse anti-EAAT2 and phycoerythrin-conjugated goat anti-mouse antibodies. Graphics represent the levels of phycoerythrin (PE)-dependent fluorescence respect to the number of cells (count); the vertical line separates the PE-dependent fluorescence (P9) from unspecific cellular signals (this threshold was determined using cells without anti-EAAT2 antibody). PE-dependent fluorescence levels in the samples were referred to the levels found in the primary astrocytes from control mice (100%). Flow cytometry analyses were repeated three times and the mean relative fluorescence of each type of primary astrocytes is indicated in the bottom panel (bars indicate standard deviation, asterisks denote significant differences comparing the corresponding groups with values from control astrocytes; ***p<0.001 using ANOVA test). D) Similar samples of these cells were also analyzed by immunofluorescence using anti-EAAT2 antibodies and Wheat Germ Agglutinin (WGA) Alexa Fluor 488 conjugate (to mark plasma membrane). Fluorescence of the two markers was merged to demonstrate the co-localization of the signals.
3.3.- Overexpression of laforin and malin increases the levels of EAAT2 at the plasma membrane
Since the absence of laforin or malin produced a decrease in the levels of GLT-1 at the plasma membrane in the astrocytes from LD mice, we decided to study the effect of the overexpression of laforin and malin on the subcellular localization of EAAT2, the human version of mouse GLT-1. In these studies we used human neuroblastoma SH-SY5Y cells, as they retain the ability to express endogenous EAAT2 transporter. SH-SY5Y cells were transfected with plasmids expressing laforin and malin and the levels of endogenous EAAT2 analyzed by different techniques. First, we confirmed by Western blotting that laforin and malin were overexpressed in SH-SY5Y cells (Fig. 4A) and observed that this overexpression did not alter the total levels of endogenous EAAT2 present in the cells (Fig. 4A). Second, we labelled with anti-EAAT2 antibodies the transfected cells and analyzed them by flow cytometry under native conditions, to label only the proteins that were present at the outer surface of the plasma membrane. As shown in Fig. 4B, SH-SY5Y cells expressing laforin and malin showed an increase in the fluorescence associated to EAAT2 at the surface of the plasma membrane (around 3.5 fold increase) respect to cells transfected with empty plasmids (mock cells). Taking together, all these results indicate that the overexpression of laforin and malin increases the levels of EAAT2 at the plasma membrane, without affecting the total cellular level of the protein.
Figure 4.
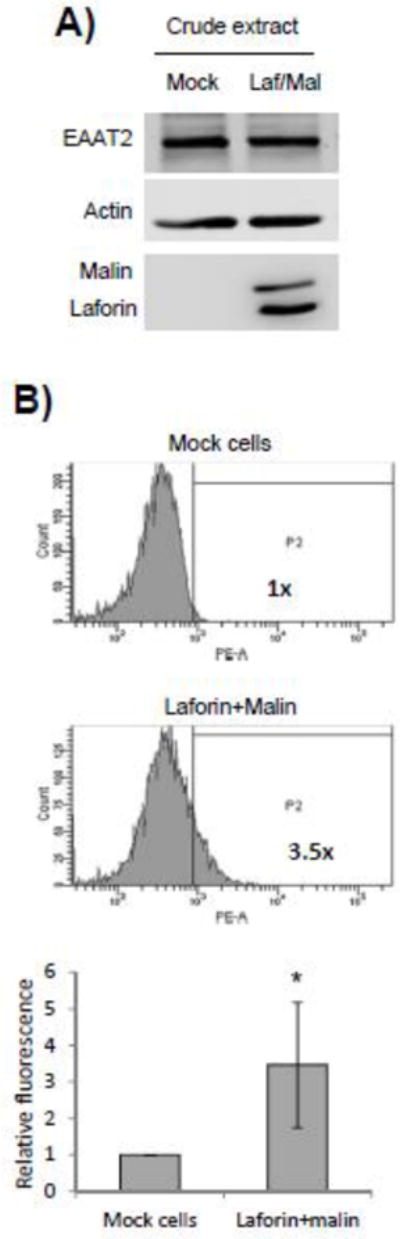
Protein levels of EAAT2 at the plasma membrane are increased in cells overexpressing laforin and malin. A) Human neuroblastoma SH-SY5Y cells were transfected with plasmids expressing Flag-laforin and Flag-malin. Crude extracts (30 μg) were prepared and the total levels of endogenous EAAT2 and actin analyzed by Western blotting. Similar crude extracts were also analyzed to demonstrate the overexpression of laforin and malin (anti-Flag antibody). B) SH-SY5Y cells transfected with plasmids expressing laforin and malin or with empty plasmids (mock cells) were analyzed under native conditions by flow cytometry, as described in Materials and Methods, using mouse anti-EAAT2 and phycoerythrin-conjugated goat anti-mouse antibodies. Graphics represent the levels of phycoerythrin (PE)-dependent fluorescence respect to the number of cells (count); the vertical line separates the PE-dependent fluorescence (P2) from unspecific cellular signals (this threshold was determined using cells without anti-EAAT2 antibody). PE-dependent fluorescence levels in the samples were referred to the levels found in the mock cells (1x). Flow cytometry analyses were repeated three times and the mean relative fluorescence indicated (lower panel; bar indicate standard deviation, asterisks denote significant differences comparing the corresponding groups; *p<0.05 using a paired Student’s t-test).
3.4.- Overexpression of laforin and malin prevents the ubiquitination of EAAT2
The fact that the levels of GLT-1 (EAAT2) at the plasma membrane were changing depending on the presence or not of laforin and malin suggested a possible involvement of these proteins on the trafficking/recycling of the GLT-1 (EAAT2) transporter. As indicated above, the plasma membrane localization of mouse GLT-1 transporter is regulated by ubiquitin-dependent endocytosis [15],[16],[17],[30]. Since laforin and malin form a functional complex in which laforin recruits specific substrates to be ubiquitinated by the E3-ubiquitin ligase activity of malin, we studied whether the overexpression of laforin and malin affected the ubiquitination status of GLT-1 (EAAT2) transporter. To carry out these experiments we used human embryonic kidney (HEK293) cells transfected with a plasmid expressing human EAAT2 (since the endogenous levels of this transporter are quite low in these cells), a plasmid expressing a modified form of ubiquitin with an N-terminal tag of 6xHis (to allow the purification of ubiquitinated proteins) and plasmids encoding laforin and malin. Twenty-four hours after transfection cells were lysed in guanidinium hydrochloride (to preserve ubiquitination of proteins by inhibiting the action of deubiquitinating enzymes) and ubiquitinated proteins recovered by metal affinity chromatography. Purified proteins were analyzed by Western blotting using anti-EAAT2 antibodies. As shown in Fig. 5, under regular conditions EAAT2 showed a clear pattern of ubiquitination (lane 2) that did not change when laforin alone was expressed (lane 3). However, when laforin and malin were expressed together, we observed a dramatic decrease in the recovery of ubiquitinated forms of EAAT2 (lane 5). This decrease was also observed in cells expressing malin alone (lane 4), probably because HEK293 cells contained enough endogenous laforin to allow malin to form the functional complex. These results indicated that, first, EAAT2 was not a direct ubiquitination substrate of the laforin/malin complex and second, that the regular ubiquitination of EAAT2 was prevented by the action of the laforin/malin complex. Since cells overexpressing laforin and malin contained higher levels of EAAT2 at the plasma membrane (Fig. 4; see above), the decrease in the ubiquitination status of EAAT2 by the overexpression of laforin and malin could be the reason why the transporter gets accumulated at the plasma membrane, due probably to an endocytic recycling failure of the transporter.
Figure 5.
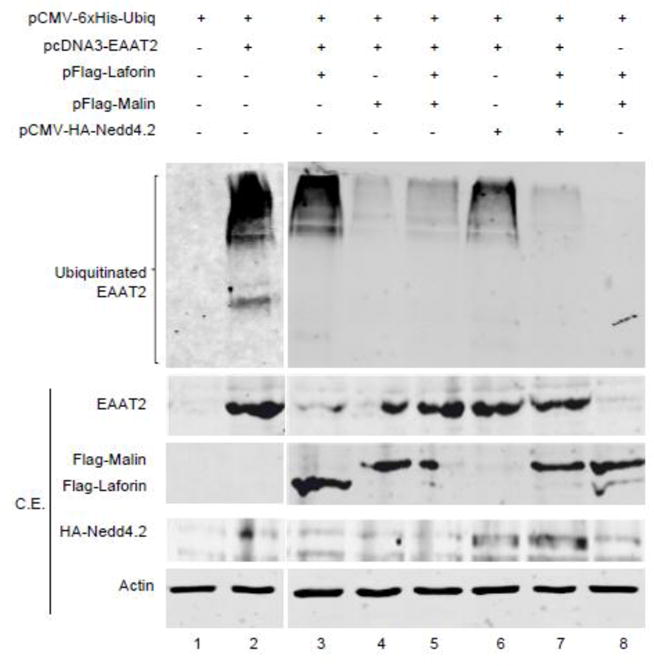
Ubiquitination of EAAT2 is decreased in cells overexpressing laforin and malin. HEK293 cells were transfected with the indicated plasmids. Ubiquitinated proteins were recovered by metal-affinity chromatography as indicated in Materials and Methods. Proteins bound to the metal-affinity column were analyzed by Western blotting using anti-EAAT2 antibodies. Crude extracts (CE, 30 μg) were also analyzed by Western blotting using the indicated antibodies: anti-EAAT2, anti-Flag (to detect Flag-laforin and Flag-malin), anti-HA (to detect HA-Nedd4.2) and anti-actin. The fuzzy bands in the CE are probably due to the presence of 6 M guanidinium hydrochoride in the extracts. Ubiquitinated forms of EAAT2 are indicated.
It has been described that the E3-ubiquitin ligase Nedd4.2 participates in the ubiquitination of EAAT2, regulating cell surface turnover of the transporter [16],[17]. We overexpressed Nedd4.2 in HEK293 cells in order to improve the ubiquitination of EAAT2, but we did not observe major differences respect to cells transfected with an empty plasmid (Fig. 5, compare lanes 3 and 6), probably because HEK293 cells may have enough endogenous Nedd4.2 protein to allow a maximal ubiquitination. However, in cells co-expressing Nedd4.2 and the laforin/malin complex we did not recover ubiquitinated forms of EAAT2 (Fig. 5, lane 7), indicating that the laforin/malin complex either inactivated Nedd4.2 and other alternative E3-ubiquitin ligases responsible for the modification of EAAT2, or affected alternative adaptor proteins that linked the action of these E3-ubiquitin ligases to EAAT2.
In order to explore whether Nedd4.2 could be a direct substrate of the laforin/malin complex, we analyzed if this complex could ubiquitinate this protein. However, when we performed these ubiquitination experiments in HEK293 cells we observed that although laforin and malin auto-ubiquitinated themselves (indicating that the complex was active), we did not observe any laforin/malin mediated ubiquitination of Nedd4.2, either when overexpressed as a fusion protein (HA-Nedd4.2) or when the endogenous levels of Nedd4.2 were analyzed in the same way (Supplementary Fig. S2A). We extended our analysis to Nedd4, the closest functional homologue of Nedd4.2, with similar negative results (Supplementary Fig. S2A). Next we studied whether laforin and malin could indirectly affect the half-life of Nedd4.2 or Nedd4. HEK293 cells were transfected with plasmids expressing laforin and malin, and then treated with cycloheximide to inhibit protein synthesis. As shown in Supplementary Fig. S2B, the presence of the laforin/malin complex did not affect significantly the half-life of endogenous Nedd4.2 and Nedd4 proteins present in HEK293 cells.
However, when we analyzed by immunohistochemistry different regions of the hippocampus of Epm2a−/−, Epm2b−/− and control mice of 12 months of age using specific anti-Nedd4 antibodies, we observed an increased staining in the samples corresponding to LD mice respect to similar sections from control animals (Fig. 6A) (we repeated the same experiment with anti-Nedd4.2 antibodies but they were not adequate for IHC techniques). Nevertheless, when we analyzed by Western blotting the levels of endogenous Nedd4.2 and Nedd4 in brain extracts from control and LD mice, we did not observe major differences (Fig. 6B). These results could suggest a putative negative correlation between the laforin/malin complex and the levels of Nedd4 in some particular neural cells. Alternatively, the laforin/malin complex might affect indirectly the subcellular localization of the GLT-1 (EAAT2) transporter by regulating other components of the EAAT2 ubiquitination reaction (i.e., E3-ubiquitin ligase adaptors).
Figure 6. Hippocampal regions of LD mice show higher levels of Nedd4.
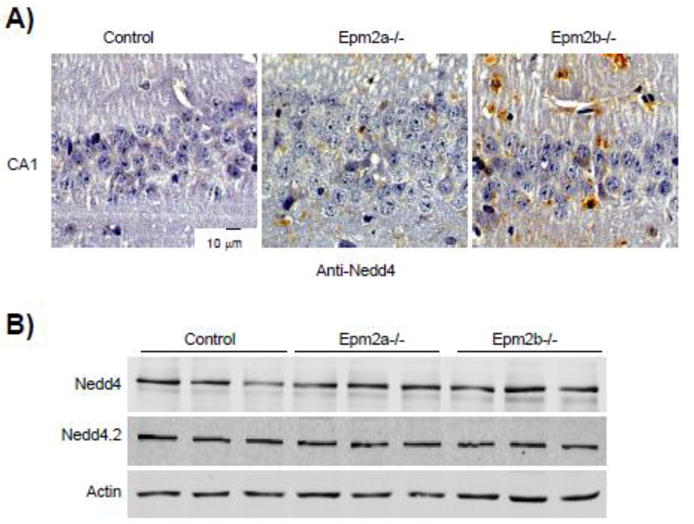
A) Hippocampal regions (cornus ammonis 1; CA1) from control, Epm2a−/− and Epm2b−/− mice of 12 months of age were analyzed by immunohistochemistry using anti-Nedd4 antibodies, as indicated in Materials and Methods. A representative picture of the analysis of samples from three different mice of each type is presented. B) Brain crude extracts (30 μg) from control and LD mice of 12 months of age were analyzed by Western blotting using anti-Nedd4, anti-Nedd4.2 and anti-actin antibodies.
4.- DISCUSSION
In recent years, several works have been published explaining part of the molecular basis of the dysfunctions present in Lafora disease (LD) (see [6],[31],[32] for review). However, we have poor information about the molecular determinants that are responsible for the epilepsy that accompanies the disease. In this work we present evidence indicating that the homeostasis of the GLT-1 (EAAT2) transporter is compromised in mouse models of LD. GLT-1 (EAAT2) is a protein mainly located at the plasma membrane of the astrocytes, being its localization regulated by ubiquitin-dependent endocytosis [15],[16],[17],[30]. Our results indicate that although the total protein levels of this transporter do not change in primary astrocytes from LD mouse models in comparison to astrocytes from control mice, the presence of GLT-1 (EAAT2) at the plasma membrane is reduced in primary astrocytes from LD mice. We also show that primary astrocytes from these mice have reduced capacity of glutamate transport, what is consistent with the reduced levels of the GLT-1 transporter in their plasma membrane. On the other hand, the overexpression of laforin and malin results in a severe reduction of ubiquitination of EAAT2 and a consequent accumulation of the transporter at the plasma membrane. Taking all these results together we suggest that the laforin/malin complex affects the endocytic recycling of the GLT-1 (EAAT2) transporter.
It is known that GLT-1 (EAAT2) is constitutively endocytosed into the recycling endosome via a clathrin-dependent pathway, a process that is dependent on the ubiquitination of the C-terminal domain of the transporter by the E3-ubiquitin ligase Nedd4.2 [16],[17]. Since the laforin/malin complex reduces the ubiquitination of EAAT2, even in cells overexpressing Nedd4.2, one possibility is that the complex affects the activity of Nedd4.2. In this sense, although we found that the laforin/malin complex did not ubiquitinate Nedd4.2 or its closest functional homologue Nedd4, we observed that in the absence of laforin or malin, Nedd4 was accumulated in specific neural cells of the hippocampus of LD mice. Therefore it seems that there is a negative correlation between the laforin/malin complex and the levels of Nedd4 in these cells.
Another possibility is that the laforin/malin complex could affect the endocytic recycling of GLT-1 (EAAT2) transporter by an indirect mechanism. It has been described that ubiquitination of substrates by Nedd4.2 is mediated by the binding of the E3-ubiquitin ligase to PPXY structural motifs present in its corresponding substrates [33],[34]. In substrates that do not contain a PPXY motif, Nedd4.2 binds to specific adaptors that bridge the binding of the E3-ubiquitin ligase to the substrate [35],[36],[37]. Since GLT-1 (EAAT2) transporter does not bear PPXY structural motifs [38], this implies the need for intermediate proteins to mediate the interaction of Nedd4.2 with GLT-1 (EAAT2). Perhaps the laforin/malin complex could affect the stability/activity of the intermediate adaptor, affecting in this way the overall functionality of the Nedd4.2-adaptor system.
In any case our results indicate that primary astrocytes from LD mice have lower ability for glutamate transport, probably because they have reduced levels of GLT-1 at the plasma membrane. Since defects in the function of this transporter lead to excitotoxicity and epilepsy [13],[21],[22], we suggest that the neuronal death and epilepsy that accompanies LD could be due, at least in part, to deficiencies in the function of the GLT-1 (EAAT2) transporter. Therefore, EAAT2 could be a good target to develop a treatment for epilepsy in LD.
Furthermore, defects in glutamate uptake could also contribute to other alterations observed in LD patients. The entry of glutamate mediated by EAAT2 transporter is essential to maintain high levels of intracellular glutamate to allow the uptake of cystine into the cells by the cystine/glutamate antiporter. As cystine is a precursor of the synthesis of glutathione, then glutamate uptake is essential for the synthesis of this metabolite, which plays an important role in redox detoxification [39]. For this reason, impairment of glutamate uptake could slow the synthesis of glutathione and favor oxidative damage in LD, what would be in agreement with the conditions of increased oxidative stress that have been recently described in this disease [40].
5.- CONCLUSIONS
In this work we present evidence indicating that glutamate transport is impaired in primary astrocytes from LD mice. This is probably due to altered homeostasis of the glutamate transporter GLT-1 (EAAT2) at the plasma membrane. Since defects in the function of this transporter lead to excitotoxicity and epilepsy, we suggest that the epilepsy that accompanies LD could be due, at least in part, to deficiencies in the function of the GLT-1 (EAAT2) transporter.
Highlights.
-
-
GLT-1 glutamate transporter is reduced at the membrane of astrocytes from LD mice.
-
-
Glutamate transport is also reduced in primary astrocytes from LD mice.
-
-
Overexpression of laforin and malin impairs ubiquitination of GLT-1 transporter.
-
-
The laforin/malin complex impairs the endocytic recycling of the GLT-1 transporter.
Acknowledgments
We thank Dr. Domingo Barettino, Dr. Lynne Yenush and Dr. Peter Dodd for materials and Dr. Consuelo Guerri for her help in preparing mouse primary astrocyte cell cultures. This work was supported by grants from the Spanish Ministry of Education and Science SAF2014-54604-C3-1-R, an ACCI2012 action from CIBERER, a grant from the Alicia Koplowitz Foundation (2015) and a grant from Generalitat Valenciana (PrometeoII/2014/029). A.B. held a postdoctoral fellowship from the Program “Junta para la Ampliación de Estudios” (JAE-Doc) co-funded by the European Social Fund (ESF). C.M-B holds a FPU fellowship from the Spanish Ministry of Education, Culture and Sports.
Abbreviations
- EAAT2
excitatory amino acid transporter 2
- GLT-1
glutamate transporter 1
- LD
Lafora disease
- IHC
immunohistochemistry
- IHF
immunohistofluorescence
- WGA
wheat germ agglutinin
Footnotes
Publisher's Disclaimer: This is a PDF file of an unedited manuscript that has been accepted for publication. As a service to our customers we are providing this early version of the manuscript. The manuscript will undergo copyediting, typesetting, and review of the resulting proof before it is published in its final citable form. Please note that during the production process errors may be discovered which could affect the content, and all legal disclaimers that apply to the journal pertain.
AUTHOR CONTRIBUTION STATEMENT
C.M-B., A.B. and R.V. carried out the experimental work. C.M-B., A.B., R.V. and P.S. analyzed the data. C.M-B. and P.S. wrote the paper.
DISCLOSURE/CONFLICT OF INTEREST
The authors declare no conflict of interest.
References
- 1.Delgado-Escueta AV. Advances in lafora progressive myoclonus epilepsy. Current neurology and neuroscience reports. 2007;7:428–433. doi: 10.1007/s11910-007-0066-7. [DOI] [PubMed] [Google Scholar]
- 2.Monaghan TS, Delanty N. Lafora disease: epidemiology, pathophysiology and management. CNS drugs. 2010;24:549–561. doi: 10.2165/11319250-000000000-00000. [DOI] [PubMed] [Google Scholar]
- 3.Gómez-Abad C, Gómez-Garre P, Gutiérrez-Delicado E, Saygi S, Michelucci R, Tassinari CA, Rodriguez de Cordoba S, Serratosa JM. Lafora disease due to EPM2B mutations. A clinical and genetic study. Neurology. 2005;64:982–986. doi: 10.1212/01.WNL.0000154519.10805.F7. [DOI] [PubMed] [Google Scholar]
- 4.Vilchez D, Ros S, Cifuentes D, Pujadas L, Valles J, Garcia-Fojeda B, Criado-Garcia O, Fernandez-Sanchez E, Medrano-Fernandez I, Dominguez J, Garcia-Rocha M, Soriano E, Rodriguez de Cordoba S, Guinovart JJ. Mechanism suppressing glycogen synthesis in neurons and its demise in progressive myoclonus epilepsy. Nature Neuroscience. 2007;10:1407–1413. doi: 10.1038/nn1998. [DOI] [PubMed] [Google Scholar]
- 5.Solaz-Fuster MC, Gimeno-Alcaniz JV, Ros S, Fernandez-Sanchez ME, Garcia-Fojeda B, Criado Garcia O, Vilchez D, Dominguez J, Garcia-Rocha M, Sanchez-Piris M, Aguado C, Knecht E, Serratosa J, Guinovart JJ, Sanz P, Rodriguez de Cordoba S. Regulation of glycogen synthesis by the laforin-malin complex is modulated by the AMP-activated protein kinase pathway. Hum Mol Genet. 2008;17:667–678. doi: 10.1093/hmg/ddm339. [DOI] [PubMed] [Google Scholar]
- 6.Roma-Mateo C, Aguado C, Luis Garcia-Gimenez J, Knecht E, Sanz P, Pallardo FV. Oxidative stress, a new hallmark in the pathophysiology of Lafora progressive myoclonus epilepsy. Free Radic Biol Med. 2015;88:30–41. doi: 10.1016/j.freeradbiomed.2015.01.034. [DOI] [PubMed] [Google Scholar]
- 7.Sharma J, Mukherjee D, Rao SN, Iyengar S, Shankar SK, Satishchandra P, Jana NR. Neuronatin-mediated aberrant calcium signaling and endoplasmic reticulum stress underlie neuropathology in Lafora disease. J Biol Chem. 2013;288:9482–9490. doi: 10.1074/jbc.M112.416180. [DOI] [PMC free article] [PubMed] [Google Scholar]
- 8.Ortolano S, Vieitez I, Agis-Balboa RC, Spuch C. Loss of GABAergic cortical neurons underlies the neuropathology of Lafora disease. Mol Brain. 2014;7:7. doi: 10.1186/1756-6606-7-7. [DOI] [PMC free article] [PubMed] [Google Scholar]
- 9.Choi DW, Maulucci-Gedde M, Kriegstein AR. Glutamate neurotoxicity in cortical cell culture. J Neurosci. 1987;7:357–368. doi: 10.1523/JNEUROSCI.07-02-00357.1987. [DOI] [PMC free article] [PubMed] [Google Scholar]
- 10.Kim K, Lee SG, Kegelman TP, Su ZZ, Das SK, Dash R, Dasgupta S, Barral PM, Hedvat M, Diaz P, Reed JC, Stebbins JL, Pellecchia M, Sarkar D, Fisher PB. Role of excitatory amino acid transporter-2 (EAAT2) and glutamate in neurodegeneration: opportunities for developing novel therapeutics. J Cell Physiol. 2011;226:2484–2493. doi: 10.1002/jcp.22609. [DOI] [PMC free article] [PubMed] [Google Scholar]
- 11.Lin CL, Kong Q, Cuny GD, Glicksman MA. Glutamate transporter EAAT2: a new target for the treatment of neurodegenerative diseases. Future Med Chem. 2012;4:1689–1700. doi: 10.4155/fmc.12.122. [DOI] [PMC free article] [PubMed] [Google Scholar]
- 12.Zhou Y, Danbolt NC. GABA and Glutamate Transporters in Brain. Front Endocrinol</jt> (Lausanne) 2013;4:165. doi: 10.3389/fendo.2013.00165. [DOI] [PMC free article] [PubMed] [Google Scholar]
- 13.Grewer C, Gameiro A, Rauen T. SLC1 glutamate transporters. Pflugers Arch. 2014;466:3–24. doi: 10.1007/s00424-013-1397-7. [DOI] [PMC free article] [PubMed] [Google Scholar]
- 14.Parpura V, Baker BJ, Jeras M, Zorec R. Regulated exocytosis in astrocytic signal integration. Neurochem Int. 2010;57:451–459. doi: 10.1016/j.neuint.2010.02.007. [DOI] [PMC free article] [PubMed] [Google Scholar]
- 15.Gonzalez-Gonzalez IM, Garcia-Tardon N, Gimenez C, Zafra F. PKC-dependent endocytosis of the GLT1 glutamate transporter depends on ubiquitylation of lysines located in a C-terminal cluster. Glia. 2008;56:963–974. doi: 10.1002/glia.20670. [DOI] [PubMed] [Google Scholar]
- 16.Martinez-Villarreal J, Garcia Tardon N, Ibanez I, Gimenez C, Zafra F. Cell surface turnover of the glutamate transporter GLT-1 is mediated by ubiquitination/deubiquitination. Glia. 2012;60:1356–1365. doi: 10.1002/glia.22354. [DOI] [PubMed] [Google Scholar]
- 17.Garcia-Tardon N, Gonzalez-Gonzalez IM, Martinez-Villarreal J, Fernandez-Sanchez E, Gimenez C, Zafra F. Protein kinase C (PKC)-promoted endocytosis of glutamate transporter GLT-1 requires ubiquitin ligase Nedd4-2-dependent ubiquitination but not phosphorylation. J Biol Chem. 2012;287:19177–19187. doi: 10.1074/jbc.M112.355909. [DOI] [PMC free article] [PubMed] [Google Scholar]
- 18.Foran E, Rosenblum L, Bogush A, Pasinelli P, Trotti D. Sumoylation of the astroglial glutamate transporter EAAT2 governs its intracellular compartmentalization. Glia. 2014;62:1241–1253. doi: 10.1002/glia.22677. [DOI] [PMC free article] [PubMed] [Google Scholar]
- 19.Masliah E, Alford M, DeTeresa R, Mallory M, Hansen L. Deficient glutamate transport is associated with neurodegeneration in Alzheimer’s disease. Annals of neurology. 1996;40:759–766. doi: 10.1002/ana.410400512. [DOI] [PubMed] [Google Scholar]
- 20.Rothstein JD, Martin LJ, Kuncl RW. Decreased glutamate transport by the brain and spinal cord in amyotrophic lateral sclerosis. N Engl J Med. 1992;326:1464–1468. doi: 10.1056/NEJM199205283262204. [DOI] [PubMed] [Google Scholar]
- 21.Tanaka K, Watase K, Manabe T, Yamada K, Watanabe M, Takahashi K, Iwama H, Nishikawa T, Ichihara N, Kikuchi T, Okuyama S, Kawashima N, Hori S, Takimoto M, Wada K. Epilepsy and exacerbation of brain injury in mice lacking the glutamate transporter GLT-1. Science. 1997;276:1699–1702. doi: 10.1126/science.276.5319.1699. [DOI] [PubMed] [Google Scholar]
- 22.Soni N, Reddy BV, Kumar P. GLT-1 transporter: An effective pharmacological target for various neurological disorders. Pharmacol Biochem Behav. 2014;127C:70–81. doi: 10.1016/j.pbb.2014.10.001. [DOI] [PubMed] [Google Scholar]
- 23.Aguado C, Sarkar S, Korolchuk VI, Criado O, Vernia S, Boya P, Sanz P, de Cordoba SR, Knecht E, Rubinsztein DC. Laforin, the most common protein mutated in Lafora disease, regulates autophagy. Hum Mol Genet. 2010;19:2867–2876. doi: 10.1093/hmg/ddq190. [DOI] [PMC free article] [PubMed] [Google Scholar]
- 24.Criado O, Aguado C, Gayarre J, Duran-Trio L, Garcia-Cabrero AM, Vernia S, San Millan B, Heredia M, Roma-Mateo C, Mouron S, Juana-Lopez L, Dominguez M, Navarro C, Serratosa JM, Sanchez M, Sanz P, Bovolenta P, Knecht E, Rodriguez de Cordoba S. Lafora bodies and neurological defects in malin-deficient mice correlate with impaired autophagy. Hum Mol Genet. 2012;21:1521–1533. doi: 10.1093/hmg/ddr590. [DOI] [PubMed] [Google Scholar]
- 25.Minana R, Sancho-Tello M, Climent E, Segui JM, Renau-Piqueras J, Guerri C. Intracellular location, temporal expression, and polysialylation of neural cell adhesion molecule in astrocytes in primary culture. Glia. 1998;24:415–427. [PubMed] [Google Scholar]
- 26.Rubio-Villena C, Garcia-Gimeno MA, Sanz P. Glycogenic activity of R6, a protein phosphatase 1 regulatory subunit, is modulated by the laforin-malin complex, Int. J Biochem Cell Biol. 2013;45:1479–1488. doi: 10.1016/j.biocel.2013.04.019. [DOI] [PubMed] [Google Scholar]
- 27.Kaiser P, Tagwerker C. Is this protein ubiquitinated? Methods in enzymology. 2005;399:243–248. doi: 10.1016/S0076-6879(05)99016-2. [DOI] [PubMed] [Google Scholar]
- 28.Berthier A, Paya M, Garcia-Cabrero AM, Ballester MI, Heredia M, Serratosa JM, Sanchez MP, Sanz P. Pharmacological Interventions to Ameliorate Neuropathological Symptoms in a Mouse Model of Lafora Disease. Mol Neurobiol. 2015 doi: 10.1007/s12035-015-9091-8. [DOI] [PMC free article] [PubMed] [Google Scholar]
- 29.Duran J, Gruart A, Garcia-Rocha M, Delgado-Garcia JM, Guinovart JJ. Glycogen accumulation underlies neurodegeneration and autophagy impairment in Lafora disease. Hum Mol Genet. 2014;23:3147–3156. doi: 10.1093/hmg/ddu024. [DOI] [PubMed] [Google Scholar]
- 30.Sheldon AL, Gonzalez MI, Krizman-Genda EN, Susarla BT, Robinson MB. Ubiquitination-mediated internalization and degradation of the astroglial glutamate transporter, GLT-1. Neurochem Int. 2008;53:296–308. doi: 10.1016/j.neuint.2008.07.010. [DOI] [PMC free article] [PubMed] [Google Scholar]
- 31.Roma-Mateo C, Sanz P, Gentry MS. Deciphering the role of malin in the lafora progressive myoclonus epilepsy. IUBMB Life. 2012;64:801–808. doi: 10.1002/iub.1072. [DOI] [PMC free article] [PubMed] [Google Scholar]
- 32.Gentry MS, Roma-Mateo C, Sanz P. Laforin, a protein with many faces: glucan phosphatase, adapter protein, et alii. The FEBS journal. 2013;280:525–537. doi: 10.1111/j.1742-4658.2012.08549.x. [DOI] [PMC free article] [PubMed] [Google Scholar]
- 33.Donovan P, Poronnik P. Nedd4 and Nedd4-2: ubiquitin ligases at work in the neuron. Int J Biochem Cell Biol. 2013;45:706–710. doi: 10.1016/j.biocel.2012.12.006. [DOI] [PubMed] [Google Scholar]
- 34.Scheffner M, Kumar S. Mammalian HECT ubiquitin-protein ligases: biological and pathophysiological aspects. Biochim Biophys Acta. 2014;1843:61–74. doi: 10.1016/j.bbamcr.2013.03.024. [DOI] [PubMed] [Google Scholar]
- 35.Leon S, Haguenauer-Tsapis R. Ubiquitin ligase adaptors: regulators of ubiquitylation and endocytosis of plasma membrane proteins. Experimental cell research. 2009;315:1574–1583. doi: 10.1016/j.yexcr.2008.11.014. [DOI] [PubMed] [Google Scholar]
- 36.Shenoy SK, Lefkowitz RJ. beta-Arrestin-mediated receptor trafficking and signal transduction. Trends Pharmacol Sci. 2011;32:521–533. doi: 10.1016/j.tips.2011.05.002. [DOI] [PMC free article] [PubMed] [Google Scholar]
- 37.Kommaddi RP, Shenoy SK. Arrestins and protein ubiquitination. Prog Mol Biol Transl Sci. 2013;118:175–204. doi: 10.1016/B978-0-12-394440-5.00007-3. [DOI] [PubMed] [Google Scholar]
- 38.Boehmer C, Palmada M, Rajamanickam J, Schniepp R, Amara S, Lang F. Post-translational regulation of EAAT2 function by co-expressed ubiquitin ligase Nedd4-2 is impacted by SGK kinases. J Neurochem. 2006;97:911–921. doi: 10.1111/j.1471-4159.2006.03629.x. [DOI] [PubMed] [Google Scholar]
- 39.Had-Aissouni L. Toward a new role for plasma membrane sodium-dependent glutamate transporters of astrocytes: maintenance of antioxidant defenses beyond extracellular glutamate clearance. Amino Acids. 2012;42:181–197. doi: 10.1007/s00726-011-0863-9. [DOI] [PubMed] [Google Scholar]
- 40.Roma-Mateo C, Aguado C, Garcia-Gimenez JL, Ibanez-Cabellos JS, Seco-Cervera M, Pallardo FV, Knecht E, Sanz P. Increased oxidative stress and impaired antioxidant response in lafora disease. Mol Neurobiol. 2015;51:932–946. doi: 10.1007/s12035-014-8747-0. [DOI] [PubMed] [Google Scholar]