

ABSTRACT
Bacteria have evolved multiple strategies to sense and rapidly adapt to challenging and ever-changing environmental conditions. The ability to alter membrane lipid composition, a key component of the cellular envelope, is crucial for bacterial survival and adaptation in response to environmental stress. However, the precise roles played by membrane phospholipids in bacterial physiology and stress adaptation are not fully elucidated. The goal of this study was to define the role of membrane phospholipids in adaptation to stress and maintenance of bacterial cell fitness. By using genetically modified strains in which the membrane phospholipid composition can be systematically manipulated, we show that alterations in major Escherichia coli phospholipids transform these cells globally. We found that alterations in phospholipids impair the cellular envelope structure and function, the ability to form biofilms, and bacterial fitness and cause phospholipid-dependent susceptibility to environmental stresses. This study provides an unprecedented view of the structural, signaling, and metabolic pathways in which bacterial phospholipids participate, allowing the design of new approaches in the investigation of lipid-dependent processes involved in bacterial physiology and adaptation.
IMPORTANCE In order to cope with and adapt to a wide range of environmental conditions, bacteria have to sense and quickly respond to fluctuating conditions. In this study, we investigated the effects of systematic and controlled alterations in bacterial phospholipids on cell shape, physiology, and stress adaptation. We provide new evidence that alterations of specific phospholipids in Escherichia coli have detrimental effects on cellular shape, envelope integrity, and cell physiology that impair biofilm formation, cellular envelope remodeling, and adaptability to environmental stresses. These findings hold promise for future antibacterial therapies that target bacterial lipid biosynthesis.
KEYWORDS: membranes, metabolism, phospholipids, physiology, stress adaptation, stress response
INTRODUCTION
Bacteria have to cope with and adapt to a wide range of environmental conditions, such as nutrient limitation or exposure to antibiotics. Therefore, the ability to sense and quickly respond to fluctuating conditions is key for bacterial survival (1–3). Bacterial stress adaptation often requires major metabolic reprogramming that involves coordinated changes in the cell transcriptome, proteome, and metabolome, along with cellular envelope remodeling (4, 5). Escherichia coli cells consist of four compartments: the cytoplasm, the inner membrane, the periplasm, and the outer membrane. The inner and outer membranes exhibit different makeups. The inner membrane is a bilayer containing α-helical proteins, and more than 95% of the total lipids are phospholipids; the outer membrane is an asymmetric bilayer made of both phospholipids and glycolipids containing β-barrel proteins (4). Lipoproteins are present in both membranes and are anchored to the membrane via N-terminal acyl modification.
In addition to lipopolysaccharide (LPS), many enteric bacteria also have capsular polysaccharide (glycolipids with lipid membrane anchors) located at the outer surface of the outer membrane. Phospholipids are present in both the inner and the outer membranes, while the large majority of the LPS is embedded in the outer leaflet of the outer membrane (6). The envelope of Gram-negative bacteria is a complex macromolecular structure that serves as a permeability barrier, protecting cells from threatening conditions (4) by sensing and initiating signaling cascades to maintain bacterial fitness. In E. coli, several well-known stress response pathways regulate complementary physiological functions that are necessary for mounting a complete adaptive response (1–5). These pathways are also important for other functions, such as bacterial adhesion, biofilm formation, motility, and virulence (4, 5). However, the precise role played by membrane lipids in stress adaptation remains elusive.
In all organisms, phospholipid biosynthesis is initiated with two acylation steps of glycerol-3-P to form phosphatidic acid (PA). In bacteria, PA is then converted to the intermediate CDP-diacylglycerol (CDP-DAG), which is the precursor to the major zwitterionic phospholipid phosphatidylethanolamine (PE) and the major anionic phospholipids phosphatidylglycerol (PG) and cardiolipin (CL) (Fig. 1A). E. coli membranes are composed of ∼75% PE, ∼20% PG, and ∼5% CL. This composition is relatively constant under a broad spectrum of growth conditions, with exceptions where, for example, CL amounts rise as cells enter the stationary phase (7). The physiological role of bacterial phospholipids is pleiotropic and determines both cell integrity and cell function (8–13). The elimination or a significant alteration in the level of a particular phospholipid causes marked changes in the physiology of the cell or critically compromised cell integrity. The elimination of major E. coli phospholipids (PE, PG, and CL) is achieved in viable cells by mutating every gene of the phospholipid biosynthesis pathway after the first step, catalyzed by CdsA (Fig. 1A, step 1) (11).
FIG 1.

Membrane phospholipids of Escherichia coli. (A) Native lipid biosynthesis in E. coli. Genes encoding the following enzymes and associated with each biosynthetic step are listed next to the arrows. Lipid abbreviations are as follows: DAG, diacylglycerol; PS, phosphatidylserine; PA, phosphatidic acid; PE, phosphatidylethanolamine; PG, phosphatidylglycerol; CL, cardiolipin. Enzymes are indicated as follows: 1, CDP-DAG synthetase; 2, PS synthase; 3, PS decarboxylase; 4, PGP synthase; 5, PGP phosphatases; 6, CL synthases; 7, PG:membrane-derived oligosaccharide sn-glycerol-1-P transferase; 8, DAG kinase. Boxed phospholipids are the major phospholipids of E. coli; phospholipids in red are anionic lipids. (B) TLC analysis of total lipid extracts from WT and phospholipid-altered strains grown to mid-exponential phase in M9 minimal medium supplemented with 2% glucose and SC amino acids. (C) Histograms depict the lipid compositions determined by total phosphate assay after scraping off each lipid spot for the various strains. Error bars show the standard deviations (SD); n = 3.
The ability to systematically manipulate the phospholipid composition (Table 1) has led to the determination of specific roles for phospholipids at the molecular level (13). Alterations of either PE (pssA and psd mutants) or PG/CL (pgsA mutants) lead to temperature sensitivity, cellular envelope disorders, and defective chemotaxis. Changes in outer membrane protein synthesis, cell division, energy metabolism, and osmoregulation occur. Interestingly, activation of stress response pathways, such as the CpxAR system, is also observed in cells lacking PE, indicating that envelope stress response pathways can detect imbalances in membrane phospholipid composition. An E. coli pgsA null mutant (strain UE54), completely lacking PG and CL (PG/CL-lacking strain) (Table 1), is viable only with codeletion of the major outer membrane lipoprotein Lpp (pgsA lpp mutant). UE54 shows a thermosensitive growth defect at 42°C, which can be suppressed by disrupting any of the genes rcsF, rcsC, and rcsB but not rscA. In fact, the Rcs system is constitutively activated in pgsA lpp mutants and causes defective maturation of lipoproteins, and RcsF in particular. The RcsF protein is an outer membrane lipoprotein (14) that can activate RcsC upon a variety of environmental and mutational stresses. Previous studies on UE54 used the parental strain lacking both lpp and rcsF (MG1655 lpp-2 Δara714 rcsF::mini-Tn10 cam) as a control. The recent discovery of a third cardiolipin synthase gene facilitated the development of an E. coli strain that completely lacks CL (15) while exhibiting a genetic background closer to those of cells with wild-type (WT) phospholipid composition and PE-deficient cells, thus allowing a better dissection of lipid-dependent cellular envelope phenotypes. Interestingly, the phospholipid compositions of the pgsA, pssA, and psd mutants differ from that of WT cells in their ratios of zwitterionic to acidic phospholipids (Table 1). Although no major phenotype was described except impaired stationary-phase stability, a more exhaustive characterization of this strain is still lacking.
TABLE 1.
Phospholipid composition of the strains used in this study
| Lipid phenotype | Strain (amt of aTc used [ng/ml])a | Amt (mol%) of indicated phospholipidb |
Other phospholipid(s) (amt [mol%]) | Reference(s) | |||
|---|---|---|---|---|---|---|---|
| PE | PG | CL | PA | ||||
| WT | AL95/pDD72GM | 78 | 12 | 6 | <3 | 12 | |
| Modulated PE | AT2033 (500) | 75 | 14 | 8 | <3 | 31 | |
| AT2033 (100) | 30 | 25 | 35 | <2 | 31 | ||
| AT2033 (20) | 17 | 40 | 40 | <2 | 31 | ||
| AT2033 (0) | 2 | 45 | 50 | <2 | 31 | ||
| Minus PE | AL95 | 0 | 45 | 50 | 3 | CDP-DAG | 22 |
| Minus CL | BKT12 | 79 | 18 | 0 | <2 | 15 | |
| Minus PG/CL | UE54 | 92 | 0 | 0 | 4 | CDP-DAG (3), N-acyl PE (0.4) | 23, 44 |
PE levels in strain AT2033 were modulated by using anhydrotetracycline (aTc) in the indicated concentrations.
Composition data for strains grown to mid-exponential phase in LB medium are shown. PE, phosphatidylethanolamine; PG, phosphatidylglycerol; CL, cardiolipin; PA, phosphatidic acid; CDP-DAG, cytidine diphosphate diacylglycerol.
Phospholipid metabolism has not been explored using pharmacological modulation, possibly due to the lack of comprehensive structure-function studies on phospholipid biosynthetic enzymes and the availability of only a few high-resolution structures (16–19). Additionally, current screens performed on single-knockout strain libraries (20, 21) often do not include genes involved in phospholipid biosynthesis pathways (such as cds, pss, psd, or pgs) (Fig. 1A), which limits the physiological range of these studies.
Despite our increasing knowledge of specific membrane functions of lipids, an integrated view of their functional roles in bacterial physiology is still lacking. We now propose that specific membrane phospholipid alterations result in deleterious perturbations of cellular macromolecules, which in turn generate an endogenous stress and lead to impaired cellular adaptability upon additional exposure to environmental stress. By examining E. coli cells in which membrane phospholipid composition can be systematically manipulated (22), we found that alterations in the content of PE or CL lead to pleiotropic cellular effects. These effects include modifications of the cellular envelope structure and content, alterations of membrane biogenesis and homeostasis pathways, and impairment of metabolic pathways involved in energy provision and macromolecule synthesis. Additionally, phospholipid-altered strains exhibit perturbations in surface adhesion, changed susceptibility to environmental stresses, and activation of multiple stress response pathways, even in the absence of any external stressors. Together, our findings indicate that the maintenance of proper membrane phospholipid composition is critical for sufficient bacterial adaptation. Our study provides new insight into how membrane phospholipids drive bacterial physiology and stress adaptation, with particular relevance to the mechanisms involved in cellular envelope homeostasis and remodeling.
RESULTS
Alterations in E. coli membrane phospholipid composition lead to lipid-dependent changes in cell morphology.
The phospholipid composition of the strains used in our study has been described previously for cells grown in LB medium (rich chemically undefined medium) (see Table 1 for details). We have extended this analysis to cells grown in less-rich but chemically defined M9 minimal medium supplemented with 2% glucose and all amino acids (synthetic complete [SC] mixture) (Fig. 1B and C), validating that the membrane phospholipid composition in these strains is relatively stable under various growth conditions (Fig. 1C and Table 1). The main phospholipids in WT E. coli are PE, PG, and CL, and elimination of either PE (strain AL95) or CL (strain BKT12) does not result in the appearance of new phospholipid species. Increases in PA and CDP-DAG are observed, although their amounts remain less than 5% of the total phospholipids. Analysis of the lipids that localized to the poles in cells lacking both PG and CL (minus PG/CL; strain UE54) showed a high enrichment in PA, as well as a newly discovered phospholipid in E. coli, N-acyl PE (23). Additionally, only minor differences exist between the WT and phospholipid-altered mutants regarding their fatty acid composition (24).
Using live-cell fluorescence microscopy, we investigated the morphological dynamics of phospholipid-altered E. coli cells under different growth conditions. We used a combination of phase-contrast and fluorescence imaging to determine the cell length distribution. The data obtained for WT, PE-lacking (minus-PE), and CL-lacking (minus-CL) cells grown in LB medium to mid-exponential phase are presented in Fig. 2. Although intact cellular membrane structures were visible by FM 4-64 staining in all strains (Fig. 2A, red outlines), phospholipid-altered strains displayed changes in cell length distribution compared to that in the WT. The lengths of WT cells follow an asymmetrical Gaussian distribution with a single maximum at 3.2 μm in rich medium (LB). In contrast, both minus-PE and minus-CL cells displayed multimodal cell length distributions (Fig. 2C), with high proportions of elongated cells (>5 μm) and shorter cells (<2 μm). Our findings are consistent with previous reports describing a filamentous phenotype in minus-PE cells grown in rich LB medium (13). Minus-CL cells exhibit the same growth rate as WT cells when grown in LB (Fig. 2E), but the absence of CL leads to alterations in cell size, demonstrating the importance of CL in cell size homeostasis.
FIG 2.

Effects of phospholipid composition on cell morphology and growth. (A, B) DIC and fluorescence images of WT and phospholipid-altered cells grown to exponential phase in LB medium (A) or M9 minimal medium (B) and stained with FM 4-64. The zoom panels show a higher magnification of the boxed fields from the FM 4-64 panels. Bars, 5 μm. (C, D) Determination of cell lengths for cells grown to mid-exponential phase in LB (C) and M9 (D) media. Each datum point was determined by imaging 1,400 WT, 1,000 CL-lacking, and 800 PE-lacking cells by phase-contrast microscopy and using Oufti software (59) to determine cell length. (E, F) Representative growth curves of the WT and phospholipid-altered strains grown in LB (E) and M9 (F) media. Arrows indicate the time points/OD600 values used to perform the various assays and analyses. (C to F) Mean values ± standard errors of the means (SEM) are shown; n = 5 per group.
To compare the effects of phospholipid composition and growth medium composition on cell length, we also analyzed the cell lengths of phospholipid-altered and WT E. coli strains grown in M9 medium supplemented with all amino acids and 2% glucose. In WT cells, the numbers of shorter cells (<2 μm) increased at the expense of elongated cells (>5 μm), as expected. These findings are consistent with a longer generation time and lower growth rate (Fig. 2E and F) to allow optimal cell division. In contrast, minus-PE and minus-CL strains shift toward longer cells (Fig. 2D) and, strikingly, cells smaller than 2 μm completely disappear in minus-CL cells. Similar to previous studies in E. coli cells with WT lipid composition (25–27), we observe a shift in cell length distribution in response to changes in the availability of nutrients. We now present in greater detail the heterogeneity observed in minus-PE cells, and we provide evidence that minus-CL cells exhibit an altered and more heterogeneous cell length distribution that is independent of growth rate variations. Furthermore, we show that these changes in cell length and growth rates are dependent on both the membrane phospholipid composition and the nutrient composition of the growth medium. Specifically, alterations in PE and CL in E. coli membranes lead to lower growth rates in chemically defined M9 medium. This decrease is particularly drastic in minus-CL cells, suggesting that CL plays an important role in the maintenance of cell size and homeostasis and in proper cell division.
Deficiencies in PE or CL result in drastic and pleiotropic effects on E. coli's cell envelope ultrastructure.
To further investigate the effects of phospholipid alterations on the intracellular structures of phospholipid-altered cells, we visualized the E. coli ultrastructure using transmission electron microscopy (TEM). Experiments were performed on thin sections of WT and phospholipid-altered cells grown to mid-exponential and stationary phase. WT cells, grown to mid-exponential phase in LB medium, showed a normal cell shape with an undamaged inner membrane structure and an intact, slightly wavy outer membrane (Fig. 3, top). At stationary phase, only minimal detachment of the inner membrane from the outer membrane, particularly at the pole, was observed. Phospholipid-altered strains, however, displayed significant ultrastructural differences. Minus-PE cells (Fig. 3, middle) show clear perturbations of the envelope, including increased formation of outer membrane vesicles, along with detachment of the outer membrane from the inner membrane and accumulation of electron-dense material in the periplasmic space. These morphological changes are consistent with perturbations in the cellular envelope. Strikingly, we observed inner membranes with winding and bulging shapes in CL-lacking cells (Fig. 3, bottom), along with enlarged periplasmic spaces, although they did not show accumulation of electron-dense amorphous material. Minus-CL cells, grown to stationary phase, also displayed clear disorganization of the nucleoid area and increased cytoplasmic stain density, suggesting increased protein content. Additionally, substantial extracellular electron-dense material was observed in both minus-PE and minus-CL cells, indicating increased cell lysis and/or outer membrane vesicle release.
FIG 3.
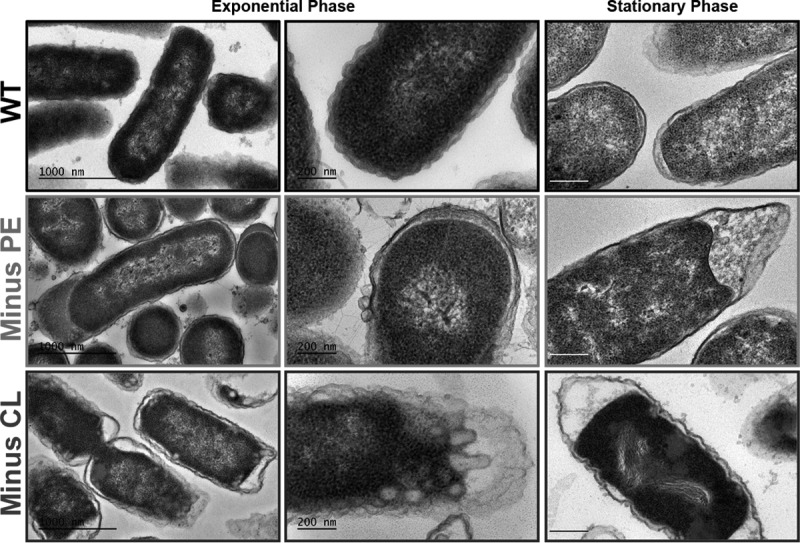
Visualization of cellular ultrastructure by electron microscopy. Transmission electron microscopy of thin sections of WT and phospholipid-altered (minus-PE and minus-CL) cells grown in LB medium to exponential phase and stationary phase. Cells were grown aerobically in LB medium until they reached mid-logarithmic phase (OD600 of ∼0.3) or stationary phase (OD600 of ∼2). All specimens were fixed, embedded, ultrathin sectioned, and poststained before imaging on a JEOL 1400 electron microscope. Bars, 1 μm (left) and 200 nm (center and right).
Alterations in major E. coli phospholipids cause changes in LPS structure, outer membrane protein assembly, and cellular envelope homeostasis.
Based on the striking cellular envelope alterations observed by TEM, we sought to investigate the consequences of phospholipid alterations on cellular envelope components. We first examined the LPS produced by phospholipid-altered cells when grown to mid-exponential phase in LB medium. Crude LPS was extracted using a commercially available LPS extraction kit, and purified LPSs were visualized by silver staining after separation by SDS-PAGE (Fig. 4A). Crude LPSs extracted from WT cells and the various phospholipid-altered cells display distinct O antigen repeat patterns, indicating the importance of proper phospholipid composition for LPS structure. Our results suggest that modifying the phospholipid composition changes the size and complexity of the long-chain oligopolysaccharides. In particular, the absence of PE dramatically reduces the number of O antigen repeats (Fig. 4A, 2nd and 3rd lanes). PE is a known component of the LPS biosynthetic pathway (28), but no investigation of the effects of variations in PE amounts has been reported. Minus-PE cells display a phenotype similar to that of the “deep rough” E. coli strains (29), indicating possible impairment in the biosynthesis and/or translocation of LPS. It was shown that PE can be replaced by PG (30). Our results, however, indicate that PG can only partially replace PE, leading to less complex LPS. We next investigated whether incremental increases in PE would alter the LPS structure. By using anhydrotetracycline (aTc) in AT2033 strains (31), we were able to simulate PE levels (Table 1) ranging from none to ∼30% of WT levels (Fig. 4A, AT2033 strains, 3rd to 5th lanes). LPS analysis shows that with larger amounts of PE, the number of O antigen repeats increases (Fig. 4A). In contrast, lack of CL (6th lane, minus CL) caused a different O antigen repeat pattern, with longer LPS chains than in the WT (Fig. 4A, 6th lane).
FIG 4.

Alterations in E. coli major phospholipids cause defects in LPS structure, outer membrane protein assembly, and cellular envelope homeostasis. (A) Lipopolysaccharides from E. coli WT and phospholipid-altered cells separated by SDS-PAGE and visualized by silver staining. (B) OmpF folding assessment by differential electrophoretic mobility after heat denaturation in WT and phospholipid-altered cells. F, folded; U, unfolded. (C) Schematic representation of the metabolic pathways leading to incorporation of glucose- and acetate-derived carbon into phospholipids and outer membrane glycolipids, such as LPS. 1, glycolytic pathway; 2, acetyl-CoA carboxylase; 3, malonyl-CoA:ACP transacylase; 4, glycerol-3-P dehydrogenase; 5, glycerol-3-P and lysophosphatidic acid acyltransferases; 6, LPS biosynthetic pathway; 7, cell surface and wall polysaccharide biosynthetic pathway. DHAP, dihydroxyacetone phosphate; FAS, fatty acid synthesis. (D) Bacterial remodeling assessment using radioactive nutrient labeling. Incorporation of 14C-labeled glucose (left) and 14C-labeled acetate (right) into cellular envelope components is measured after extraction of total lipids (TL) or isolation of outer membrane glycolipids (OMGL) from cells cultured in the presence of radiolabeled nutrient. Incorporation of radioactivity into the fatty acyl (FA) moieties is evaluated after saponification. DPM, disintegrations per minute. Mean values ± SEM are shown; n = 3 per group.
Next, we investigated whether phospholipid alterations affect the assembly and folding of the outer membrane protein OmpF, as a proxy for outer membrane biogenesis. Several simple biochemical assays can be used to measure the assembly and targeting of outer membrane proteins (OMPs). We took advantage of the differential electrophoretic mobilities of folded and nonnative (unfolded) OMPs (32), with folded monomers generally migrating faster than the heat-denatured proteins in SDS-PAGE gels. Cellular envelopes were isolated from WT and phospholipid-altered strains and analyzed by immunoblotting with anti-OmpF antibody (Fig. 4B). Our results indicate that the absence of PE and CL leads to impairment in OmpF folding, as exhibited by the shift from folded OmpF (Fig. 4B, F) to unfolded OmpF, causing an accumulation of the more slowly migrating unfolded form of OmpF (Fig. 4B, U). The folding of OmpF depends on PE in a dose-dependent manner, with strains containing increasing amounts of PE (strain AT2033 in the presence of 0 to 500 ng/ml anhydrotetracycline) exhibiting increasing amounts of properly folded OmpF (Fig. 4B, 2nd to 5th lanes). While the absence of PE leads to a maximal defect in OmpF assembly, the absence of CL leads to less severe defects, with about 25% of OmpF folded correctly. Additionally, the overall OmpF protein levels in membranes are affected by the phospholipid composition, as indicated by our observations. Decreased OmpF levels are associated with low PE levels, possibly due to increased production of periplasmic proteases.
We next investigated the effects of phospholipid alterations on cellular envelope homeostasis. To address this, we performed metabolic labeling using uniformly radiolabeled nutrients that can be incorporated into envelope macromolecules. To measure the flux of glucose and acetate into cellular envelope components (phospholipids and glycolipids), cells were grown in the presence of [14C]acetate or [14C]glucose. This approach allows different metabolic pathways involved in the synthesis and remodeling of the cellular envelope to be monitored (Fig. 4C).
The metabolic pathways involved in the incorporation of glucose-derived carbon into phospholipids include the upper glycolytic pathway (down to the formation of dihydroxyacetone-phosphate [DHAP]), the generation of glycerol-3-phosphate (G3P) by the glycerol-3-phosphate dehydrogenase, and the formation of PA acid from G3P and acyl coenzyme A (acyl-CoA) or acyl-acyl carrier protein (acyl-ACP) (Fig. 4C). In both minus-PE and minus-CL cells, we measured decreased incorporation of glucose into phospholipids, while the incorporation of glucose into outer membrane glycolipids (OMGL) increased (Fig. 4D). This effect was most striking in the absence of CL and suggests a redirection of glucose-derived carbon flux into OMGL, and LPS in particular, instead of into phospholipids. The metabolic pathways involved in the incorporation of glucose-derived carbons into OMGL mainly include the pentose phosphate pathway and the incorporation of glucose and glucose-derived sugar moieties (UDP-glucose) in the outer core of the oligosaccharide moiety of the LPS, as well as other wall polysaccharides, such as undecaprenyl-containing O polysaccharides and capsular polysaccharides (Fig. 4C). Our data suggest that in the absence of CL, glucose-derived carbon flux is redirected into LPS and other glycolipids, which offers an explanation for the above-described increase in O antigen complexity (Fig. 4A). The reduced incorporation of glucose-derived carbons into the fatty acid moieties of total lipids and OMGL in all three strains indicates that the necessary carbons for fatty acid synthesis most likely stem from amino acids.
Next, we measured the flux of acetyl-CoA into the Krebs cycle and de novo fatty acid synthesis by using labeled acetate (Fig. 4D). Acetate-derived carbon flux into OMGL is decreased in cells that lack PE (both total OMGL and FA moieties), while the flux into phospholipids is similar to that in WT cells. CL-lacking cells exhibit decreased incorporation of acetate-derived carbon into the fatty acyl part of the OMGL. At the same time, the incorporation of acetate-derived carbons into the fatty acyl part of total phospholipids is increased. These findings are consistent with the observed differences in envelope components and properties. Furthermore, the results suggest that the absence of PE and CL promotes a redirection of glucose and acetate that leads to increased incorporation of sugar moieties and acyl-ACP into the glycolipids and phospholipids, respectively. The low level of acetate incorporation into the fatty acid moieties of total lipids and OMGL is further evidence that amino acids are the main source of carbon for fatty acid biosynthesis. However, the differences observed between WT and phospholipid-altered strains in levels of acetate incorporation indicate possible differences in acetate and/or amino acid utilization in these strains.
Lipid-dependent alterations in energy metabolism.
Bacterial stress adaptation depends on the successful mounting of the appropriate cellular response (1–3), which includes cellular envelope remodeling, changes in gene expression, and/or metabolic adjustments (5, 33). These various processes all depend on the ability of the cell to provide energy. We therefore decided to assess cellular physiology by assessing five parameters determining energy homeostasis. We measured the oxidation rate of glucose by using 14C-labeled CO2 release in the culture medium and membrane potential (ΔΨ) by using the DiSC35 (3,3′-dipropylthiadicarbocyanine iodide) fluorescent probe. We further used the MTT [3-(4,5-dimethyl-2-thiazolyl)-2,5-diphenyl-2H-tetrazolium bromide] assay to measure cellular dehydrogenase activity, a luciferase-based assay to measure cellular ATP levels, and a fluorescent probe (chloromethyl derivative of 2′,7′-dichlorodihydrofluorescein diacetate [CM-H2DCFDA]) to measure reactive oxygen species (ROS). All assays were performed on cells grown to mid-exponential phase in M9 medium. Together, these assays (Fig. 5) provide insight into the effects of alterations in major E. coli phospholipids on global cellular physiology.
FIG 5.

Bacterial physiology profiling of phospholipid-altered E. coli strains. WT and phospholipid-altered strains were grown to mid-exponential phase in M9 minimal medium containing 2% glucose, SC amino acids, and all the necessary supplements. (A) Glucose oxidation rate (14CO2 release). (B) Cellular dehydrogenase activity (MTT assay). (C) Membrane potential (DiSC35 probe). (D) ATP levels (luciferase-based assay). (E) Cellular reactive oxygen species (ROS) measurements (CM-H2DCFDA probe). Mean values ± SEM are shown; n = 3 to 4 per group. **, P < 0.05; ***, P < 0.01; NS, not significant. ANOVA and Student's t test were used. (B, C, E) Gray bars indicate baseline readings obtained by measurements done in the presence of an inhibitor of NADH:ubiquinone oxidoreductase (piericidin A, 10 μM) or the protonophore carbonyl cyanide m-chlorophenylhydrazone (CCCP, 20 μM) or in the absence of dye, respectively.
In E. coli, glucose is metabolized through the Embden-Meyerhof-Parnas (EMP) pathway and the hexose monophosphate (HMP) pathway, and the metabolic product, pyruvate, is decarboxylated to acetyl-CoA, which in turn is further decarboxylated in the Krebs cycle. Glucose metabolized through the EMP and HMP pathways is used to generate key metabolite intermediates, such as ATP, pyruvate, pentose-5-phosphate, NADH, and NADPH. We employed a radiorespirometric approach (34) to determine the glycolytic pathway, monitoring CO2 release following the oxidation of pyruvate by the pyruvate dehydrogenase. The results show that the absence of PE or CL does not lead to significant changes in glucose oxidation rates (Fig. 5A) over the course of 2 h of exponential growth, indicating that glucose utilization is not globally affected by alterations in phospholipid composition.
In order to assess the functionality of oxidative phosphorylation, we measured the membrane potential (generated through the active expulsion of protons from the cytoplasm to the periplasm), cellular dehydrogenase activity [to assess the activities of NAD(P)H-dependent cellular oxidoreductase enzymes], ATP levels (reflecting the energy levels of the cells), and ROS levels (used as a proxy to determine the levels of oxidative stress in the cell). We found no significant difference in the membrane potential in either minus-PE or minus-CL cells (minus PE, 0.94-fold [P = 0.002], and minus CL, 0.96-fold [P = 0.004]) (Fig. 5B). Minus-PE and minus-CL cells showed significant decreases in cellular dehydrogenase activity (minus PE, 0.5-fold [P < 2.2E−16], and minus CL, 0.89-fold [P = 0.003]) (Fig. 5C) and in ATP content (minus PE, 0.49-fold [P = 1.5E−13], and minus CL, 0.78-fold [P = 4.3E−9]) (Fig. 5D). In contrast, the cellular ROS levels increased in both minus-PE and minus-CL cells (minus PE, 10.4-fold [P = 1.5E−15], and minus CL, 5.4-fold [P < 2.0E−16]) (Fig. 5E). Our findings indicate that the alteration of major phospholipids increases oxidative stress, which is consistent with previously observed activation of stress response pathways. However, our results also show that lack of PE has a more striking effect on energy metabolism through perturbations of cellular oxidative phosphorylation.
Phospholipid-dependent surface adhesion and biofilm formation.
In addition to assessing the physiological consequences of phospholipid alterations for E. coli cells in the planktonic mode of growth, we also investigated the effects of cellular envelope impairment on surface adhesion and the ability to form biofilms. We first measured the ability of strains with altered phospholipids to adhere to an untreated glass surface (Fig. 6A). The ratio of live to dead cells was determined on intact cells (bacterial shape still visible by differential interference contrast [DIC] microscopy). In minus-PE and minus-CL cells, bacterial adhesion decreased by 95% (minus PE, P < 2E−16) and 75% (minus CL, P = 1.06E−10) (Fig. 6B). At the same time, we observed a significant decrease in the cell viability of adherent phospholipid-altered cells (Fig. 6B). Cell death increased most notably in minus-CL cells. Our results indicate that membrane permeability upon surface adhesion depends on the phospholipid composition. Furthermore, our results suggest that cell size and cell shape are crucial morphological parameters to ensure bacterial surface adhesion and biofilm formation.
FIG 6.
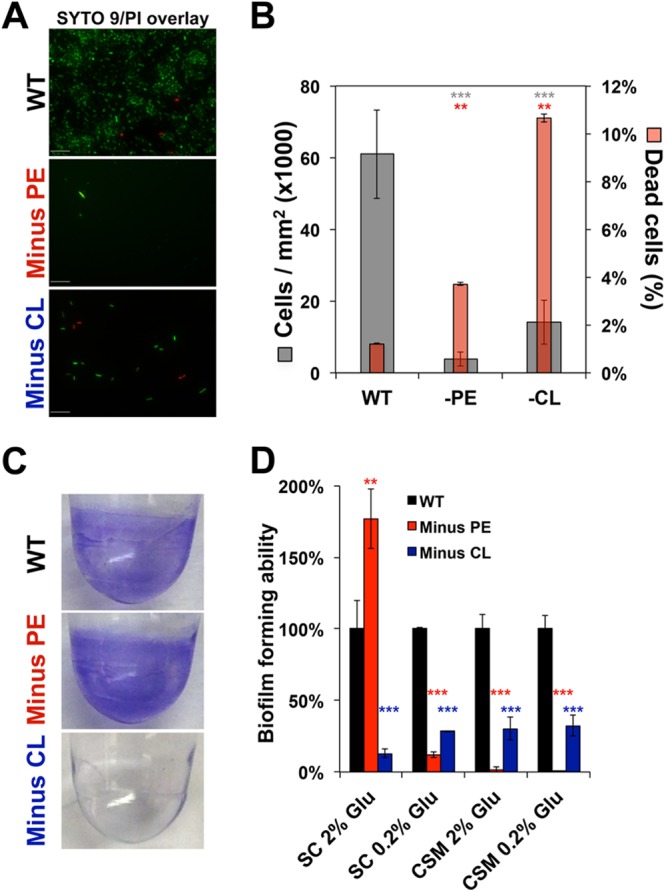
Surface adhesion and biofilm-forming abilities of phospholipid-altered E. coli strains. (A, B) Phospholipid-dependent surface adhesion. Fluorescence microscopy examination of surface adhesion (A) of WT and phospholipid-altered E. coli cells with the Filmtracer Live/Dead biofilm viability stain (Thermo Fisher), which reveals viable (green) and nonviable (red) cells. E. coli cells were grown in 24-well plates with flat glass bottoms in M9 minimal medium supplemented with 2% glucose and all the amino acids (SC-based medium) for 24 h without shaking at 30°C. Representative fields for each strain condition are presented (n = 3). Scale bar, 10 μm. (B) Surface-attached cells (gray bars) and dead cells (red bars) were counted. Mean values ± SD obtained from three independent experiments are shown. (C, D) Phospholipid-dependent biofilm formation. (C) E. coli forms biofilms on polystyrene plates as evaluated by the crystal violet assay. (D) Quantification of biofilm formation of WT and phospholipid-altered strains in M9 minimal medium supplemented with glucose at the indicated concentrations and either all amino acids (SC) or only essential amino acids (CSM). Values are presented as percentages of biofilm formation normalized to the biofilm formation of the WT. (B, D) Mean values ± SD are shown; n = 3 to 4 per group. **, P < 0.05; ***, P < 0.01; NS, not significant; ANOVA and Student's t test.
To further evaluate the effects of membrane phospholipid alterations on biofilm formation, we quantified the biofilm formation (Fig. 6C) of phospholipid-altered (minus-PE and minus-CL) and WT strains using the crystal violet method (35). The data are presented after growth correction and are normalized to the data from the WT cells (Fig. 6D). Our results demonstrate the effects of membrane phospholipid composition and nutrient availability on biofilm formation. The lack of CL clearly perturbs surface adhesion, regardless of the growth conditions (high or low glucose and all or only essential amino acids). This impairment of biofilm formation in minus-CL cells does not depend on the surface type. In contrast, the absence of PE leads to nutrient-dependent biofilm formation. A high glucose supply combined with the presence of all the amino acids leads to ∼50% more biofilm formation in minus-PE cells than in WT cells. Interestingly, biofilm formation in minus-PE cells depends on the type of surface. Our results highlight the importance of proper membrane phospholipid composition in the maintenance of bacterial morphology, homeostasis, and adaptation to environmental factors.
Specific membrane phospholipid alterations lead to variations in the sensitivity to environmental stresses.
The striking consequences of E. coli membrane phospholipid alterations for the cellular envelope led us to also investigate the response of phospholipid-altered strains to environmental stress. To assess the stress response in E. coli strains, we measured the effects of different types of stress (e.g., NaCl, sorbitol, tert-butyl-hydroperoxide [t-BHP], and hydrogen peroxide [H2O2]) on the growth rate. First, we established a baseline growth rate for each E. coli strain tested, because, as shown above, phospholipid alterations affect cellular morphology and integrity. Next, we compared the logarithmic fold changes of the growth rates to the growth rate of the isogenic parental strain (W3110) to account for internal variability of the assay (Fig. 7). We also investigated whether an incremental increase of PE affects the stress response by using anhydrotetracycline in AT2033 strains (Table 1). PE affects cell growth in a dose-dependent manner, with even small modulations of PE (strain AT2033-100, containing ∼30% PE) impairing the stress response irrespective of the stress applied (Fig. 7). The absence of CL also affects the adaptation to stress. We found reduced growth rates in response to exposure to salt and osmotic stress. Oxidative stress induced by t-BHP and H2O2 did not lead to impairment and rather improved bacterial growth, respectively. However, the absence of both PG and CL did not result in an increase or decrease in stress susceptibility as large as that observed for the CL-lacking strain. The elimination of PG/CL actually resulted in increased tolerance of both oxidative and alkaline stresses, while only modest susceptibility to salt and osmotic stresses was observed. It must be noted that the PG/CL-lacking parental strain (UE53) itself has different profiles for susceptibility to stress than the WT strain (AL95/pDD72GM), even though both of them exhibit WT phospholipid compositions. The deletion of a major component of the Rcs phosphorelay might account for these differences. Altogether, these results demonstrate the lipid dependency of bacterial stress sensing and adaptation mechanisms.
FIG 7.
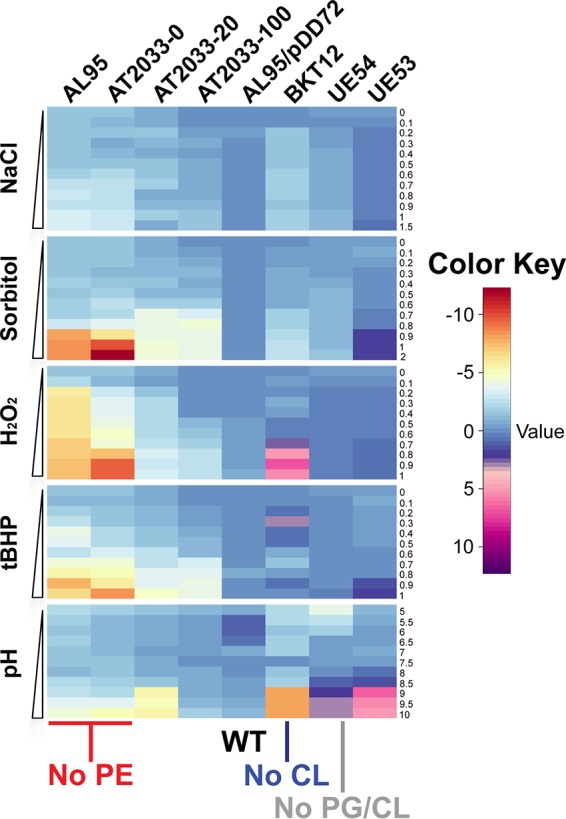
Phospholipid-dependent bacterial stress screening. Heatmaps depicting logarithmic fold changes in growth rates of WT and phospholipid-altered E. coli strains grown in LB medium containing 50 mM MgCl2 and in the presence of incremental concentrations of stressors resulting in salt stress (NaCl), osmotic stress (sorbitol), oxidative stresses (hydrogen peroxide [H2O2] and tert-butyl hydroperoxide [tBHP]), and pH stress. All data shown are mean values from four experimental replicates.
Membrane phospholipid-dependent activation of stress response pathways.
To monitor the effects of PE, CL, and PG/CL alterations in the E. coli membrane on the activation of stress response pathways, we monitored the expression of several transcriptional reporters. E. coli responds to extracytoplasmic stress by activating one or more of several well-known stress response pathways, such as the σE, Cpx, Bae, and Rcs stress response pathways. We chose to monitor several genes whose expression is triggered upon the activation of known stress regulators involved in cellular envelope homeostasis. We assessed degP (regulated by both σE and CpxR), cpxP (regulated by CpxR), spy (regulated by both CpxR and BaeR), osmB and cpsB (both regulated by RcsB), and phoP and crcA (both regulated by PhoP/PhoQ). As an indicator of the cytoplasmic stress response, we chose to monitor htpG (regulated by σS). Our results (Fig. 8A) indicate that under normal growth conditions (no extracellular stress), minus-PE and minus-CL cells exhibit moderate to high levels of activation of degP, cpxP, spy, osmB, cpsB, and htpG compared to their activation in WT E. coli cells, indicating increases in cell envelope and cytoplasmic stress in these cells. This large degree of activation is not observed for phoP and crcA promoters, demonstrating that the PhoP/PhoQ two-component system is not strongly activated by alterations in membrane phospholipid composition. The activation of the σE and Cpx pathways (degP, cpxP, and spy promoters) appears stronger in PE-deficient cells than in CL-lacking cells, while the activation of the σS and Rcs pathways (htpG, osmB, and cpsB promoters) is stronger in CL-deficient cells than in PE-lacking cells. Phospholipid-altered strains lacking both PG and CL exhibit only moderate activation in cpxP, spy, and htpG promoters compared to that in WT cells, indicating the presence of both cell envelope and cytoplasmic stress compared to the levels in WT cells, but at lower levels than in cells completely lacking PE or CL. As expected, no significant activation of osmB and cpsB promoters was observed in PG/CL-lacking cells, which are rcsF null. These findings are in concordance with previous observations showing activation of the CpxAR pathway in cells that lack PE. We now expand this knowledge by showing that additional stress response pathways are activated in PE-lacking cells. Furthermore, we demonstrate that CL-lacking cells activate both cellular envelope and cytoplasmic stress response pathways, while PG/CL-lacking cells display lower levels of stress activation, possibly due to their altered genetic background (lpp and rcsF null). These results further illustrate the effects of membrane phospholipid alterations on the cell envelope, indicating that the elimination of major phospholipids constitutes a significant stress and that multiple stress response pathways are activated to compensate for the defects.
FIG 8.
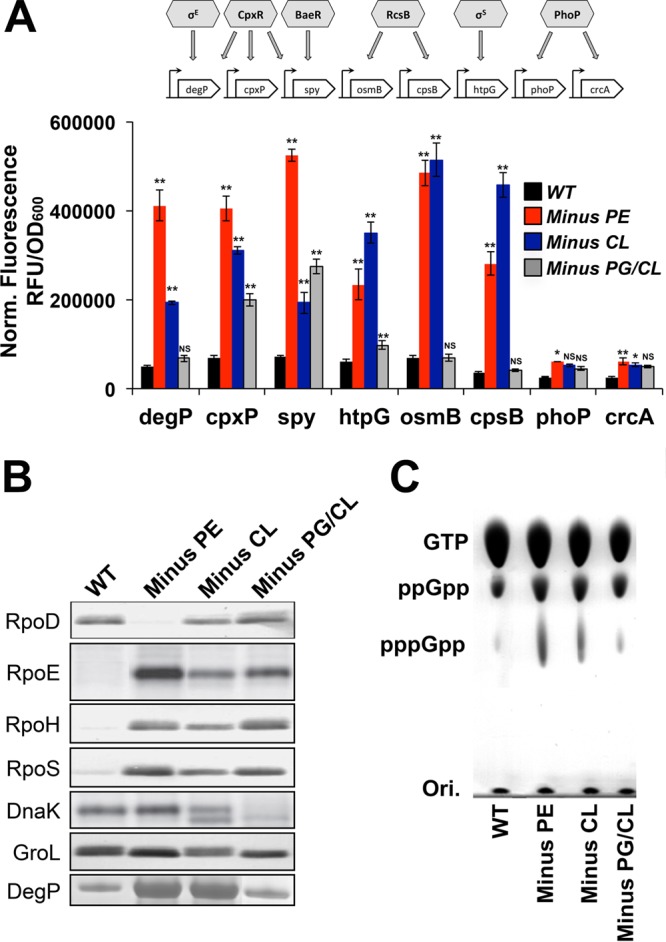
Phospholipid-dependent stress responses in E. coli. (A) Expression levels of selected bacterial stress response reporters. Histograms represent the normalized fluorescence of GFP expressed from PdegP, PcpxP, Pspy, PhtpG, PosmB, PcpsB, PphoP, and PcrcA promoters during mid-logarithmic growth. WT and phospholipid-altered strains containing each reporter were cultivated in M9 minimal medium supplemented with 2% glucose, SC amino acids, and all the necessary supplements and then assayed for OD600 and GFP fluorescence levels. Stress regulators and their target regulon members used as reporters are presented above the histograms. RFU, relative fluorescence units. Mean values ± SEM are shown; n = 3 to 4 per group. **, P < 0.05; ***, P < 0.01; NS, not significant. ANOVA and Student's t test were used. (B) Immunoblots using RpoD-, RpoE-, RpoH-, RpoS-, DnaK-, GroL-, and DegP-specific antibodies on whole-cell lysates from WT (1st lane) and phospholipid-altered E. coli strains (lacking PE, 2nd lane; lacking CL, 3rd lane; lacking PG/CL, 4th lane) grown in the absence of any stressor. (C) Representative autoradiogram of PEI thin-layer chromatography of the accumulation of (p)ppGpp in WT and phospholipid-altered cells. WT and phospholipid-altered strains were cultivated in M9 minimal medium supplemented with 2% glucose, SC amino acids, and all the necessary supplements and in the presence of 32PO4.
Next, we performed immunoblotting to assess the cellular levels of key proteins involved in stress response pathways (Fig. 8B). We focused on sigma factors, chaperones, and proteases. The experiments were performed on extracts from cells grown in the absence of added stress factors. Our results confirm the previous observations that minus-PE cells overproduce the periplasmic protease DegP and activate the envelope stress response (Cpx two-component signal transduction pathway). Furthermore, minus-PE cells show increased levels of RpoE, RpoH, and RpoS, with concomitantly decreased RpoD levels. These findings are consistent with the activation of envelope and cytoplasmic stress response pathways. In contrast, minus-CL cells exhibit a mixed profile, including an increased level of the protease DegP, along with several stress sigma factors. Interestingly, the RpoD level is close to the level in the WT, while chaperones are not overproduced. These findings suggest an activation of compensatory pathways, leading to different levels of adaptability upon exposure to an internal envelope stress (e.g., alterations of membrane phospholipid composition).
The σE envelope stress signal system detects outer membrane protein folding (36) and is activated by the well-known cytoplasmic nutritional stress signal, guanosine 3′-5′-bis-pyrophosphate (ppGpp) (37). In addition to exogenous signals, E. coli can recognize the cell's state by detecting the intracellular metabolites (key intermediates such as fructose-1,6-bis-phosphate or α-ketoglutarate) and global signaling and regulator molecules [such as cyclic AMP (cAMP), cyclic-di-GMP (c-di-GMP), or (p)ppGpp]. In cells growing under optimal conditions, the concentration of (p)ppGpp is very low. However, amino acid starvation (38), carbon source depletion (39), phosphate limitation (40), iron limitation (41), or inhibition of fatty acid biosynthesis (42, 43) can increase (p)ppGpp levels.
We assessed the levels of guanosine tetraphosphate and pentaphosphate (p)ppGpp in WT and phospholipid-altered strains growing exponentially in M9 medium supplemented with 2% glucose and all the amino acids. Under these growth conditions, cells are not exposed to carbon, nitrogen, or phosphorus limitations. Our results (Fig. 8C) indicate that minus-PE and minus-CL cells exhibit higher levels of both ppGpp and pppGpp, while PG/CL-lacking cells only exhibit mild increases in these compounds, compared to the levels in the WT. These findings are consistent with the lower growth rates observed in PE- and CL-lacking cells in M9 medium (Fig. 2F) and the activation of multiple stress responses in these cells (Fig. 7A), even in the absence of any environmental stressors. The regulatory mechanisms involving (p)ppGpp are complex and pleiotropic, with increased ppGpp levels causing an upregulation of σS expression, which we observed in all three phospholipid-altered strains (Fig. 8B). Altogether, our results indicate that the elimination of PE, CL, or PG/CL results in internal stress for the cells, triggering the activation of both cell envelope and cytoplasmic stress responses with the aim of correcting the phospholipid defects.
DISCUSSION
Although there is a wealth of information on the physical and chemical properties of lipids, little is known on how these properties translate into biological function. Genetic manipulation of membrane lipid composition by targeting genes encoding lipid biosynthetic enzymes allows the in vivo verification of lipid function and the identification of novel roles for lipids (11, 22). The role of CL in E. coli cellular processes was previously studied using strains simultaneously lacking PG and CL (strain UE54 [ΔpgsA Δlpp ΔrcsF]) (44). These strains are only viable if additional genes encoding the major lipoproteins Lpp and RcsF (a member of the rcs phosphorelay pathway) are also deleted. In cells lacking both PG and CL (PG/CL-lacking cells), PG and CL are replaceable by other anionic lipids, such as phosphatidic acid (PA), whose content is overall increased in these strains (23). The requirement of rcsF null strains for complete removal of PG and CL, along with the previous observation of Cpx two-component pathway activation in PE-lacking cells, suggested that phospholipids play key roles in the bacterial envelope stress response. To conduct a comprehensive study of the phospholipid dependency of bacterial adaptation, it is imperative to perform phospholipid alterations in cells with similar genetic backgrounds.
Our results demonstrate the importance of the phospholipid composition of bacterial membranes for the maintenance of cell shape and size. Bacterial cells regulate their size and growth rate in response to nutrient availability, in coordination with cell division. Fatty acid biosynthesis is altered in response to nutrient levels, with shorter and thinner WT cells observed in glucose minimal medium than in rich medium (45). The growth rate can be slowed by environmental factors (such as temperature) and by mutations (e.g., ΔrrmJ::Kanr) without altering the cell size (46). We now show that the elimination of PE or CL results in increased cell size heterogeneity, as well as altered cell size homeostasis, upon modification of nutrient availability. For example, although minus-PE cells do not drastically change their cell size distribution when grown in M9 minimal medium or LB medium, minus-CL cells exhibit longer cells than the WT in minimal medium, whereas shorter cells are observed in PG/CL-lacking cells grown in LB medium (23). Slowing down the cellular envelope biosynthesis might be a way to cope with envelope stresses resulting from imbalanced synthesis rates/transport of envelope components. In fact, we show that the elimination of PE or CL in the membrane affects E. coli cell size in a lipid-dependent manner that cannot be explained solely by lower growth rates. Links between metabolism and cell size through inner membrane biogenesis are becoming increasingly clear but require more investigation.
Cell morphology is linked to biofilm formation, with increases in cell surface area promoting surface adhesion. The ability of a cell to control its size can be used to evade and combat host defenses. Increasing the cell size and overall surface can help avoid phagocytosis and facilitate attachment to the host cell surfaces. In contrast, several common invasive pathogens are relatively small, including Streptococcus pneumoniae, Neisseria meningitidis, and Haemophilus influenzae (47, 48). Our results demonstrate that increases in cell length do not correlate with higher surface adhesion or biofilm formation. Additionally, phospholipid-altered cells able to adhere to abiotic surfaces all have similar cell lengths, comparable to those of WT cells. Although it is possible that surface adhesion is increased due to greater surface area in phospholipid-altered cells, we observed increased cell death, suggesting that adherent cells are not able to survive as well as WT cells and rapidly lyse upon adhesion.
Differences in surface adhesion and biofilm formation could also stem from alterations in the cell envelope, which we observed in cells lacking PE and CL. The absence of PE significantly perturbs cell division and inner membrane protein folding and assembly (11, 22), highlighting the importance of PE for the proper localization, structure, and function of several inner membrane proteins. Less is known, however, regarding outer membrane protein targeting and assembly and LPS or peptidoglycan synthesis. We found that the structure of LPS and outer membrane protein assembly are affected in PE- and CL-lacking cells, with shortening and/or modifications of the O antigen repeat portion of the LPS and increased OmpF misfolding in phospholipid-altered cells. The presence of an enlarged periplasmic space, containing increased levels of proteases like DegP, further indicates the negative impact of phospholipid alterations on the maintenance of envelope structure and integrity. Together, these various changes in cellular envelope properties have a negative impact on the ability of phospholipid-altered strains to adhere to surfaces and form biofilms.
Bacterial adaptation to environmental stress is often accompanied by cellular envelope remodeling, including changes in the LPS structure and the protein content of the outer membrane and/or the inner membrane, as well as the phospholipid composition (5, 49). Stress adaptation also requires key metabolic adjustments. Several studies have shown the importance of CL and PE for oxidative phosphorylation complexes and dehydrogenase activity. And yet, systematic analyses of the effects of membrane lipid composition alterations on cellular metabolism have been lacking. We show that alterations in PE and CL contents do not impair the oxidation of glucose or the membrane potential. However, phospholipid alteration impairs global dehydrogenase activity, leads to decreased levels of ATP, and increases intracellular oxidative stress (e.g., ROS levels). Additionally, phospholipid alterations lead to changes in glucose- and acetate-derived carbon fluxes toward outer membrane glycolipids and phospholipids, indicating potential metabolic changes in the upper glycolytic pathway, the pentose phosphate pathway, and amino acid utilization, as well as alterations in membrane phospholipid synthesis and turnover. Our results highlight that membrane phospholipids have a global impact on both membrane structure and key metabolic pathways, which can explain the observed morphological and structural differences between strains. These metabolic pathways are essential components of the cellular envelope remodeling necessary for bacterial adaptation to several environmental stresses.
The absence of PE, CL, or PG/CL in membranes does not represent a physiological situation for most Gram-negative bacteria, especially pathogens like Pseudomonas aeruginosa, Neisseria gonorrhoeae, or Vibrio cholerae. However, there is increasing evidence that the levels of these lipids can vary dramatically upon exposure to challenging host conditions (50). For example, when Vibrio cholerae cells are exposed to bile, they exhibit a concomitant decrease in PE and increase in CL, along with other lipid modifications. Pathogenic Gram-negative bacteria remodel their cell envelope during host-pathogen interactions to promote survival and/or evade the immune system (5). Remodeling of bacterial surfaces is a hallmark mechanism of resistance to cationic antimicrobial peptides (cAMPs). The remodeling can occur in various parts of the envelope, from the capsule (51) to lipid A remodeling (5), LPS decoration (52), fatty acid composition changes (53), and PG modifications (54, 55). Two-component regulatory systems like PhoP/PhoQ and PmrA/PmrB respond to cAMPs in the environment, triggering the expression of genes involved in cell surface remodeling. Our study demonstrates that alterations in membrane phospholipid content did not result in the activation of PhoP/PhoQ. However, further studies are required to assess whether PhoP/PhoQ activation upon exposure to specific stress conditions (e.g., exposure to cAMPs, detergent, or low Mg2+) is hampered by phospholipid alteration.
We demonstrate here that membrane phospholipid alterations stimulate the activation of several stress response pathways (σE, Cpx, Rcs, Bae, and σS), even in the absence of additional stressors. Sigma factors involved in the response to various cellular stresses (RpoE, the extracytoplasmic stress sigma factor; RpoH, the heat shock sigma factor; and RpoS, the starvation/stationary-phase sigma factor) increased in abundance in phospholipid-altered strains, while cellular levels of the housekeeping sigma factor RpoD decreased. We also found concomitant increases in the levels of DegP protease, consistent with the activation of the envelope stress response pathway. Phospholipid alterations also resulted in subtle changes in the expression levels of the cytoplasmic chaperones GroL and DnaK, pointing toward possible perturbations of protein-folding processes and/or management of the deleterious effects of stress. This has significant implications for the regulation of metabolism, which often does not occur at the level of gene expression but instead at the level of enzyme activity through allosteric regulation or protein modification. The effects of membrane phospholipid composition on correct membrane protein folding, topology, and function have previously been described and dissected both in vivo and in vitro (22). The importance of proper membrane phospholipid composition for signal transduction was originally observed in vivo in PE-lacking cells for the Cpx stress response system, and our results demonstrate that the Cpx system is also activated in vivo upon modulation of CL and PG/CL contents. CpxA activity has recently been dissected in vitro (56), and the ability of CpxA (the transmembrane component of this system) to directly sense phospholipid composition changes was demonstrated. The Cpx system can affect the transcription of over 100 genes, several of them involved in lipid homeostasis (2, 4, 57), potentially linking Cpx activation to lipid composition remodeling. Several proteins involved in cellular envelope remodeling are integral membrane proteins, including the two-component systems and proteins involved in the synthesis and transport of cell envelope components. Therefore, it is conceivable that the membrane phospholipid composition might affect the structure, function, and/or protein-protein interactions of integral membrane proteins. Future studies will show whether phospholipid alterations affect the activation of the two-component systems when cells are subjected to external challenges and which molecular mechanisms are involved in the regulation of the stress response pathway activation and downstream signaling.
A comprehensive understanding of bacterial cellular processes is essential for the development of antimicrobial therapies, making it crucial to decipher the role of phospholipids in how the cell detects and integrates environmental signals and regulates cellular homeostasis. The pleiotropic phenotypes and various cellular responses exhibited after phospholipid alteration in vivo emphasize the need for complementary approaches to provide a comprehensive and undistorted picture of how microorganisms respond to environmental changes. Further studies of the influence of both steady-state and dynamic membrane phospholipid alterations on cellular envelope structure and function will be necessary to understand how cellular envelope remodeling processes are affected by phospholipid composition.
MATERIALS AND METHODS
Bacterial strains and reagents.
Strain AL95 carrying the null allele of the pssA gene (pss93::Kanr), encoding phosphatidylserine synthase, completely lacks PE (referred to as minus PE), which is replaced by PG and CL (58). This mutant is viable if grown in the presence of 20 to 50 mM MgCl2 or if it carries a plasmid-borne copy of the pss gene on plasmid pDD72GM (strain AL95/pDD72GM pssA+ Genr, with a pSC101 temperature-sensitive replicon, referred to herein as the WT). Strain BKT12 (15), carrying the null alleles of the three cls genes (ΔclsABC) encoding cardiolipin synthases, completely lacks CL, which is replaced by PE and PG (referred to as minus CL). Strain AT2033 (PLtetO-1-pssA+ pss93::Kanr lacY::Tn9 recA srl::Tn10), in which the PE content of the cell can be regulated by the concentration of anhydrotetracycline (aTc) in the growth medium, was previously described (31). Strain UE53 (MG1655 lpp-2 Δara714 rcsF::mini-Tn10 cam) exhibits WT phospholipid composition and is the parental strain to UE54 (UE53 pgsA::Kanr), carrying the null allele of the pgsA gene (encoding phosphatidylglycerol synthase), which completely lacks PG and CL (referred to as minus PG/CL) (44). Cell growth assays were performed at 37°C for the minus-PE, minus-CL, UE53, minus-PG/CL, and AT2033 strains and at 30°C for the WT strain.
Microscopy.
Overnight cultures grown in LB or M9 minimal medium were diluted 100-fold and grown in LB medium or M9 minimal medium, respectively, at the appropriate temperature to mid-exponential phase (optical density at 600 nm [OD600] of ∼0.3 in LB medium and of ∼0.15 in M9 minimal medium). For membrane staining, FM 4-64 dye [N-(3-triethylammoniumpropyl)-4-{6-[4-(diethylamino) phenyl] hexatrienyl} pyridinium dibromide] was added at a final concentration of 1 μM and cells were incubated in the dark for 15 min at 30°C. Cells were then spotted onto 2% LB–agarose pads for imaging. Fluorescence images were taken immediately with appropriate filter sets for visualization of FM 4-64. Mid-exponential-phase cell cultures were spotted onto LB-agarose pads and visualized by using an Olympus BX60 microscope with 100× phase-contrast and differential interference contrast (DIC) oil immersion objectives. Images were captured with a Hamamatsu ORCA charge-coupled device (CCD) camera. Images of biofilms were captured on an inverted Olympus IX81 microscope equipped with a ProScan II (Prior Scientific) motorized stage, a Lambda 10-3 filter wheel system, a Lumen 200 (Prior Scientific) fluorescence illumination system, a 100× DIC objective, and a high-resolution Hamamatsu C10600 CCD camera.
Quantitation of cell length.
Cell length measurements were generated from phase-contrast images using Oufti software (59) after first subtracting the image background in ImageJ (60).
Ultrastructural analysis by electron microscopy.
Overnight cultures grown in LB were diluted 100-fold and further grown in LB at the appropriate temperature until they reached mid-exponential (OD600 of ∼0.3) or stationary phase (OD600 of ∼2). Cells were harvested by centrifugation at 6,000 × g for 5 min, and bacteria from 2 ml of culture medium were washed three times with 5 ml phosphate-buffered saline (PBS; 0.1 M, pH 7.4) containing 50 mM MgCl2. Cells were fixed by reaction with glutaraldehyde (2.5% [vol/vol] in 0.1 M PBS, pH 7.4) at 4°C, treated with osmium tetroxide (0.1% [wt/vol] in 0.1 M PBS) at 4°C for 2 h (61), and washed in this buffer at 4°C for 15 min. Then, cells were dehydrated in a graded ethanol series at 4°C (to reduce loss of lipids) as follows: 70% ethanol (2 times for 10 min each), 90% ethanol (2 times for 10 min each), and 100% ethanol (3 times for 20 min each). Cells were stained initially in this first step with a low concentration of uranyl acetate (4% [wt/vol] in 70% ethanol) for 1 h. The dehydrated cells were embedded in Epon 812 resin by transferring them into propylene oxide (2 times for 10 min each) and exchanging them to a mixture of propylene oxide and resin (1:1) for 6 h. Cells were then placed in 100% resin for 24 h under vacuum, leaving the cap off to allow solvent evaporation. Finally, cells were blocked out in fresh resin and allowed to polymerize at 60°C for 48 h. Blocks were cut on an ultramicrotome with glass knives, and sections 150 nm thick were picked on copper grids and restained for 5 min each with uranyl acetate (15% [wt/vol] in methanol) prior to transmission electron microscopy (TEM) imaging. The sections were examined in a JEOL 1400 electron microscope operated at 120 kV, equipped with an Orius camera (Gatan, Inc., Pleasanton, CA). Images were collected at magnifications ranging from ×6,000 to ×150,000.
LPS isolation and analysis.
Cells were grown in LB containing 50 mM MgCl2 to stationary phase, and crude LPS extracts were then isolated using an LPS extraction kit (Intron Biotechnology, Inc.). Briefly, cells from individual stationary-phase cultures of WT and phospholipid-altered E. coli strains (5 ml) were harvested by centrifugation at 13,000 × g at room temperature. Each pellet was resuspended in 1 ml of lysis buffer, standardized to an OD600 of 1, and vortexed vigorously. Two hundred microliters of chloroform was added to each preparation, and the suspensions were centrifuged at 13,000 × g for 10 min at 4°C. The supernatant was transferred into new microcentrifuge tubes, and 800 μl of purification buffer was added. The suspension was then mixed and incubated for 10 min at −20°C to purify LPS from other cell components (i.e., proteins, nucleic acids, and lipids). The suspensions were centrifuged at 13,000 × g for 15 min at 4°C, and LPS pellets were washed with 70% ethanol (1 ml) and completely dried using a stream of nitrogen gas. The LPS pellets were resuspended in 50 μl of distilled water, mixed with 50 μl of 2× Laemmli sample buffer, and electrophoresed in 4 to 12% SDS-PAGE gels. LPS was visualized by silver staining. The absence of nucleic acid and protein contaminants was checked by measuring the absorbance of the resuspended pellet at 260 and 280 nm, respectively.
OmpF folding assays.
We explored the assembly and folding of the outer membrane protein OmpF as a proxy for outer membrane biogenesis by assessing the differential electrophoretic mobilities of folded and nonnative outer membrane proteins, as previously described (32). Total membranes were prepared using WT and phospholipid-altered E. coli cells grown in LB medium to an OD600 of ∼1. Cells were harvested by centrifugation (6,000 × g for 10 min at 4°C), and the cell pellet was suspended in 50 mM sodium phosphate (NaPi, pH 7.5), 200 mM NaCl, 10 mM dithiothreitol (DTT), Complete protease inhibitor cocktail, and 30 mg/ml DNase I. Cells were disrupted with a French press at 1,500 lb/in2, and unbroken cells were removed by centrifugation (13,000 × g for 20 min at 4°C). The supernatant was transferred to new microcentrifuge tubes, and total membranes were collected by ultracentrifugation (150,000 × g for 45 min at 4°C). The pellet was resuspended in 50 mM NaPi (pH 7.5), 200 mM NaCl, containing Complete protease inhibitor cocktail. Samples were heated to 70°C for 20 min, subjected to Western blotting using SDS-PAGE and anti-OmpF antibody, and visualized using a Fluor-STM MultiImager (Bio-Rad) to assess proper folding. In all cases, equal amounts of total proteins were loaded onto each lane of the SDS-PAGE gel, as assessed by the micro-bicinchoninic acid (BCA) protein assay (Thermo) according to the manufacturer's instructions.
Metabolic labeling of the cell envelope.
Overnight cultures grown in M9 minimal medium were diluted 100-fold and grown until mid-exponential phase (OD600 of ∼0.15) in M9 minimal medium supplemented with SC amino acids, 2% glucose, 1 mM MgSO4, 100 μM CaCl2, 20 mM MgCl2, and 150 mM acetate. Next, overnight cultures were diluted into medium containing uniformly labeled [14C]glucose (20 μCi/ml) or [14C]acetate (20 μCi/ml). Following incubation with the radiolabeled substrate, cells were harvested and washed three times with PBS containing 20 mM MgCl2. Crude LPS (containing a mixture of exopolysaccharides, capsule, and LPS, referred to as outer membrane glycolipids) was extracted as described above, and 10 μl of the extraction was subjected to liquid scintillation counting. Total lipid extracts were prepared from cell pellets using a Bligh-Dyer two-phase extraction by first vigorously vortexing in chloroform-methanol (2:1 [vol/vol]). After centrifugation, the pellet was resuspended for a second extraction in methanol containing 0.1 N hydrochloric acid. Supernatants from the two extractions were pooled and concentrated under vacuum using a SpeedVac concentrator (Savant). The dried lipid film (containing both phospholipids and neutral lipids, referred to as total lipids) was resuspended in 20 μl of chloroform, and 10 μl of the extraction was subjected to liquid scintillation counting. Fatty acids (FA) of various derived fractions were prepared for analysis by sequential treatment with 4 N NaOH at 90°C to release ester- and amide-linked FA from the parent lipids, followed by neutralization of the solution and Bligh-Dyer lipid extraction. The released free fatty acids were recovered in the lower (chloroform) phase, dried under nitrogen, and resuspended in 20 μl of chloroform, and 10 μl of the extraction was subjected to liquid scintillation counting.
Cell lysate preparation and Western blotting.
Whole-cell lysates were prepared using WT and phospholipid-altered E. coli cells grown in LB medium to an OD600 of ∼1. Cells were harvested by centrifugation (6,000 × g for 10 min at 4°C), and the cell pellet was suspended in 50 mM NaPi (pH 7.5), 200 mM NaCl, 10 mM DTT, Complete protease inhibitor cocktail, and 30 mg/ml DNase I. Cells were disrupted with a French press at 1,500 lb/in2. Unbroken cells were removed by centrifugation (13,000 × g for 20 min at 4°C). The supernatant was collected, frozen, and stored at −80°C until further use. The proteins were resolved on 4 to 12% Bis-Tris SDS-PAGE gels and analyzed with an anti-RpoD, anti-RpoE, anti-RpoS, anti-RpoH, anti-DnaK, anti-GroL (MyBioSource), or anti-DegP (generous gift of J. Beckwith) antibody.
Bacterial physiology profiling.
Growth was monitored by cultivating cells in 200 μl of medium with shaking at the appropriate temperature in a BioTeK Synergy HT microplate reader instrument (BioTek Group) and measuring the absorbance at 600 nm every 10 min over a period of 12 h. The medium was either LB (supplemented with 50 mM MgCl2) or M9 minimal medium (supplemented with SC amino acids, 2% glucose, 1 mM MgSO4, 100 μM CaCl2, and 20 mM MgCl2). Growth curves were averaged over four determinations performed in duplicate.
The rates of glucose oxidation in exponentially growing WT and phospholipid-altered cells were determined as described previously by Goodwin et al. (34), using uniformly labeled [14C]glucose in M9 minimal medium supplemented with 2% glucose, SC amino acids, 1 mM MgSO4, 100 μM CaCl2, and 20 mM MgCl2. The cells were grown at the appropriate temperature in an incubator-shaker and harvested by centrifugation (6,000 × g for 5 min at 4°C) after 4 h, and the supernatant was immediately collected and placed on ice. Briefly, the content of 14CO2 in the culture medium was determined by trapping CO2 liberated by acidifying medium samples (500 μl). This was accomplished by transferring the sample to a 2-ml microcentrifuge tube, placing the tube within a scintillation vial containing 1 ml of hydroxide of hyamine, and sealing the vial with a serum cap before injecting 100 μl of 60% perchloric acid into the culture medium. The collection of CO2 was continued overnight, the centrifuge tube removed, and the vial processed for scintillation counting. Determinations were corrected for background radioactivity by trapping exhausted CO2 for 30 min in bacterium-free medium. Glucose oxidation rates were corrected for OD600 changes and averaged from the results of three independent replicates.
Cellular dehydrogenase activity was estimated using the MTT [3-(4,5-dimethylthiazol-2-yl)-2,5-diphenyltetrazolium bromide] assay (62). WT and phospholipid-altered cell suspensions were prepared by diluting (1/10 [vol/vol]) exponentially growing cultures (OD600 of ∼0.3) with fresh M9 minimal medium containing all the necessary supplements. To initiate the reduction reaction, the MTT stock solution (5 g/liter in water) was added to fresh cell dilutions, and the mixtures were incubated at 37°C. The formazan crystals produced were collected by centrifugation (10,000 × g for 30 s at room temperature), and the medium was pipetted off without shaking. The pellet was dissolved in 500 μl of dimethyl sulfoxide (DMSO) at room temperature, and the final volume was adjusted to 2.5 ml of DMSO in order to fully dissolve the formazan crystals before measuring the OD550. The MTT reduction activities of E. coli cells were averaged over four determinations performed in duplicate.
Membrane potential (ΔΨ) measurements were performed using DiSC35 (3,3-dipropylthiadicarbocyanine iodide), a lipophilic potentiometric dye, as described previously (63). Cells were treated with 2 mM EDTA prior to the addition of DiSC35 stock solution (final concentration, 0.4 μM) and quenching at room temperature for 30 min. KCl was then added (final concentration, 100 mM), and following 1 h of incubation at room temperature, 180-μl aliquots were placed in a black 96-well plate for 30 min to allow stabilization of the dye signal. The addition of the positively fluorescent probe DiSC35 to the cells results in a transient fluorescence that is self-quenched as the dye concentrates within the membrane. The addition of carbonyl cyanide 4-(trifluoromethoxy)phenylhydrazone (FCCP) dissipates the ΔΨ, with the magnitude of the increase in fluorescence due to the released DiSC35 being proportional to the ΔΨ. The addition of 5 μM FCCP was used to dissipate ΔΨ to measure the increased fluorescence of DiSC35, and the ΔΨ was monitored by measuring excitation/emission at 620/680 nm, respectively, under shaking at 30°C (BioTeK Synergy HT microplate reader). Data were obtained from at least three independent experiments performed in duplicate.
The levels of intracellular reactive oxygen species (ROS) were measured using fluorescent dye-based detection. Overnight cultures of WT or phospholipid-altered cells were inoculated in LB and grown at the appropriate temperature in an incubator shaker. On the day of each experiment, overnight cultures were diluted 1:200 in 50 ml of M9 minimal medium with all the necessary supplements and then distributed in 200-μl aliquots to each 2-ml well of a 96-well, deep-well culture plate containing either 10 μM fluorescent dye (chloromethal-H2DCFDA) or an equivalent volume of distilled water (no dye control). Ninety-six-well plates were grown at the appropriate temperature with shaking at 900 rpm to an OD600 of ∼0.3 in a light-protected incubator shaker. After incubation for 1 h, cells were washed twice and resuspended in fresh M9 minimal medium with all the necessary supplements, and fluorescence measurements were performed at 37°C by measuring excitation/emission at 495/520 nm, respectively. Data were obtained from at least three independent experiments performed in duplicate.
To monitor the cellular levels of ATP, we used the BacTiter-Glo microbial cell viability assay (Promega), a firefly luciferase bioluminescence-based assay, according to the manufacturer's instructions. Luminescence measurements were taken using a BioTeK Synergy HT microplate reader. Data were obtained from at least three independent experiments performed in duplicate.
Surface adhesion.
Phospholipid-dependent surface adhesion was evaluated by fluorescence microscopy after 24 h of cell growth. WT and phospholipid-altered strains (PE-lacking and CL-lacking cells) were grown in a glass bottom 24-well plate in M9 minimal medium containing 2% glucose, SC amino acids, and all the necessary supplements for 24 h without shaking at the appropriate temperature. At this time, nonadherent cells were removed by rinsing with PBS containing 50 mM MgCl2 twice. The viability of attached bacterial cells was determined using a Filmtracer Live/Dead biofilm viability kit (catalog number L10316; Thermo Fisher), which reveals viable (green) and nonviable (red) cells. This kit utilizes mixtures of SYTO 9 green fluorescent nucleic acid stain and the red fluorescent nucleic acid stain propidium iodide. These stains differ both in their spectral characteristics and in their ability to penetrate healthy cells. The staining was carried out according to the manufacturer's protocol, and cells were imaged on an Olympus IX81-ZDC automated inverted fluorescence microscope equipped with a 100× objective and a Hamamatsu electron-multiplying (EM)–CCD digital camera. The excitation/emission data were collected in tandem for all samples at 488/505 to 550 nm for SYTO 9 and 543/>650 nm for propidium iodide.
Microtiter plate biofilm formation assay.
WT and phospholipid-altered E. coli cells were grown overnight at the appropriate temperature in LB containing 50 mM MgCl2. Biofilm formation assays were performed as described previously (35), using M9 minimal medium containing glucose (at 0.2 or 2%), amino acids (SC mixture, containing all the amino acids, or complete supplement mixture [CSM], containing only the essential amino acids), and all the necessary supplements. Overnight cultures in LB were transferred (100 μl) to 10 ml of M9 minimal medium containing the aforementioned additives and vortexed. After vortexing, 100 μl of the dilution per well was transferred to a 96-well dish (previously rinsed with 70% ethanol) and air dried. To obtain reliable quantitative measurements, 4 to 8 replicate wells for each treatment were used. Plates were then sealed with a plastic membrane allowing gas exchange and incubated at the appropriate temperature for 24 h without shaking. Each plate included wells of medium without bacteria as control wells. The cell turbidity (OD600) was monitored using a BioTeK Synergy HT microplate reader to account for cell growth variations among phospholipid-altered strains and conditions. After 24 h, the medium was removed and each well was washed five times with sterile distilled water to remove loosely associated bacteria. The plates were air dried for 2 h, and each well was stained with 125 μl of 0.1% crystal violet solution for 15 min. After staining, the plates were washed with sterile distilled water five times. The quantitative analysis of biofilm production was performed by adding 125 μl of 30% acetic acid to destain the wells. One hundred microliters from each well was transferred to a new microtiter plate, and the amount of crystal violet present in the destaining solution was determined by measuring the OD550. The microtiter plate biofilm assay was performed three times for all strains and conditions, and the averages and standard deviations for all repetitions of the experiment were calculated.
Stress response screening.
Growth was monitored by cultivating cells in 200 μl of medium with shaking at the appropriate temperature in a BioTeK Synergy HT microplate reader and measuring the absorbance at 600 nm every 10 min over a period of 12 h. The medium was LB at pH 7.5 supplemented with 50 mM MgCl2 in the absence or presence of incremental concentrations of the following stressors: NaCl (ranging from 0 to 1 M in increments of 0.1 M, and 1.5 M) for salt stress, sorbitol (ranging from 0 to 1 M in increments of 0.1 M, and 2 M) for osmotic stress, and hydrogen peroxide (H2O2) and tert-butyl hydroperoxide (t-BHP) (ranging from 0 to 1 mM in increments of 0.1 mM) for oxidative stress. For pH stress, LB supplemented with 50 mM MgCl2 was prepared and adjusted to pHs ranging from 5.5 to 10.5 (in increments of 0.5 pH).
Promoter activity assays.
For promoter activity measurements, selected promoters to be assessed (PdegP, PcpxP, Pspy, PhtpG, PosmB, PcpsB, PphoP, and PcrcA) were obtained from the E. coli promoter collection described previously (64). The ampicillin resistance-coding sequence was inserted into the BglII and XhoI sites of plasmid pMSs201. The Ampr open reading frame (ORF) was obtained from plasmid pBR322, where XhoI and BglII sites were engineered flanking the Ampr ORF by PCR mutagenesis. WT and phospholipid-altered E. coli strains were transformed with the modified pMSs201 plasmid by the RbCl-CaCl method. Transformants were selected by plating on LB supplemented with 100 μg/ml ampicillin. Green fluorescent protein (GFP) measurements were conducted in 96-well plates (200 μl/well) using a BioTeK Synergy HT microplate reader with linear shaking at 30°C. Frozen glycerol stocks were used to inoculate LB complex medium supplemented with 100 μg/ml ampicillin for cultivation of cells containing GFP reporter plasmids. All further cultivations were performed without antibiotics. After 8 h, LB cultures were used to inoculate precultures in M9 minimal medium supplemented with 2% glucose and all the amino acids (SC mixture) for overnight cultivation. On the following day, the M9 precultures were used for inoculation at 1:100 (vol/vol) for the final experiments. Relative expression levels were calculated from measurements of batch experiments with linear shaking at 30°C by measuring the OD600 and GFP fluorescence (486 nm excitation and 510 nm emission) every 10 min to follow biomass formation and GFP expression, respectively (65). Background optical density due to the growth medium was subtracted, and for GFP measurements, additional background fluorescence due to biomass was also subtracted. Potential leaky expression was measured using an empty plasmid (containing no intergenic regulated region) and was undetectable under all conditions used in this study. Specific fluorescence intensities were calculated by normalizing fluorescence values against the OD600 for the respective wells. Since the GFP-mut2 variant is highly stable and nontoxic to the cells, the accumulation of fluorescence serves as a reporter of transcription initiation in the cells (64).
Lipid extraction and TLC analysis.
Lipid extraction was performed using a neutral Bligh-Dyer method. Cell pellets from cells grown to mid-exponential phase in M9 minimal medium supplemented with 2% glucose and all the amino acids (SC mixture) were washed twice with PBS before extraction. The washed pellets were then suspended in 1.9 ml of PBS, followed by the addition of 4.8 ml of methanol and 2.4 ml of chloroform to create a single-phase solution. The solution was incubated for 30 min at room temperature with intermittent mixing. After centrifugation at 3,500 × g for 10 min, the supernatant was converted into a two-phase solution by adding 2.4 ml of PBS and 2.4 ml of chloroform. After centrifugation at 3,500 × g for 10 min, the lower phase was recovered and dried under a stream of nitrogen gas. For thin-layer chromatography (TLC) analysis of phospholipids, the dried lipid extracts were each dissolved in 100 μl of chloroform-methanol (2:1 [vol/vol]). Approximately 5 μl of the solution was spotted onto a TLC silica gel 60 plate. The TLC plate was developed in tanks equilibrated with chloroform-methanol-acetic acid (65:25:10 [vol/vol]). After drying the plate, lipids were visualized with iodine vapor. After spot identification and scraping, determination of lipid phosphate by malachite green was performed as previously described (66).
In vivo (p)ppGpp accumulation assay.
WT and phospholipid-altered cells were grown in M9 minimal medium supplemented with 2% glucose and all the amino acids (SC mixture). At an OD600 of 0.05, cells were labeled with H332PO4 (50 μCi/ml). The reactions were stopped when cells reached an OD600 of ∼0.4 by the addition of 25 μl of formic acid per 100 μl of reaction mixture volume. Aliquots (10 μl) of each reaction mixture were loaded and separated on TLC polyethylenimine (PEI) cellulose plates (Merck) using 1.5 M KH2PO4 as the mobile phase. The dry plate was exposed to a storage phosphor screen (Eastman Kodak Co.) overnight. Plates were autoradiographed using a Molecular Imager FX (Bio-Rad).
Statistical analysis.
Comparisons between groups were performed by nonparametric (Tukey's honestly significant difference [HSD] test) and parametric (Student's t test) test methods for pairwise comparisons and by multiple comparisons of means (one-way and multiway analysis of variance [ANOVA]) with post hoc analysis (Tukey's HSD test and Student's t test). P values of <0.05 and a fold change of ≤0.5 or ≥2 were considered statistically significant.
ACKNOWLEDGMENTS
We thank Kevin Morano for providing generous access to the plate reader equipment. We are grateful for the insightful comments from the anonymous reviewers. We also thank Steven Kolodziej and Patricia Navarro for help with electron microscopy.
This work was supported by grant numbers NIH-GM-61074 to W.M., NIH-HL-61483 to H.T., and NIH-GM-20478 to W.D. and by grants from the Roderick MacDonald Research Fund to A.K. and from the John Dunn Research Foundation to W.D. H.V. was supported in part by funds from the Department of Biochemistry and Molecular Biology. V.W.R. was supported in part by funds from the University of Texas Graduate School of Biomedical Sciences.
Footnotes
For a commentary on this article, see https://doi.org/10.1128/JB.00136-17.
REFERENCES
- 1.Ruiz N, Silhavy TJ. 2005. Sensing external stress: watchdogs of the Escherichia coli cell envelope. Curr Opin Microbiol 8:122–126. doi: 10.1016/j.mib.2005.02.013. [DOI] [PubMed] [Google Scholar]
- 2.Raivio TL. 2005. Envelope stress responses and Gram-negative bacterial pathogenesis. Mol Microbiol 56:1119–1128. doi: 10.1111/j.1365-2958.2005.04625.x. [DOI] [PubMed] [Google Scholar]
- 3.Rowley G, Spector M, Kormanec J, Roberts M. 2006. Pushing the envelope: extracytoplasmic stress responses in bacterial pathogens. Nat Rev Microbiol 4:383–394. doi: 10.1038/nrmicro1394. [DOI] [PubMed] [Google Scholar]
- 4.Silhavy TJ, Kahne D, Walker S. 2010. The bacterial cell envelope. Cold Spring Harb Perspect Biol 2:a000414. doi: 10.1101/cshperspect.a000414. [DOI] [PMC free article] [PubMed] [Google Scholar]
- 5.Needham BD, Trent MS. 2013. Fortifying the barrier: the impact of lipid A remodelling on bacterial pathogenesis. Nat Rev Microbiol 11:467–481. doi: 10.1038/nrmicro3047. [DOI] [PMC free article] [PubMed] [Google Scholar]
- 6.Nikaido H. 2003. Molecular basis of bacterial outer membrane permeability revisited. Microbiol Mol Biol Rev 67:593–656. doi: 10.1128/MMBR.67.4.593-656.2003. [DOI] [PMC free article] [PubMed] [Google Scholar]
- 7.Hiraoka S, Matsuzaki H, Shibuya I. 1993. Active increase in cardiolipin synthesis in the stationary growth phase and its physiological significance in Escherichia coli. FEBS Lett 336:221–224. doi: 10.1016/0014-5793(93)80807-7. [DOI] [PubMed] [Google Scholar]
- 8.Shibuya I. 1992. Metabolic regulations and biological functions of phospholipids in Escherichia coli. Prog Lipid Res 31:245–299. doi: 10.1016/0163-7827(92)90010-G. [DOI] [PubMed] [Google Scholar]
- 9.Vanden Boom T, Cronan JE Jr. 1989. Genetics and regulation of bacterial lipid metabolism. Annu Rev Microbiol 43:317–343. doi: 10.1146/annurev.mi.43.100189.001533. [DOI] [PubMed] [Google Scholar]
- 10.Zhang YM, Rock CO. 2008. Membrane lipid homeostasis in bacteria. Nat Rev Microbiol 6:222–233. doi: 10.1038/nrmicro1839. [DOI] [PubMed] [Google Scholar]
- 11.Dowhan W. 2009. Molecular genetic approaches to defining lipid function. J Lipid Res 50:S305–S310. doi: 10.1194/jlr.R800041-JLR200. [DOI] [PMC free article] [PubMed] [Google Scholar]
- 12.Raetz CR. 1986. Molecular genetics of membrane phospholipid synthesis. Annu Rev Genet 20:253–295. doi: 10.1146/annurev.ge.20.120186.001345. [DOI] [PubMed] [Google Scholar]
- 13.Dowhan W. 2013. A retrospective: use of Escherichia coli as a vehicle to study phospholipid synthesis and function. Biochim Biophys Acta 1831:471–494. doi: 10.1016/j.bbalip.2012.08.007. [DOI] [PMC free article] [PubMed] [Google Scholar]
- 14.Castanié-Cornet MP, Cam K, Jacq A. 2006. RcsF is an outer membrane lipoprotein involved in the RcsCDB phosphorelay signaling pathway in Escherichia coli. J Bacteriol 188:4264–4270. doi: 10.1128/JB.00004-06. [DOI] [PMC free article] [PubMed] [Google Scholar]
- 15.Tan BK, Bogdanov M, Zhao J, Dowhan W, Raetz CR, Guan Z. 2012. Discovery of a cardiolipin synthase utilizing phosphatidylethanolamine and phosphatidylglycerol as substrates. Proc Natl Acad Sci U S A 109:16504–16509. doi: 10.1073/pnas.1212797109. [DOI] [PMC free article] [PubMed] [Google Scholar]
- 16.Kim Y, Li H, Binkowski TA, Holzle D, Joachimiak A. 2009. Crystal structure of fatty acid/phospholipid synthesis protein PlsX from Enterococcus faecalis. J Struct Funct Genomics 10:157–163. doi: 10.1007/s10969-008-9052-9. [DOI] [PMC free article] [PubMed] [Google Scholar]
- 17.Liu X, Yin Y, Wu J, Liu Z. 2014. Structure and mechanism of an intramembrane liponucleotide synthetase central for phospholipid biosynthesis. Nat Commun 5:4244. doi: 10.1038/ncomms5244. [DOI] [PMC free article] [PubMed] [Google Scholar]
- 18.Fan J, Jiang D, Zhao Y, Liu J, Zhang XC. 2014. Crystal structure of lipid phosphatase Escherichia coli phosphatidylglycerophosphate phosphatase B. Proc Natl Acad Sci U S A 111:7636–7640. doi: 10.1073/pnas.1403097111. [DOI] [PMC free article] [PubMed] [Google Scholar]
- 19.Li D, Lyons JA, Pye VE, Vogeley L, Aragão D, Kenyon CP, Shah ST, Doherty C, Aherne M, Caffrey M. 2013. Crystal structure of the integral membrane diacylglycerol kinase. Nature 497:521–524. doi: 10.1038/nature12179. [DOI] [PMC free article] [PubMed] [Google Scholar]
- 20.Liu A, Tran L, Becket E, Lee K, Chinn L, Park E, Tran K, Miller JH. 2010. Antibiotic sensitivity profiles determined with an Escherichia coli gene knockout collection: generating an antibiotic bar code. Antimicrob Agents Chemother 54:1393–1403. doi: 10.1128/AAC.00906-09. [DOI] [PMC free article] [PubMed] [Google Scholar]
- 21.Tamae C, Liu A, Kim K, Sitz D, Hong J, Becket E, Bui A, Solaimani P, Tran KP, Yang H, Miller JH. 2008. Determination of antibiotic hypersensitivity among 4,000 single-gene-knockout mutants of Escherichia coli. J Bacteriol 190:5981–5988. doi: 10.1128/JB.01982-07. [DOI] [PMC free article] [PubMed] [Google Scholar]
- 22.Bogdanov M, Dowhan W, Vitrac H. 2014. Lipids and topological rules governing membrane protein assembly. Biochim Biophys Acta 1843:1475–1488. doi: 10.1016/j.bbamcr.2013.12.007. [DOI] [PMC free article] [PubMed] [Google Scholar]
- 23.Mileykovskaya E, Ryan AC, Mo X, Lin CC, Khalaf KI, Dowhan W, Garrett TA. 2009. Phosphatidic acid and N-acylphosphatidylethanolamine form membrane domains in Escherichia coli mutant lacking cardiolipin and phosphatidylglycerol. J Biol Chem 284:2990–3000. doi: 10.1074/jbc.M805189200. [DOI] [PMC free article] [PubMed] [Google Scholar]
- 24.Rietveld AG, Killian JA, Dowhan W, de Kruijff B. 1993. Polymorphic regulation of membrane phospholipid composition in Escherichia coli. J Biol Chem 268:12427–12433. [PubMed] [Google Scholar]
- 25.Campos M, Surovtsev IV, Kato S, Paintdakhi A, Beltran B, Ebmeier SE, Jacobs-Wagner C. 2014. A constant size extension drives bacterial cell size homeostasis. Cell 159:1433–1446. doi: 10.1016/j.cell.2014.11.022. [DOI] [PMC free article] [PubMed] [Google Scholar]
- 26.Yoshida M, Tsuru S, Hirata N, Seno S, Matsuda H, Ying BW, Yomo T. 2014. Directed evolution of cell size in Escherichia coli. BMC Evol Biol 14:257. doi: 10.1186/s12862-014-0257-1. [DOI] [PMC free article] [PubMed] [Google Scholar]
- 27.Kubitschek HE. 1990. Cell volume increase in Escherichia coli after shifts to richer media. J Bacteriol 172:94–101. doi: 10.1128/jb.172.1.94-101.1990. [DOI] [PMC free article] [PubMed] [Google Scholar]
- 28.Wang X, Quinn PJ. 2010. Lipopolysaccharide: biosynthetic pathway and structure modification. Prog Lipid Res 49:97–107. doi: 10.1016/j.plipres.2009.06.002. [DOI] [PubMed] [Google Scholar]
- 29.Sung BH, Lee CH, Yu BJ, Lee JH, Lee JY, Kim MS, Blattner FR, Kim SC. 2006. Development of a biofilm production-deficient Escherichia coli strain as a host for biotechnological applications. Appl Environ Microbiol 72:3336–3342. doi: 10.1128/AEM.72.5.3336-3342.2006. [DOI] [PMC free article] [PubMed] [Google Scholar]
- 30.Nishijima M, Raetz CR. 1979. Membrane lipid biogenesis in Escherichia coli: identification of genetic loci for phosphatidylglycerophosphate synthetase and construction of mutants lacking phosphatidylglycerol. J Biol Chem 254:7837–7844. [PubMed] [Google Scholar]
- 31.Bogdanov M, Xie J, Heacock P, Dowhan W. 2008. To flip or not to flip: lipid-protein charge interactions are a determinant of final membrane protein topology. J Cell Biol 182:925–935. doi: 10.1083/jcb.200803097. [DOI] [PMC free article] [PubMed] [Google Scholar]
- 32.Grijpstra J, Bos MP, Tommassen J. 2013. Assembly of bacterial outer membrane proteins. Methods Mol Biol 966:223–237. doi: 10.1007/978-1-62703-245-2_14. [DOI] [PubMed] [Google Scholar]
- 33.Schembri MA, Kjaergaard K, Klemm P. 2003. Global gene expression in Escherichia coli biofilms. Mol Microbiol 48:253–267. doi: 10.1046/j.1365-2958.2003.03432.x. [DOI] [PubMed] [Google Scholar]
- 34.Goodwin GW, Taylor CS, Taegtmeyer H. 1998. Regulation of energy metabolism of the heart during acute increase in heart work. J Biol Chem 273:29530–29539. doi: 10.1074/jbc.273.45.29530. [DOI] [PubMed] [Google Scholar]
- 35.O'Toole GA. 2011. Microtiter dish biofilm formation assay. J Vis Exp 2011:e2437. doi: 10.3791/2437. [DOI] [PMC free article] [PubMed] [Google Scholar]
- 36.Mecsas J, Rouviere PE, Erickson JW, Donohue TJ, Gross CA. 1993. The activity of sigma E, an Escherichia coli heat-inducible sigma-factor, is modulated by expression of outer membrane proteins. Genes Dev 7:2618–2628. doi: 10.1101/gad.7.12b.2618. [DOI] [PubMed] [Google Scholar]
- 37.Costanzo A, Ades SE. 2006. Growth phase-dependent regulation of the extracytoplasmic stress factor, sigmaE, by guanosine 3′,5′-bispyrophosphate (ppGpp). J Bacteriol 188:4627–4634. doi: 10.1128/JB.01981-05. [DOI] [PMC free article] [PubMed] [Google Scholar]
- 38.Wendrich TM, Blaha G, Wilson DN, Marahiel MA, Nierhaus KH. 2002. Dissection of the mechanism for the stringent factor RelA. Mol Cell 10:779–788. doi: 10.1016/S1097-2765(02)00656-1. [DOI] [PubMed] [Google Scholar]
- 39.Xiao H, Kalman M, Ikehara K, Zemel S, Glaser G, Cashel M. 1991. Residual guanosine 3′,5′-bispyrophosphate synthetic activity of relA null mutants can be eliminated by spoT null mutations. J Biol Chem 266:5980–5990. [PubMed] [Google Scholar]
- 40.Spira B, Silberstein N, Yagil E. 1995. Guanosine 3′,5′-bispyrophosphate (ppGpp) synthesis in cells of Escherichia coli starved for Pi. J Bacteriol 177:4053–4058. [DOI] [PMC free article] [PubMed] [Google Scholar]
- 41.Vinella D, Albrecht C, Cashel M, D'Ari R. 2005. Iron limitation induces SpoT-dependent accumulation of ppGpp in Escherichia coli. Mol Microbiol 56:958–970. doi: 10.1111/j.1365-2958.2005.04601.x. [DOI] [PubMed] [Google Scholar]
- 42.Seyfzadeh M, Keener J, Nomura M. 1993. spoT-dependent accumulation of guanosine tetraphosphate in response to fatty acid starvation in Escherichia coli. Proc Natl Acad Sci U S A 90:11004–11008. doi: 10.1073/pnas.90.23.11004. [DOI] [PMC free article] [PubMed] [Google Scholar]
- 43.Battesti A, Bouveret E. 2006. Acyl carrier protein/SpoT interaction, the switch linking SpoT-dependent stress response to fatty acid metabolism. Mol Microbiol 62:1048–1063. doi: 10.1111/j.1365-2958.2006.05442.x. [DOI] [PubMed] [Google Scholar]
- 44.Shiba Y, Yokoyama Y, Aono Y, Kiuchi T, Kusaka J, Matsumoto K, Hara H. 2004. Activation of the Rcs signal transduction system is responsible for the thermosensitive growth defect of an Escherichia coli mutant lacking phosphatidylglycerol and cardiolipin. J Bacteriol 186:6526–6535. doi: 10.1128/JB.186.19.6526-6535.2004. [DOI] [PMC free article] [PubMed] [Google Scholar]
- 45.Li SJ, Cronan JE Jr. 1993. Growth rate regulation of Escherichia coli acetyl coenzyme A carboxylase, which catalyzes the first committed step of lipid biosynthesis. J Bacteriol 175:332–340. doi: 10.1128/jb.175.2.332-340.1993. [DOI] [PMC free article] [PubMed] [Google Scholar]
- 46.Bügl H, Fauman EB, Staker BL, Zheng F, Kushner SR, Saper MA, Bardwell JC, Jakob U. 2000. RNA methylation under heat shock control. Mol Cell 6:349–360. doi: 10.1016/S1097-2765(00)00035-6. [DOI] [PubMed] [Google Scholar]
- 47.Weiser JN. 2013. The battle with the host over microbial size. Curr Opin Microbiol 16:59–62. doi: 10.1016/j.mib.2013.01.001. [DOI] [PMC free article] [PubMed] [Google Scholar]
- 48.Dalia AB, Weiser JN. 2011. Minimization of bacterial size allows for complement evasion and is overcome by the agglutinating effect of antibody. Cell Host Microbe 10:486–496. doi: 10.1016/j.chom.2011.09.009. [DOI] [PMC free article] [PubMed] [Google Scholar]
- 49.Ramos JL, Gallegos MT, Marqués S, Ramos-González MI, Espinosa-Urgel M, Segura A. 2001. Responses of Gram-negative bacteria to certain environmental stressors. Curr Opin Microbiol 4:166–171. doi: 10.1016/S1369-5274(00)00183-1. [DOI] [PubMed] [Google Scholar]
- 50.Giles DK, Hankins JV, Guan Z, Trent MS. 2011. Remodelling of the Vibrio cholerae membrane by incorporation of exogenous fatty acids from host and aquatic environments. Mol Microbiol 79:716–728. doi: 10.1111/j.1365-2958.2010.07476.x. [DOI] [PMC free article] [PubMed] [Google Scholar]
- 51.Olaitan AO, Morand S, Rolain JM. 2014. Mechanisms of polymyxin resistance: acquired and intrinsic resistance in bacteria. Front Microbiol 5:643. doi: 10.3389/fmicb.2014.00643. [DOI] [PMC free article] [PubMed] [Google Scholar]
- 52.Chen HD, Groisman EA. 2013. The biology of the PmrA/PmrB two-component system: the major regulator of lipopolysaccharide modifications. Annu Rev Microbiol 67:83–112. doi: 10.1146/annurev-micro-092412-155751. [DOI] [PMC free article] [PubMed] [Google Scholar]
- 53.Kumariya R, Sood SK, Rajput YS, Saini N, Garsa AK. 2015. Increased membrane surface positive charge and altered membrane fluidity leads to cationic antimicrobial peptide resistance in Enterococcus faecalis. Biochim Biophys Acta 1848:1367–1375. doi: 10.1016/j.bbamem.2015.03.007. [DOI] [PubMed] [Google Scholar]
- 54.Klein S, Lorenzo C, Hoffmann S, Walther JM, Storbeck S, Piekarski T, Tindall BJ, Wray V, Nimtz M, Moser J. 2009. Adaptation of Pseudomonas aeruginosa to various conditions includes tRNA-dependent formation of alanyl-phosphatidylglycerol. Mol Microbiol 71:551–565. doi: 10.1111/j.1365-2958.2008.06562.x. [DOI] [PubMed] [Google Scholar]
- 55.Dalebroux ZD, Miller SI. 2014. Salmonellae PhoPQ regulation of the outer membrane to resist innate immunity. Curr Opin Microbiol 17:106–113. doi: 10.1016/j.mib.2013.12.005. [DOI] [PMC free article] [PubMed] [Google Scholar]
- 56.Keller R, Ariöz C, Hansmeier N, Stenberg-Bruzell F, Burstedt M, Vikström D, Kelly A, Wieslander Å, Daley DO, Hunke S. 2015. The Escherichia coli envelope stress sensor CpxA responds to changes in lipid bilayer properties. Biochemistry 54:3670–3676. doi: 10.1021/acs.biochem.5b00242. [DOI] [PubMed] [Google Scholar]
- 57.De Wulf P, McGuire AM, Liu X, Lin EC. 2002. Genome-wide profiling of promoter recognition by the two-component response regulator CpxR-P in Escherichia coli. J Biol Chem 277:26652–26661. doi: 10.1074/jbc.M203487200. [DOI] [PubMed] [Google Scholar]
- 58.DeChavigny A, Heacock PN, Dowhan W. 1991. Sequence and inactivation of the pss gene of Escherichia coli: phosphatidylethanolamine may not be essential for cell viability. J Biol Chem 266:5323–5332. [PubMed] [Google Scholar]
- 59.Paintdakhi A, Parry B, Campos M, Irnov I, Elf J, Surovtsev I, Jacobs-Wagner C. 2016. Oufti: an integrated software package for high-accuracy, high-throughput quantitative microscopy analysis. Mol Microbiol 99:767–777. doi: 10.1111/mmi.13264. [DOI] [PMC free article] [PubMed] [Google Scholar]
- 60.Schneider CA, Rasband WS, Eliceiri KW. 2012. NIH Image to ImageJ: 25 years of image analysis. Nat Methods 9:671–675. doi: 10.1038/nmeth.2089. [DOI] [PMC free article] [PubMed] [Google Scholar]
- 61.Ryter A, Kellenberger E. 1958. Embedding in polyester for ultrathin sections. J Ultrastruct Res 2:200–214. doi: 10.1016/S0022-5320(58)90018-2. [DOI] [PubMed] [Google Scholar]
- 62.Wang H, Cheng H, Wang F, Wei D, Wang X. 2010. An improved 3-(4,5-dimethylthiazol-2-yl)-2,5-diphenyl tetrazolium bromide (MTT) reduction assay for evaluating the viability of Escherichia coli cells. J Microbiol Methods 82:330–333. doi: 10.1016/j.mimet.2010.06.014. [DOI] [PubMed] [Google Scholar]
- 63.Farrelly E, Amaral MC, Marshall L, Huang SG. 2001. A high-throughput assay for mitochondrial membrane potential in permeabilized yeast cells. Anal Biochem 293:269–276. doi: 10.1006/abio.2001.5139. [DOI] [PubMed] [Google Scholar]
- 64.Zaslaver A, Bren A, Ronen M, Itzkovitz S, Kikoin I, Shavit S, Liebermeister W, Surette MG, Alon U. 2006. A comprehensive library of fluorescent transcriptional reporters for Escherichia coli. Nat Methods 3:623–628. doi: 10.1038/nmeth895. [DOI] [PubMed] [Google Scholar]
- 65.Samorski M, Müller-Newen G, Büchs J. 2005. Quasi-continuous combined scattered light and fluorescence measurements: a novel measurement technique for shaken microtiter plates. Biotechnol Bioeng 92:61–68. doi: 10.1002/bit.20573. [DOI] [PubMed] [Google Scholar]
- 66.Vitrac H, Bogdanov M, Dowhan W. 2013. In vitro reconstitution of lipid-dependent dual topology and postassembly topological switching of a membrane protein. Proc Natl Acad Sci U S A 110:9338–9343. doi: 10.1073/pnas.1304375110. [DOI] [PMC free article] [PubMed] [Google Scholar]