Abstract
Analyses of the interrelationships between RNA structure and function are increasingly important components of genomic studies. The SHAPE-MaP strategy enables accurate RNA structure probing and realistic structure modeling of kilobase-length noncoding RNAs and mRNAs. Existing tools for visualizing RNA structure models are not suitable for efficient analysis of long, structurally heterogeneous RNAs. In addition, structure models are often advantageously interpreted in the context of other experimental data and gene annotation information, for which few tools currently exist. We have developed a module within the widely used and well supported open-source Integrative Genomics Viewer (IGV) that allows visualization of SHAPE and other chemical probing data, including raw reactivities, data-driven structural entropies, and data-constrained base-pair secondary structure models, in context with linear genomic data tracks. We illustrate the usefulness of visualizing RNA structure in the IGV by exploring structure models for a large viral RNA genome, comparing bacterial mRNA structure in cells with its structure under cell- and protein-free conditions, and comparing a noncoding RNA structure modeled using SHAPE data with a base-pairing model inferred through sequence covariation analysis.
Keywords: RNA structure, SHAPE-MaP, IGV, entropy, pairing probabilities
INTRODUCTION
Base-paired secondary structure plays a fundamental role in the biological functions of nearly all RNAs. The best-characterized RNA structures are those formed by noncoding RNAs of 75 to ∼500 nucleotides (nt) and the RNA components of the ribosome. These RNAs represent an important, but small, fraction of the sequences and of the structural diversity present in a typical transcriptome. mRNAs and long noncoding RNAs (lncRNAs) likely form less well-defined structures than the short noncoding RNAs studied most intensively to date. Although challenging to study, mRNA structures are known to have significant effects on gene regulation by modulating transcription termination, translation initiation, translation rate, and RNA degradation (Hui et al. 2014; Mortimer et al. 2014; Wachter 2014; Meyer 2016). Structural analysis of lncRNAs is in its infancy, but it is already clear that these RNAs can have extensive, potentially functional structures (Novikova et al. 2012; Fang et al. 2015; Somarowthu et al. 2015; Smola et al. 2016).
A wide variety of chemical and enzymatic probing technologies allow structural characterization of RNA (Weeks 2010; Kwok et al. 2015). The recent development of the SHAPE-MaP strategy has enabled accurate structure probing of long RNAs based on an efficient and accurate readout by massively parallel sequencing (Siegfried et al. 2014; Smola et al. 2016). Structure models that incorporate information based on the predicted free energy of secondary structures and on chemical probing data can be generated using the algorithm SuperFold, which incorporates windowed folding based on the RNAstructure program (Reuter and Mathews 2010; Smola et al. 2015).
Exploring and visualizing structure models of long mRNAs and lncRNAs poses challenges for which we have not found efficient and workable tools. First, these RNAs are often intrinsically heterogeneous and include regions of well-defined base-pairing, regions without significant base-pairing, and regions that may sample multiple structures within an ensemble. Second, mRNAs and lncRNAs are often thousands of nucleotides in length, much longer than can be usefully visualized in existing RNA structure rendering software packages. Third, the volume of new RNA structure modeling data produced in current high-throughput studies makes it infeasible to manually edit and curate structural models. Fourth, RNA structure probing data would be best interpreted in a linear profile format (which current genome browsers do well) that simultaneously emphasizes base-pairing and through-space connections. Finally, structure models for long RNAs are often advantageously interpreted in the context of other information, including gene boundaries, trans-acting factor binding sites, functional annotations, conservation scores, and underlying chemical probing data.
The Integrative Genomics Viewer (IGV) is an open-source, well-supported, cross-platform desktop application that supports interactive exploration of genomic data sets (Robinson et al. 2011; Thorvaldsdóttir et al. 2013). Its speed, ease of browsing, and ability to compare multiple data sets from massively parallel sequencing studies make IGV a natural choice for integrating RNA structure modeling information. The wide user base and ongoing development of IGV ensures that RNA-specific modules should enjoy support for a significant future period. We report here the development of modules that illustrate RNA base-pairing as semicircular arcs (Nussinov et al. 1978) in the context of and aligned with chemical probing data and other linear genomic data tracks. IGV is able to rapidly change between views spanning thousands of nucleotides to zoomed-in views showing individual hairpins, base pairs, and nucleotides. Integration of these RNA-specific tools into IGV markedly facilitates analysis of large and complex RNA structure data sets, as shown here for exploration of viral RNA structure, for comparisons of in-cell and cell-free bacterial mRNA structure, and for noncoding RNA structure modeled using SHAPE data versus generated using sequence covariation analysis. These examples suggest that this tool will find wide utility in the RNA community.
RESULTS AND DISCUSSION
File formats and input data
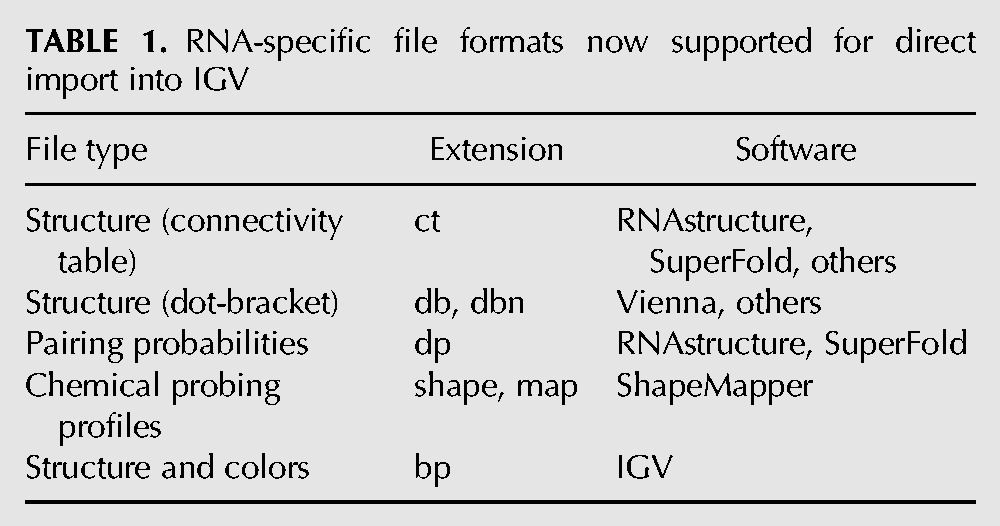
Based on this work, IGV now supports loading of base-pairing information from a text file format (*.bp) that describes base-paired regions and (optionally) per-base-pair colors, typically used to denote estimated pairing probabilities. The new .bp file format is documented at http://software.broadinstitute.org/software/igv/RNAsecStructure, and was implemented alongside existing support within IGV for loading base pairs from .bed files. IGV also now supports import of multiple popular base-pairing file formats (Table 1) including dot-bracket files, .ct files (produced by RNAstructure [Reuter and Mathews 2010]), and .dp files (containing the pairing probabilities calculated in RNAstructure and SuperFold [Smola et al. 2015]). IGV can now convert SHAPE reactivity files (.shape, .map) such as those output by ShapeMapper (Smola et al. 2015) to IGV-compatible .wig files.
TABLE 1.
RNA-specific file formats now supported for direct import into IGV
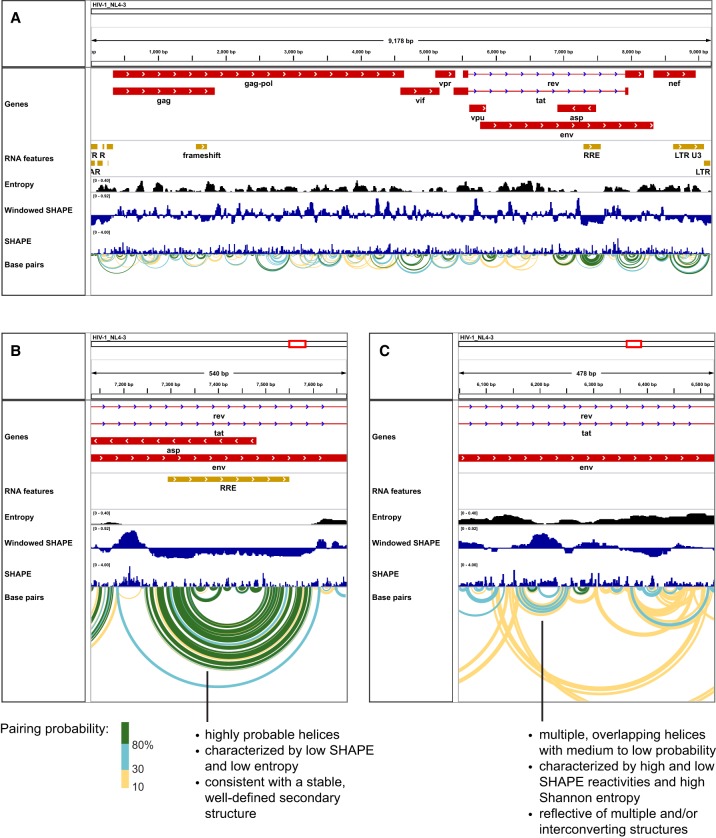
IGV readily displays a linear profile showing the amplitudes of SHAPE or other kinds of structure probing data as a function of nucleotide position. For larger RNAs, this view quickly becomes overwhelming, and showing SHAPE data as a windowed median is generally very helpful. IGV now supports a variety of useful ways to illustrate structures formed by large RNA sequences. In regions of large RNAs that appear to form well-defined structures, viewing a calculated minimum free energy structure is often a good choice. In contrast, other regions can be either conformationally dynamic or sample multiple distinct structures. For these regions, showing a single structure is likely a misleading oversimplification. Chemical probing data can be used to estimate the probabilities of all possible base pairs consistent with a given set of data and energy function. SuperFold (Smola et al. 2015) can generate these models using SHAPE-MaP data and a partition function approach using RNAstructure (Reuter and Mathews 2010). IGV is able to illustrate these models as colored arcs that indicate both which nucleotides can base pair and their estimated probability of pairing (Fig. 1), an approach similar to that used in several existing programs (Lai et al. 2012; Aalberts and Jannen 2013).
FIGURE 1.
IGV screen images illustrating exploration of RNA structure in an HIV-1 genome. (A) Overview of the entire ∼9200-nt genome. (B) Zoomed-in view of the highly structured ∼350-nt RRE and nearby regions. (C) View of a relatively unstructured region in the sequence encoding the env protein. Base-pair arcs are colored by estimated pairing probability (green, blue, and yellow: >80%, 30%, and 10%, respectively). Secondary structures and base pairing probabilities were generated with SuperFold (Smola et al. 2015). The maximum base-pairing distance was set to 600 nt; windowed SHAPE reactivities and (Shannon) entropies were computed as 55-nt windowed medians; and windowed SHAPE reactivities are plotted centered about the global median.
IGV display options
IGV supports display of a wide range of experimental and functional annotation data, visualized as stacked or overlaid horizontal tracks aligned to genomic coordinates. As described in independent publications, IGV has a fast and responsive interface that allows a user to quickly browse a data set at a number of scales (Robinson et al. 2011; Thorvaldsdóttir et al. 2013). A user can easily move the view by clicking and dragging in the main window, pressing the left or right arrow keys, or clicking a location on the genome/chromosome overview bar at the top of the window. The view can be zoomed by selecting a genomic range or pressing the “+” or “−” keys. Data tracks can be rearranged, rescaled, recolored, and overlaid by manipulating the track name on the left side of the window. RNA structure tracks can also be manipulated through the track menu, changing colors, setting direction (up or down), and enabling or disabling vertical scaling. Data tracks that are especially useful for examining alongside RNA structure include gene annotations, transcription start and end sites, raw chemical probing reactivities, smoothed probing data, base-pairing probabilities, and structural entropies (Fig. 1). Data generated from many kinds of RNA structure probing experiments can be incorporated and analyzed using the tools described here, including those based on SHAPE, DMS, and enzymatic methods. The examples provided here use SHAPE data, as this chemistry enables probing of nearly all nucleotides in an RNA and because frameworks for structure modeling and analysis based on SHAPE data have been especially well validated.
Examples
Visualizing RNA structure profiles across a large RNA
We used IGV to visualize SHAPE-MaP reactivity data, calculated entropies, and base-pairing probabilities for an entire HIV-1 RNA genome (Fig. 1A; Siegfried et al. 2014). By focusing on the windowed SHAPE track, it is apparent that some regions of the RNA genome, such as the 5′ and 3′ untranslated regions and specific internal regions, are much more highly structured (less reactive to SHAPE reagent) than others. For example, zooming in on the well-characterized Rev response element (RRE) reveals an extensive region with low SHAPE reactivity and many green base-pairing arcs indicative of high probability, thermodynamically favorable, low entropy structure (Fig. 1B). Conversely, moving to a region coding for a portion of the envelope protein (env) known to be poorly conserved and hypervariable, the SHAPE reactivity, entropy, and base-pairing probability profiles are quite different (Fig. 1C). In the env region, compared to the RRE, SHAPE reactivities and entropies are higher and base pairs are less probable (as illustrated with blue and yellow rather than green arcs), suggesting that no single RNA structure dominates.
Comparing RNA structure ensembles under different experimental conditions
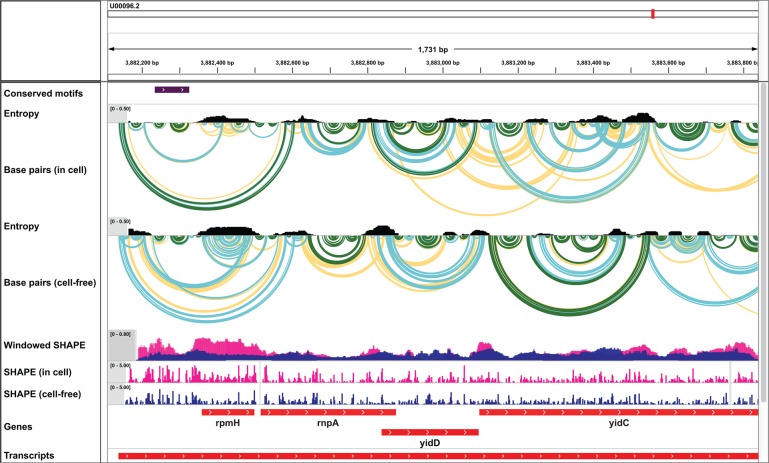
In a second example, we used IGV to explore structure models for a polycistronic bacterial mRNA probed under two different experimental conditions, in living E. coli cells and in a cell- and protein-free state (Fig. 2). Base-pair arcs are colored by estimated pairing probability and are shown aligned with the chemical probing data used to generate these models. Well-defined pairings (high pairing probability, green arcs) are apparent in the untranslated regions (UTRs) and in the coding regions for several genes.
FIGURE 2.
E. coli mRNA structure visualized under two experimental conditions: in-cell versus protein- and cell-free, using the 1M7 reagent that yields robust structure signals under in-cell and cell-free conditions (Tyrrell et al. 2013, McGinnis et al. 2015, Smola et al. 2015, 2016). IGV screen images are shown. Base pairs, SHAPE reactivities, and entropies are shown as in Figure 1.
Other regions appear more dynamic or are likely to exist in multiple structural conformations, as illustrated by overlapping yellow and blue arcs and high entropies, features suggestive of competing structures. One of these dynamic regions falls in the polycistronic rpmH transcript. The region encoding rpmH is much less structured in cells than in the cell-free state, as can be seen by comparing the two SHAPE reactivity profiles (Fig. 2). rpmH is a highly translated RNA and the markedly increased SHAPE reactivities in cells when compared to the protein-free state likely reflect disruption of RNA structure by translating ribosomes.
Examining conserved RNA structures
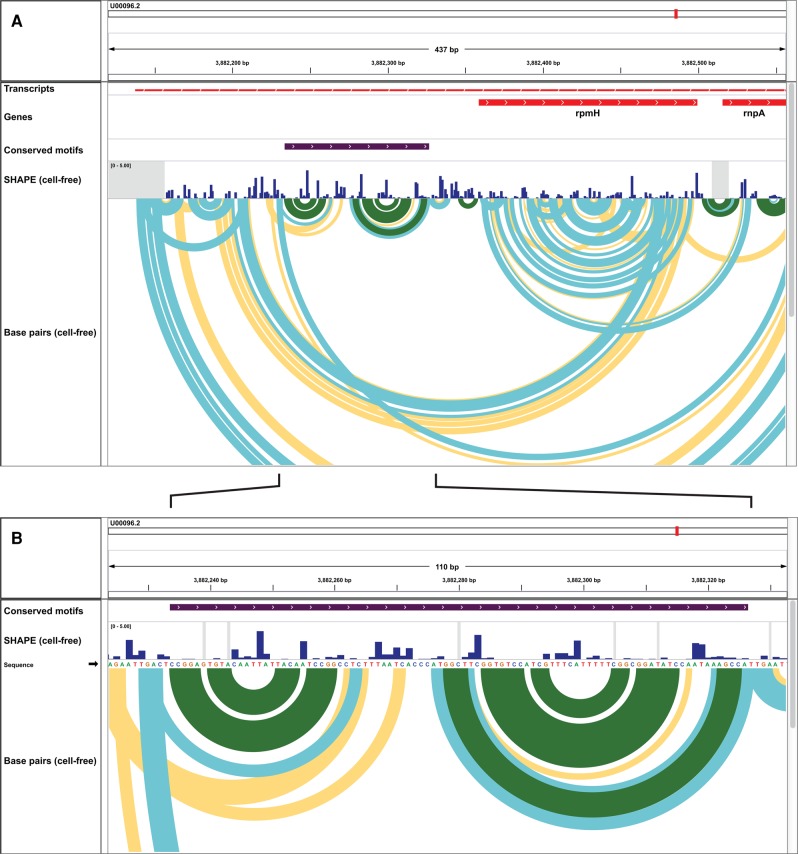
Two well-defined base-paired regions in the UTR upstream of rpmH show clear structural conservation across diverse enterobacteria (Fig. 2, highlighted with a purple bar in the Conserved motifs row). By using IGV to zoom and rearrange the data tracks, the contrast between the punctate reactivity pattern in the conserved UTR region and the diffuse reactivities within the region encoding rpmH is clearly apparent (Fig. 3A). Zooming in further reveals the close agreement between nucleotide-resolution experimental SHAPE reactivity data and modeled base-pairing. Highly reactive nucleotides are unpaired, and nucleotides with low reactivity are generally paired (Fig. 3B). In addition, at this scale, it is easy to identify individual base pairs in IGV. This view is especially helpful for identification of nucleotides that would be candidates for mutagenesis experiments in functional assays.
FIGURE 3.
Conserved structures in the untranslated region of the E. coli rpmH gene. (A) View spanning the 5′-UTR and first coding region. In this case, conserved structures (purple bar) are in a region predicted to be highly structured (low SHAPE reactivity) and well defined (low Shannon entropy). (B) Fully zoomed-in view of conserved structures in the untranslated region upstream of the rpmH gene. There is strong agreement between the measured SHAPE reactivity profile and the derived secondary structure model. Base pairs and SHAPE reactivities are shown as in Figure 1. Images shown are zoomed-in views based on Figure 2.
Comparing an experimentally derived structure with an external model
The RNA structure visualization tools make it straightforward to compare SHAPE data and experimentally constrained structure models with alternative models. For example, the E. coli 6S RNA (a highly expressed noncoding RNA) was modeled with SHAPE reactivity constraints and compared with base pairs inferred from sequence covariation as reported in the Rfam database (Fig. 4; Gardner et al. 2009). The SHAPE structure model and Rfam base pairs are in close agreement, although the Rfam model includes fewer base pairs than the SHAPE-directed structure. This is to be expected, since Rfam shows only those pairings that are supported by conservation and sequence covariation analyses. Comparison of the per-nucleotide chemical probing data with the SHAPE-constrained structure model reveals that the SHAPE-directed model is fully consistent with the experimental data (Fig. 4). This comparison suggests that the E. coli 6S RNA forms a greater number of base pairs than revealed by sequence covariation analysis alone.
FIGURE 4.
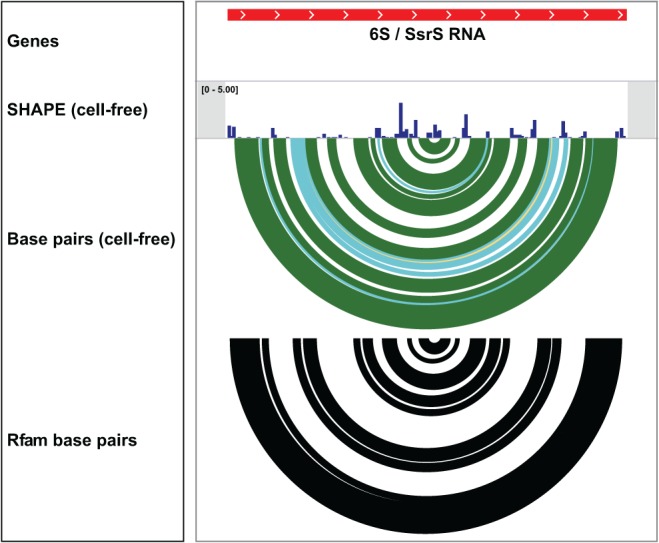
Comparison between IGV tracks illustrating a secondary structure model for the E. coli 6S RNA based on experimental SHAPE data versus a structure model from the Rfam database containing base pairs inferred using nucleotide conservation and covariation (Gardner et al. 2009). Note that, although the SHAPE-directed model includes a greater number of base pairs than included in the Rfam model, all base pairs in the SHAPE-informed model are consistent with the nucleotide-resolution chemical probing data.
Perspective
RNA structure probing is reaching the point at which it is possible to obtain nucleotide-resolution information for entire viral RNAs, mRNAs, and lncRNAs, and significant coverage of entire transcriptomes. In some cases, especially within the SHAPE-MaP framework as used both for cell-free RNAs and in living cells, the quality of these data for RNAs thousands of nucleotides long is comparable to that of focused studies of short RNAs as performed only a few years ago. A challenge is then how to understand and interpret this massive structural information on a per-RNA, per-functional domain, and even per-motif and per-nucleotide basis. The examples presented here show that the introduction of RNA structure-specific visualization tools into the well-supported IGV browser greatly facilitates analyses of diverse RNA systems, spanning focused studies of individual RNA motifs (Fig. 4) to large viral and lncRNAs (Fig. 1; Siegfried et al. 2014; Smola et al. 2016) to the contents of entire transcriptomes (Fig. 2). Structure visualization in IGV has proven to be especially helpful in data quality control, rapid hypothesis generation, and comparison with existing and orthogonal data. We anticipate that the ability to now integrate base-pairing and pairing-probability rendering with efficient visualization in genome browsers will facilitate and accelerate development of hypotheses for how RNA structure governs all areas of biology.
DATA DEPOSITION
IGV is written in Java and is freely available at https://www.broadinstitute.org/igv/. Documentation for newly supported file formats is available at http://software.broadinstitute.org/software/igv/RNAsecStructure and http://software.broadinstitute.org/software/igv/ChemProbing. In addition, Supplemental Material is available to facilitate exploration and use of the new RNA tools in IGV, including several example chemical probing profiles, RNA structure models, and usage instructions.
SUPPLEMENTAL MATERIAL
Supplemental material is available for this article.
Supplementary Material
ACKNOWLEDGMENTS
We thank J.T. Robinson for guidance and interactive assistance in integrating new RNA-focused modules into the IGV codebase, G.M. Rice and N.A. Siegfried for data sets and the development of SuperFold, and A.M. Mustoe for analysis of structural conservation. This work was supported by the National Institutes of Health, Office of Extramural Research (AI068462 and HG008133).
Footnotes
Article is online at http://www.rnajournal.org/cgi/doi/10.1261/rna.060194.116.
REFERENCES
- Aalberts DP, Jannen WK. 2013. Visualizing RNA base-pairing probabilities with RNAbow diagrams. RNA 19: 475–478. [DOI] [PMC free article] [PubMed] [Google Scholar]
- Fang R, Moss WN, Rutenberg-Schoenberg M, Simon MD. 2015. Probing Xist RNA structure in cells using targeted structure-seq. PLoS Genet 11: e1005668. [DOI] [PMC free article] [PubMed] [Google Scholar]
- Gardner PP, Daub J, Tate JG, Nawrocki EP, Kolbe DL, Lindgreen S, Wilkinson AC, Finn RD, Griffiths-Jones S, Eddy SR, et al. 2009. Rfam: updates to the RNA families database. Nucleic Acids Res 37: 136–140. [DOI] [PMC free article] [PubMed] [Google Scholar]
- Hui MP, Foley PL, Belasco JG. 2014. Messenger RNA degradation in bacterial cells. Annu Rev Genet 48: 537–559. [DOI] [PMC free article] [PubMed] [Google Scholar]
- Kwok CK, Tang Y, Assmann SM, Bevilacqua PC. 2015. The RNA structurome: transcriptome-wide structure probing with next-generation sequencing. Trends Biochem Sci 40: 221–232. [DOI] [PubMed] [Google Scholar]
- Lai D, Proctor JR, Zhu JY, Meyer IM. 2012. R-CHIE: a web server and R package for visualizing RNA secondary structures. Nucleic Acids Res 40: e95. [DOI] [PMC free article] [PubMed] [Google Scholar]
- McGinnis JL, Liu Q, Lavender CA, Devaraj A, McClory SP, Fredrick K, Weeks KM. 2015. In-cell SHAPE reveals that free 30S ribosome subunits are in the inactive state. Proc Natl Acad Sci 112: 2425–2430. [DOI] [PMC free article] [PubMed] [Google Scholar]
- Meyer MM. 2016. The role of mRNA structure in bacterial translational regulation. Wiley Interdiscip Rev RNA. doi: 10.1001/wrna.1370. [DOI] [PubMed] [Google Scholar]
- Mortimer SA, Kidwell MA, Doudna JA. 2014. Insights into RNA structure and function from genome-wide studies. Nat Rev Genet 15: 469–479. [DOI] [PubMed] [Google Scholar]
- Novikova IV, Hennelly SP, Sanbonmatsu KY. 2012. Structural architecture of the human long non-coding RNA, steroid receptor RNA activator. Nucleic Acids Res 40: 5034–5051. [DOI] [PMC free article] [PubMed] [Google Scholar]
- Nussinov R, Pieczenik G, Griggs JR, Kleitman DJ. 1978. Algorithms for loop matchings. SIAM J Appl Math 35: 68–82. [Google Scholar]
- Reuter JS, Mathews DH. 2010. RNAstructure: software for RNA secondary structure prediction and analysis. BMC Bioinformatics 11: 129. [DOI] [PMC free article] [PubMed] [Google Scholar]
- Robinson JT, Thorvaldsdóttir H, Winckler W, Guttman M, Lander ES, Getz G, Mesirov JP. 2011. Integrative genomics viewer. Nat Biotechnol 29: 24–26. [DOI] [PMC free article] [PubMed] [Google Scholar]
- Siegfried NA, Busan S, Rice GM, Nelson JA, Weeks KM. 2014. RNA motif discovery by SHAPE and mutational profiling (SHAPE-MaP). Nat Methods 11: 959–965. [DOI] [PMC free article] [PubMed] [Google Scholar]
- Smola MJ, Rice GM, Busan S, Siegfried NA, Weeks KM. 2015. Selective 2′-hydroxyl acylation analyzed by primer extension and mutational profiling (SHAPE-MaP) for direct, versatile and accurate RNA structure analysis. Nat Protoc 10: 1643–1669. [DOI] [PMC free article] [PubMed] [Google Scholar]
- Smola MJ, Christy TW, Inoue K, Nicholson CO, Friedersdorf M, Keene JD, Lee DM, Calabrese JM, Weeks KM. 2016. SHAPE reveals transcript-wide interactions, complex structural domains, and protein interactions across the Xist lncRNA in living cells. Proc Natl Acad Sci 113: 10322–10327. [DOI] [PMC free article] [PubMed] [Google Scholar]
- Somarowthu S, Legiewicz M, Chillón I, Marcia M, Liu F, Pyle AM. 2015. HOTAIR forms an intricate and modular secondary structure. Mol Cell 58: 353–361. [DOI] [PMC free article] [PubMed] [Google Scholar]
- Thorvaldsdóttir H, Robinson JT, Mesirov JP. 2013. Integrative Genomics Viewer (IGV): high-performance genomics data visualization and exploration. Brief Bioinform 14: 178–192. [DOI] [PMC free article] [PubMed] [Google Scholar]
- Tyrrell J, McGinnis JL, Weeks KM, Pielak GJ. 2013. The cellular environment stabilizes adenine riboswitch RNA structure. Biochemistry 52: 8777–8785. [DOI] [PMC free article] [PubMed] [Google Scholar]
- Wachter A. 2014. Gene regulation by structured mRNA elements. Trends Genet 30: 172–181. [DOI] [PubMed] [Google Scholar]
- Weeks KM. 2010. Advances in RNA secondary and tertiary structure analysis by chemical probing. Curr Opin Struct Biol 20: 295–304. [DOI] [PMC free article] [PubMed] [Google Scholar]
Associated Data
This section collects any data citations, data availability statements, or supplementary materials included in this article.


