

Abstract
The solid concentration of pulmonary mucus (wt%) is critical to respiratory health. In patients with respiratory disease, such as Cystic Fibrosis (CF) and Chronic Obstructive Pulmonary Disorder (COPD), mucus hydration is impaired, resulting in high wt%. Mucus with high wt% is a hallmark of pulmonary disease that leads to obstructed airways, inflammation, and infection. Methods to measure mucus hydration in situ and in real-time are needed for drug development and personalized therapy. We employed plasmonic gold nanorod (GNR) biosensors that intermittently collide with macromolecules comprising the mucus mesh as they self-diffuse, such that GNR translational diffusion (DT) is sensitive to wt%. GNRs are attractive candidates for bioprobes due to their anisotropic optical scattering that makes them easily distinguishable from native tissue using polarization-sensitive OCT. Using principles of heterodyne dynamic light scattering, we developed diffusion-sensitive optical coherence tomography (DS-OCT) to spatially-resolve changing DT in real-time. DS-OCT enables, for the first time, direct monitoring of changes in nanoparticle diffusion rates that are sensitive to nanoporosity with spatial and temporal resolutions of 4.7 μm and 0.2 s. DS-OCT therefore enables us to measure spatially-resolved changes in mucus wt% over time. In this study, we demonstrate the applicability of DS-OCT on well-differentiated primary human bronchial epithelial cells during a clinical mucus-hydrating therapy, hypertonic saline treatment (HST), to reveal, for the first time, mucus mixing, cellular secretions, and mucus hydration on the micrometer scale that translate to long-term therapeutic effects.
Graphical abstract
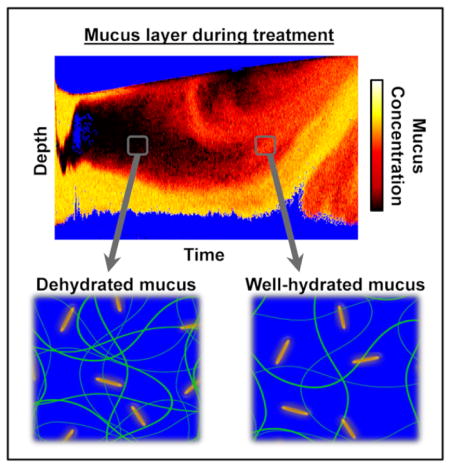
Diffusion-sensitive OCT monitors gold nanorod diffusion to spatially resolve mucus hydration during mucus thinning treatments for respiratory disease.
Introduction
The airway epithelium is coated with a biopolymeric mucus gel which is responsible for trapping inhaled environmental contaminants that are subsequently removed by mucociliary clearance (MCC)2. MCC is disrupted under high mucus wt%, causing mucus stagnation, chronic infection and inflammation2–5. Normal mucus hydration by the epithelium is impaired in CF and COPD resulting in high mucus wt% that leads to halted MCC4. HST is a therapeutic approach to reduce mucus wt% for sustained MCC6 that has gained popularity due to its relative safety, easy administration, and low cost7, 8. However, patient to patient variability9, conflicting therapeutic results10, and modest global daily improvements7 in HST suggest the need for better outcome metrics to predict treatment efficacy, aid in the development of improved drug therapies, and enhance precision medicine approaches. Current therapeutic outcome measures are invasive, time consuming, and may suffer from bias11. By directly monitoring mucus wt% changes in real-time during treatment we may develop more accurate, rapid and reliable outcome measures. OCT is a promising technology toward this end, as it has already proven useful for studying MCC-related metrics including cilia-driven flow rates12, 13, collapse of cilia under a mucus load14, and ciliary beat frequency13, 15, with recent developments toward in vivo measurements16. Here, we introduce DS-OCT for non-invasive quantification of mucus wt% in situ on epithelium and in real-time during mucus-hydrating therapy.
Current methods for quantifying mucus wt% in vitro are based upon the constrained diffusion of probe particles within the mucus gel17, where increased diffusion rate corresponds to decreased mucus wt%. However, methods such as particle tracking rheology1 require long measurement times to average 100’s to 1,000’s of particle tracks to suppress noise from the stochastic diffusion process. In comparison, low coherence interferometry (LCI) can be used to measure the ensemble-averaged diffusion rate of multiple microparticles within each coherence volume via dynamic light scattering techniques18. Spectral-domain OCT, which uses the principle of LCI, has been employed to image microparticle diffusion in solution within a 2D cross-section19. However, measurement times are >1 s and microparticles are difficult to distinguish within the optically turbid mucus that exhibits a strong OCT signal13. Thus, current methods lack feasibility for assessing mucus wt%, particularly in the presence of physiological motion such as MCC, limiting their clinical applications. In contrast, DS-OCT uses dynamic light scattering with LCI to provide rapid (< 0.2 s) and depth-resolved (4.7 μm) diffusion measurements of gold nanorods (GNRs). Measurement time is reduced by merit of the smaller size of GNRs and correspondingly more rapid dynamic light scattering signal in comparison to microparticles, in addition to greater ensemble averaging (10–100 GNRs per coherence volume)20. Additionally, polarized OCT signals from GNRs are easily distinguishable from those of mucus by their shape-dependent optical anisotropy, which we have tuned to exhibit longitudinal and transverse surface plasmon resonances inside and outside of the OCT system wavelength bandwidth (740–860 nm), respectively. These small GNRs are designed to be weakly-constrained by biopolymeric media, intermittently colliding with macromolecules, with diffusion rates inversely proportional to mucus wt%21, 22. Based upon these principles, here, we introduce DS-OCT for quantitative imaging of mucus wt% as it changes during saline treatment on well-differentiated cultures of human bronchial epithelial cells (HBEC). DS-OCT reveals the depth- and temporally-resolved changes in mucus wt% during clinically-relevant saline treatments on HBEC that have not been previously observed. Furthermore, DS-OCT constitutes the first method, to our knowledge, of measuring dynamic changes in nanoparticle diffusion rates in real-time.
Methods
Human bronchial epithelial cell cultures (HBEC) for saline treatment studies
As a platform for studying mucus hydration therapies, we employed air-liquid interface (ALI) human bronchial epithelial cell culture (HBEC) models that exhibited mucociliary transport23–25. Well-differentiated HBEC were cultured on collagen-coated permeable supports (Corning Inc.; Corning, NY) under ALI conditions, as previously described26, 27. Each experiment was repeated in at least three HBEC specimens. Human airway cells were cultured from excess tissue obtained from more than three independent normal donors, according to the guidelines of the Institutional Review Board for Protection of Human Rights at the University of North Carolina at Chapel Hill.
For all the experiments, HBEC were maintained for 7 days in a regimen that did not disturb (wash) the culture lumen, to allow for maximal lumenal mucus accumulation. In these conditions, neither ciliary beating nor MCC were observed using regular microscopy. For the HH-OCT imaging experiments, culture inserts were placed on a Hank’s buffered saline solution with 1.6 mM calcium, 1.8 mM magnesium, and 25 mM HEPES (pH=7.4) (HBSS) (basolateral bath) at ~37°C. The saline treatments were initiated by adding 10 μL of hypertonic saline (HS) or isotonic saline (IS) onto the mucus layer of the culture. In these experiments, all the cultures were positioned at a ~5–10° angle with the imaging beam centered in y and ~1.5 mm from the well wall in x, and saline solution was deposited on a similar location in all specimens.
For DS-OCT studies, three samples were chosen to represent each condition in order to achieve a statistical power of 0.8, as seen in similar HBEC studies using triplicate cultures. GNRs with dimensions of 87±9 × 26±5 nm, coated with 2 kDa PEG were utilized, and tested for low adherence before experiments in HBEC. To load the mucus layer, GNRs (108 per μL) were administered in a 10 μL bolus of sterile PBS, >6 hrs before the experiment. Our experience and confocal microscopy data indicates that within 2 hrs the bolus is completely absorbed by the epithelium and the GNRs are homogeneously dispersed in the mucus layer. For DS-OCT imaging, cultures were placed in HBSS at ~ 37 °C and positioned as described for HH-OCT experiments. The saline treatments were initiated by adding 10 μL saline (HS or IS) bolus containing GNRs (108 GNRs/μL) during OCT imaging acquisition as indicated in the figures.
The rates of layer height changes were calculated by measuring layer heights from the bottom of the culture support to the top of the bolus in the same location at two time points, 4 min apart. For HH-OCT studies, measurements were made at the dotted line. These rates were reported for n=1 specimen for HS and IS each (Figs. 2a and 2b). For DS-OCT studies, heights were measured from the DS-OCT images directly. These rates with their standard deviations were calculated from n=3 specimens for HS and IS each (Figs. 3 and 4).
Fig. 2.

Timelapse imaging of saline treatments. HH-OCT images before, at t=0 min, and t=4.5 min of IS (a) and HS (b) treatments. Images were collected near the edge of the cell culture, with closed arrowheads indicating the meniscus produced by the cells growing against the plastic wall of the culture support. Stealth arrowheads indicate mucus that has peeled away from the cell layer upon saline treatment. The white arrows point to some of the regions void of HH-OCT signal just above the cell layer, suggestive of rapid cellular/paracellular fluid secretions. The dotted line indicates the location of layer height measurements used to calculate the rate of height changes; the position of the dotted line is equivalent in all specimens. (c) Enlarged image from ROI (dotted orange box) showing features of the HBEC specimen after 4.5 min HST. Note: The apparent bend in the sample support is an optical effect caused by the change in optical path length of light for different layer heights across x. Each specimen was stationary throughout the experiment.
Fig. 3.

Dynamic DS-OCT and HH/HV-OCT imaging during IS treatment over 5 min with the start of treatment indicated by the closed arrowhead. (a) Depth- and temporally-resolved DS-OCT images showing the change in mucus wt% over time in 3 different HBEC specimens, displayed using a hot color map, with well-hydrated mucus (typically <2%1, 2, as observed in healthy lungs) represented by white-orange, while concentrated mucus (>2%) is represented by red-black. (b) Depth and temporally resolved HH/HV-OCT images showing the changes in co- and cross-polarized light scattering using red (HH) and green (HV) color scales to discriminate features that scatter only co-polarized light (cells and mucus) from those that scatter both co- and cross-polarized light (GNRs and cell culture support). High HH and HV signals (bright yellow pixels) indicate high concentrations of GNRs. High HH and low HV signals (red pixels) indicate cells or mucus void of GNRs. The overall reduced intensities in depth are due to optical attenuation, as demonstrated in Fig. S4†, where attenuation was observed in mucus with homogenous GNR concentrations. (c) Enlarged ROI (orange dotted box) with a larger aspect ratio and increased brightness to illustrate features of the HBEC specimen used in the IS treatment. White arrow: Layer of mucus (red/black) peeled from cell layer at the beginning of treatment (black box inset shows this effect magnified in specimen 3). Stealth arrowhead: region comparing high wt% in DS-OCT with high concentrations of GNRs in HV-OCT. Black arrows: Transition from a time point with a low wt% mucus layer (closed circle, yellow pixels) to later time points with higher mucus wt% (arrow head, orange/red pixels) over time. Note: The bend apparent at the bottom of each specimen is due to the change in optical path length of light as the layer height changes through time. Each specimen was stationary throughout the experiment.
Fig. 4.

Dynamic DS-OCT and HH/HV-OCT imaging during HS treatment over 5 min with the start of treatment indicated by the closed arrowhead. (a) Depth- and temporally-resolved DS-OCT images showing the change in wt% over time in 3 separate HBEC. (b) Depth and temporally resolved HH/HV-OCT images showing the change in HH (red) and HV (green) intensities over time. Low HH and HV signal intensities (black pixels) seen throughout the mucus layer indicate regions of newly secreted fluid that lack mucus and GNRs (c) Enlarged ROI (orange dotted box) with a larger aspect ratio and increased brightness to illustrate features of the HBEC specimen used in the HS treatments. White arrows: Layer of mucus (red) peeled from cell layer at the beginning of treatment (black box shows this magnified for specimen 2 and 3). Stealth arrowheads: region comparing high wt% in DS-OCT with low concentrations of GNRs in HV-OCT. Asterisks: Region void of DS-OCT and HH-OCT, and HV-OCT signal, indicating fluid secretion stimulated by HS.
MCTD models for measuring wt% during mucus transport
For MCC studies, a modified HBEC system was used. The cells were cultured on mucociliary transport devices (MCTD) forming a circular track with a 15 mm inner diameter and 23 mm outer diameter, as we previously described25. The MCTD model allowed for continuous and consistent mucociliary transport, and was used to determine the effect of mucociliary transport on wt% measurements via DS-OCT. For the OCT studies, the MCTD was washed with 1× DPBS prior to imaging. High concentration pulmonary mucus (>4%), harvested from primary HBEC as previously described1, 28, was diluted with 1× DPBS containing GNRs (85±6 × 24±2 nm) with a 800 Da PEG coating to a target GNR concertation of 6.8×10⁷ GNRs/μL and wt% varied from 1.5–3.5%. MCDTs were incubated for at least 20 min between each imaging session.
After measuring DT,avg in the stationary mucus (described in detail below), a ~50 μL Mucus was allowed to settle on the transporting track for ~1 min before commencing DS-OCT imaging, with measurements (n≥3 images and n>100 independent DT measurements of the same aliquot), taken within 10 min of bolus deposition. The MCDT was washed twice with PBS after each sample was imaged, with the process repeated for each wt%. Transport was observed via microscopy before all experiments, and then monitored visually by observing the movement of the bolus along the track during the experiments.
OCT System
A high-resolution, spectral domain, polarization sensitive OCT system (Fig. S1†) was used for all imaging experiments. This system consists of a Ti:Sapphire laser with a central wavelength (λ0) of 800 nm, bandwidth (Δλ) of 120 nm, and measured axial vs. transverse in-water resolution of 3×10 μm. PS-OCT, comprised of a Michelson interferometer, applies horizontally polarized light to the sample and collects both vertical and horizontal polarization states of light scattered from the sample. The H+V scattered light is recombined with a reference beam containing equal parts H and V polarization states. This beam is then demultiplexed using a polarizing beam splitter at the output of the interferometer. The HH (co-polarized, horizontal in and horizontal out) and HV (cross-polarized, horizontal in and vertical out) signals are collected using a custom built spectrometer. The spectral components are dispersed using a 600 lines/mm diffraction grating before being simultaneously imaged onto a 4096-pixel linescan camera operated at 25kHz (HH and HV collected on the first and second half of the camera, respectively). Complex analytical signals S̃HH(z) and S̃HV(z) were converted from the spectral interferograms recorded by the camera using a previously established method of digital dispersion compensation29.
For time-lapse OCT, B-mode OCT images were collected into 1000×1024 pixels (x vs. z) into 3×1.5 mm, respectively. 600 image frames were collected over 300 seconds at 2 frames/s. Each image was post-processed to adjust the contrast, and to display the true aspect ratio. These images were stitched into an MPEG-4 video using Matlab, shown at 10× actual speed. For measurements of GNR diffusion, M-mode images (z vs. t) were collected by fixing the scanning beam in one location and collecting 4000 or 12000 A-scans in a single location at a rate of 25 kHz, to create 4000×4096 (DS-OCT) or 12000×4096 (DT,avg vs. wt%) spectral interferograms. For DS-OCT, 600 M-mode images were collected at time intervals of 0.5 s over 5 min. M-mode data was processed as described below to quantify GNR diffusion. For the corresponding HH/HV-OCT, the time-average of |S̃HH(z)| and |S̃HV(z)| from each of the 600 M-mode images were computed as a function of depth. The HH/HV-OCT images were displayed as RGB images, with HH assigned to the red channel, HV assigned to the green channel, and the blue channel set to 0. In order to enhance visualization, the intensities were contrasted, with min-max values set from 100 to 2000 for HH and 100 to 1500 for HV.
GNRs
GNRs exhibit Brownian motion that is hindered in the presence of macromolecules comprising mucus, such that the diffusion rate decreases with increased mucus concentration. Because of this, GNR diffusion can used to quantify the hydration state of mucus during active transport on an MCDT and during saline treatments on HBEC. GNRs used in this study were prepared as previously described30. They were conjugated with polyethylene glycol (800 or 2000 Da molecular weight, Sigma Aldrich, St. Louis, MO) to prevent muco-adhesion and cellular uptake. ImageJ software was used to measure the dimensions of GNRs from the TEM images. The hydrodynamic radius of the GNRs, including the PEG thickness (0.5 nm), was estimated to be ~28nm using the following equation21:
| (1) |
where RH is the hydrodynamic radius, L is the total length of the GNR, and w is the total width of the GNR. The extinction spectrum in Fig. S2† shows a longitudinal surface plasmon resonance peak, λSPR, of the GNRs is centered around 800 nm. A second, transverse, SPR centered at ~500 nm, sits outside the detection range of our OCT system. This results in a scattering cross-section that is ~1600× greater when the long-axis of the nanorod is aligned parallel, rather than orthogonal, to the direction of input light polarization. This property results in a unique optical anisotropy in the signal scattered by the GNRs that is used to discriminate against that of other scatterers in the sample, as described in greater detail in the DS-OCT Imaging section.
Determining mucus wt% from GNR diffusion
Mucus wt% measurements were derived from GNR diffusion rates. DT was computed from M-mode OCT data as follows. The real and imaginary components from these images were defined from the complex signals. Operating on the real and imaginary components of S̃HH(tM,z) and S̃HV(tM,z), where tM is the time, and z is the depth of the M-mode image, the time-average at each depth was subtracted from the data. Next, the temporal autocorrelation of these signals was calculated at each depth. Each autocorrelation was then averaged across three adjacent values of z. The autocorrelations were then normalized and the real and imaginary autocorrelations were averaged. From DLS theory, we use previously reported expressions21 relating the translational and rotational GNR diffusion rates to the normalized autocorrelations of S̃HH(tM,z) and S̃HV(tM,z) as follows:
| (2) |
and
| (3) |
where q=4πn/λ0 (with n being the refractive index of the medium), τ is the delay time, DR and DT are the rotational and translational self-diffusion coefficients, respectively, and and are the normalized autocorrelations related to first-order photon statistics for co- and cross-polarized light fluctuations, respectively. A linear combination of and defines an isotropic autocorrelation, , that depends upon DT only as follows:
| (4) |
and therefore,
| (5) |
Next, a least squares fitting to was performed over the range of delay times from Δτ to τ1/e. This fitting was used to find τ1/e, which was rejected if its standard error of measurement deviated by >25% of τ1/e. τ1/e was then used to calculate DT according to DT = −1/q2τ1/e
GNR diffusion measurements were first collected in stationary mucus from 1–3.5% (with 1% wt% solids equal to saline, in which the GNR diffusion rate is the same as that in water, i.e. 0%). DT,avg ± DT,σ for stationary mucus reported in Fig. 1 represents across n≥95 spatially-resolved DT measurements within each sample. In order to relate DT to wt% of mucus, a calibration curve was fitted to DT,avg versus mucus wt% in stationary mucus. DT,avg used to calculate this curve included measurements in 3 samples of mucus previously reported21 and new measurements reported in Fig. 1, totaling n=4 different batches of stationary mucus at each concentration used to establish the calibration. Data was fit to a third-order polynomial which was found to be:
| (6) |
with R2=0.998.
Fig. 1.

Spatially-averaged GNR diffusion (DT,avg) and standard deviation (DT,σ) measurements in HBEC mucus of known solids concentration (wt%). (a) DT,avg ± DT,σ in stationary and transporting mucus, with 1.0 wt% representing pure saline. The calibration curve represents a third order polynomial fit to the stationary mucus data (R2=0.998), and is highly consistent with the transporting mucus data. (b) Normalized isotropic autocorrelations of representative data for transporting mucus. The corresponding best-fit lines represent inverse exponential fits to the data for gISO > 1/e. (c) B-mode (x × z) and M-mode (t × z) HH- and HV-OCT images of 2.5 wt% mucus during transport on MCTD. The overlaid HH/HV-OCT image aids in visualization of each layer of the MCTD specimen. M-mode images show the change in intensity at the dotted white line over 480 μs. (d) TEM of GNRs.
DS-OCT imaging
Each pixel in the DS-OCT image represents the spatially (z) and temporally (t) resolved wt% derived from DT, which was computed from , as follows:
| (7) |
where q=4πn/λ0, DT(t,z) is the translational GNR diffusion at each depth (z), DS-OCT time (t) is the time after IS or HS treatment, and g(τ; t, z) represents the autocorrelation averaged over 3 depths. DS-OCT image depths were 600 μm with increments of 4.7 μm. Total DS-OCT collection times were 5 min, with time increments of 0.5 s. We note that time increments can be reduced to >0.2 s, but we found the 2 Hz collection rate to be sufficient to monitor mucus dynamics that change on the ~1 s time scales.
A set of tests were employed in data processing to ensure all DS-OCT values represent that of true diffusion rates of GNRs and not fluctuations seen from other scatterers, like mucus or cells. Then, signals were rejected if they failed the following tests22:
| (8) |
and,
| (9) |
where f is the A-line sampling rate, nA is the number of A-lines in the M-mode image, and τISO and τHV are the isotropic and cross-polarized normalized autocorrelation 1/e decay constants, respectively. Monte Carlo simulations (see Supplementary data) were used to estimate the accuracy of τ measurements as a function of sampling time within the window established in Eq. 8. The test in Eq. 9 ensures the decorrelation time of the OCT signal due to the translational motion of the rods is at least 5× greater than the decorrelation time due to the rotational motion of the rods. This anisotropy in decay times is unique to GNRs used in this study. Because GNRs are much smaller than the wavelength of incident light (L≪λ0), the rotational diffusion of the GNRs is dominant, and a difference in the decay times is seen with GNRs as compared to other scatterers where L~λ0 and translational diffusion dominates. Fig. S3† shows a histogram of the ratio τISO/τHV seen in mucus without GNRs vs. mucus containing GNRs (2.5% solids). We expect that because rotational GNR diffusion is much faster than that of translational diffusion, the ratio of τISO/τHV should be ~921, which we found to be true here. In order to capture the GNR signals while rejecting signals from other light scatterers within the mucus, we chose a cutoff value of 5. Lastly, we employed a test to reject any DS-OCT signal whose average HV-OCT intensity value was greater than that of the noise in the system, where noise was defined as the 95th percentile intensity in the region of air above the sample in the image. For these DS-OCT images, a ‘hot’ color map was used to display wt%, while pixels were assigned to blue if they failed any of the above DS-OCT signal tests.
Results
GNR diffusion is sensitive to mucus wt% in both ex vivo stationary and in vitro transporting mucus
First, we calibrated the relationship between GNR diffusion rates and mucus concentrations. DS-OCT was used to measure spatially-averaged translational diffusion coefficients, DT,avg, in ex vivo samples of static HBEC mucus1, 28 at varying percent solid dry weights, wt% (Fig. 1A). We found that DT,avg was inversely proportional to mucus wt%. Because GNRs are small compared to mucus mesh size (~85×25 nm GNR dimensions vs. 0.2–1 μm diameter pores in 2.5% mucus31), we expect that the GNRs are weakly constrained, and thus, their self-diffusion is sensitive to polymer pore sizes that are expected to decrease with increasing wt%. Temporal intensity autocorrelations of light scattered by GNRs in mucus (Fig. 1b) were used to calculate DT (see Methods). We found that over a broad range of mucus concentrations, these autocorrelations are highly consistent with a single inverse exponential model for delay times less than the decorrelation time, τ1/e. These results support the hypothesis that GNRs are primarily weakly constrained by the mucus medium21. However, for mucus wt% ≥2.5 the autocorrelations became slightly larger than that of the model at delay times >τ1/e, suggesting that a subpopulation of GNRs may have been strongly constrained by the mucus. Despite this, we found that fitting the data to a single exponential for 0<τ<τ1/e resulted in R2>0.99 for all wt%, suggesting that the weakly-constrained model was sufficient for quantifying GNR diffusion over the entire range of mucus concentrations. We then established a calibration curve based on DT,avg versus wt% in stationary mucus, which was used in the subsequent studies to infer wt% from GNR diffusion measurements, enabling direct imaging of quantified mucus wt%.
Next, we validated the quantification of wt% in the presence of MCC-driven motion using GNR-loaded mucus in HBEC cultured as a mucociliary transport device (MCTD) (see Methods). An example of this mucociliary transport can be viewed in a co-polarized (HH) OCT video (Vid. S1†) with the MCTD model transporting endogenous mucus (without GNRs). For DS-OCT measurements, exogenous HBEC mucus of different wt% was premixed with GNRs before being topically deposited onto the MCTD model; mucociliary transport was confirmed before imaging. We found that DT,avg is similar for transporting and stationary mucus (Fig. 1a), with the transporting data fitting the calibration curve with an R2=0.948. This result is consistent with our expectation that DT,avg should not be influenced by mucus transport (velocity of 1–2 mm/min) due to the short distance traversed by the mucus (~50 nm) in the time it takes for GNR light scattering signals to decorrelate (<2 ms, shown in Fig. 1b) compared to the in-water transverse resolution of the OCT system (10 μm). Importantly, this demonstrates that wt% measurements based upon DT are robust against physiologically relevant mucociliary transport.
In order to visualize the features of the HBEC air-liquid interface (ALI), B-mode HH-OCT (co-polarized, red) and HV-OCT (cross-polarized, green) were overlaid (Fig. 1c). HH and HV light scattering and the M-mode intensity fluctuations aided in discriminating between the specimen layers. Because GNRs and the support scattered both co- and cross-polarized light, both HH- and HV-OCT images exhibited high signals in these layers. Due to their size, GNRs are not predicted to penetrate the periciliary layer2; the cell layer only exhibits signals in HH-OCT suggesting it is optically isotropic in backscattering, and thus, the absence of HV signals when adding GNRs is consistent with this prediction. In this way, the HH/HV-OCT overlay allows one to discriminate between the GNR-loaded mucus and the cell layer. The corresponding M-mode images show depth-resolved intensity fluctuations at one random transverse location (dotted white line) over time (~500μs). Although both GNRs and the support scattered cross-polarized light, the stationary support appears as a constant streak through time, while fluctuations from diffusing GNRs appear as dotted lines. These time- and polarization-dependent characteristics were used to develop quantitative tests to discriminate pixels containing diffusing GNRs in DS-OCT imaging, as described in Methods.
Time-lapse OCT reveals mucus dynamics during isotonic and hypertonic saline treatments
We next used standard HH-OCT imaging to monitor, in real-time, the effect of clinically relevant saline treatments on HBEC. Figure 2 shows HH-OCT images of the effects of isotonic saline (IS) and hypertonic saline (HS) on HBEC with concentrated endogenous mucus not loaded with GNRs. These cultures did not exhibit ciliary beating due to luminal mucus accumulation (see methods). The images are frames from time-lapse videos (see Vids. S2† and S3†) showing the cell culture before the deposition of saline, at saline deposition, and 4.5 min after deposition.
IS (0.9% NaCl) was used as the control for the HS treatment (Fig. 2A and Vid. S2†). Immediately after IS deposition, a layer of mucus appears to have been lifted to the top surface of the IS bolus (stealth arrowhead). HH-OCT was able to capture a cross-sectional view of this effect that previous investigators have not seen using confocal microscopy32. After 4.5 min, the overall cross-sectional area of the fluid bolus decreased, with the height from the membrane to the surface, measured at the dotted lines, being reduced at a rate of −34 μm/min. The closed arrowhead shows a region of mucus that had been lifted from the meniscus at t=0 min, and floating on the surface (stealth arrowhead). However, at 4.5 min, this same region shows that the mucus had settled back down. These observations suggest that the epithelial cells rapidly absorbed the IS, which may result in negligible long-term changes in mucus wt%, although wt% changes cannot be quantified by HH-OCT.
In contrast, the same volume of HS (7% NaCl) elicited a response on HBEC indicative of long-term mucus hydration treatment (Fig. 2b and Vid. S3†). First, the mucus layer height increased at a rate of 12.4 μm/min, rather than decreased as seen with IS, which is likely a response to the osmotic pressure gradient imposed by HS7, 33. Osmotic pressure gradients cause water to be transported by the epithelium from the basolateral compartment to reach isotonicity in the apical compartment7, 34. Second, HST initially lifted the mucus from the cell layer, also seen with IS, where it floated on top of the bolus (stealth arrow). But unlike IS treatment, the mucus flowed in an apparent circular motion, forming swirls upon hitting the culture wall. This effect, a hallmark of HST in our experiments, was never observed with IS, and is best appreciated in video (Vid. S3†). The swirls suggested increased mucus flow and enhanced MCC. Third, HS treatment exhibited gaps of low OCT signal just above the cell layer after 4.5 min (arrows), further suggesting rapid input of water (low signal), which would result in untethering of mucus from epithelial cells, further suggesting increased MCC, since tethered mucus has been shown to inhibit MCC35. Altogether, these results suggest HST may lead to sustained MCC. However, direct wt% measurements are needed to confirm mixing and lifting of high wt% mucus, which are described in the next section.
Quantification of mucus wt% to assess effectiveness of saline treatments
Next, we use DS-OCT to quantify wt% during IS and HS treatment, which cannot be captured by standard OCT imaging. Our DS-OCT technique can resolve wt% in time and space across the mucus layer to reveal wt% heterogeneity that is a feature of diseased airways36, 37. We used the calibration curve established in Figure 1a to quantify mucus wt% from measurements of the translational GNR diffusion rate (DT). Since GNR diffusion is sensitive to the pore size of the mucus mesh, DT increases as pore sizes increase during mucus hydration. Because DS-OCT measurements are rapid (<0.2 sec) and depth-resolved (resolution of 4.7 μm), we can monitor the evolution and heterogeneity of mucus wt% throughout the mucus layer on HBEC during saline treatment. For these DS-OCT studies, HBEC were incubated with GNRs for >6hs to allow the GNRs to defuse evenly throughout the mucus layer. IS and HS were similarly pre-mixed with GNRs to avoid GNR concentration gradients during experiments. It is important to note that depth-dependent effects in OCT imaging, including attenuation and multiple scattering, cause a depth-dependent bias in HH-, and HV-OCT measurements, but do not affect the resulting DS-OCT measurements. These effects can be seen in Fig. S4†, where DS-OCT in homogeneous, stationary mucus with wt% of 1.5, 2.0, and 2.5 exhibited no bias in wt% measurements over a depth of ~400 μm.
Figure 3 shows three independent DS-OCT experiments in HBEC treated with IS. Before IS treatment, no DS-OCT signal is seen. As has been demonstrated previously36, allowing mucus to accumulate on HBEC results in high wt%, which will strongly constrain GNR diffusion and result in a failed DS-OCT signal. Upon IS treatment, for 10–20 s, the height of the bolus decreased rapidly for specimens 1 and 3, and increased for specimen 2. This is likely due to the 10 μL bolus spreading to different regions immediately after deposition. These rates then stabilized, with the layer height in all samples decreasing at a rate of −9.0±2.1μm/min. Interestingly, this rate of decrease was an order of magnitude faster than previously reported38, which suggests we observed immediate changes in layer height that are different from long-term observations over the course of hours. In all specimens, high wt% mucus (red pixels) was lifted to the surface of the mucus layer directly after the initialization of treatment (white arrows). Next, two main effects are observed. First, the overall concentration of mucus homogenizes over time (black arrows), with the layer containing mostly low wt% mucus (closed circle) to time points where the layer contained mostly high-wt% mucus (black arrowhead). Second, regional decreases in mucus wt% were seen. For example, in specimen 1, a region of mucus with wt% ≃4 (black pixels) at t=1 min spreads throughout the entire layer by t=3min, with wt% ranging from 2–4 (red to black pixels) over all depths by the final time point.
A regional decrease in wt% is also seen in specimen 2, with blue pixels observed at t=20–30 s. These blue pixels are a result of one or more failed DS-OCT tests (see Methods). The corresponding location in the HH/HV-OCT image shows low HV-OCT scattering (dark red pixels). In combination, these observations suggest a region with a low density of GNRs and high wt% mucus. An interpretation is that this region had poor GNR pre-loading due to the endogenous mucus being highly concentrated, with mesh sizes so small that GNRs were prevented from entering. Then, once the IS bolus is added, GNRs were able to penetrate the mucus mesh and the DS-OCT signal appeared. High mucus wt% was observed immediately following the appearance of the DS-OCT signal at t=30 s, which then decreased from >4% to ~2% over the next 3 min. In parallel, the HV-OCT signal also increased, demonstrating a higher concentration of GNRs in the mucus as the mesh sizes increased.
Despite the reduction of mucus wt% in the short term, all samples exhibited a mucus layer that appeared homogeneous in wt% throughout time. Although the mucus wt% reduced within the most highly concentrated regions, the combination of this homogenization and the reduction of the mucus layer height are indicative of “temporary” mucus hydration. The data are consistent with the rapid reduction in mucus height observed in time-lapse OCT in Fig. 2, indicating rapid water reabsorption with concomitant overall increase in mucus concentration after IS treatment. Corresponding HH/HV-OCT images confirm that the distribution of GNRs was mostly homogeneous throughout the mucus layer after IS deposition. The rate of fluid reabsorption affects mucus wt% and MCC rates32, and thus is important in evaluating treatment efficacy39, which we, for the first time, have directly observed using DS-OCT.
HS treatment produced more complex, heterogeneous changes in mucus wt% over time compared to IS (Fig. 4A). Before the addition of saline, a DS-OCT signal was only detected in specimen 2 in the HBEC mucus loaded with GNRs, with wt% of mucus >4.0% (t= 0–0.5 min). The high wt% in this one specimen suggests the mucus may have been highly concentrated in all specimens before treatment, which may have caused GNRs to be strongly constrained within the mucus mesh, resulting in failure of the weakly-constrained test (see Methods) used to define a measurable DS-OCT signal. Upon deposition of saline (closed arrowhead), regions of concentrated mucus were lifted from the cell surface to the top of the mucus layer (arrows). For 15–30 s, the height of the HS+mucus layer decreased. We attribute this to the deposited bolus spreading over the HBEC. After 30 s, the overall mucus layer height then increased in all samples, consistent with time-lapse OCT, at a rate of 28.7±5.0 μm/min. This was likely due to rapid and persistent fluid transport into the mucus layer, and has been shown to result in increased mucus transport rates32.
Evidence of fluid secretion was captured in specific regions within specimens 1 and 2, where a combined lack of DS-OCT and HV-OCT signal immediately above the cell layer (asterisks) is consistent with fluid secretions initially void of GNRs. Although the DS-OCT measurements are in one spatial dimension (over time), the apparent swirling pattern in the DS-OCT images is likely a result of mucus mixing with this newly secreted fluid. Supporting evidence of mucus mixing with newly secreted fluid was found with HH/HV-OCT, where low signals in HH and HV (no scatterers, as with secreted fluid), are correlated with the swirling pattern seen with DS-OCT, indicating that the concentration of GNRs were being reduced upon mixing with GNR-void secreted fluid. Mucus mixing was seen in all three specimens: at t=4 min for specimen 1, t=3 min for specimen 2, and t=2 min for specimen 3. These data are consistent with initiation of mucus flow observed in time-lapse OCT in HBEC treated with HS (Fig. 2). Local reductions in mucus wt% were also seen, with the clearest example in specimen 2. At the 1 min time point (20 s after treatment started), the wt% within a region of mucus, initially lacking a DS-OCT signal (presumably due to lack of GNRs as evidenced by the red HH/HV-OCT signal), is reduced for ~2 min (t=1–3 min), with wt% changing from >4% to 2–3%.
Three features of HS treatment were observed with DS-OCT that were not present with IS treatments: 1) high wt% mucus remained at the top of the mucus layer, 2) fluid was secreted by the epithelium, and 3) mucus was continuously mixed with freshly secreted fluid. DS-OCT also showed that mucus hydration is heterogeneous. By sensing epithelial secretion and changes in the heterogeneity in mucus concentration in real-time, DS-OCT provides a rapid and quantitative method for assessing the effects of mucus-hydrating therapy. Altogether, the DS-OCT results indicate that MCC was effectively reestablished by the combined effect of HST on epithelial fluid secretion, overall mucus hydration, and the “circulation” or “floating” of high wt% mucus regions/layers. These observations are important in the interpretation of clinical outcomes in therapies aimed to reduce mucus wt% to reestablish healthy MCC.
It is important to note that DS-OCT and HV-OCT offer complementary data. Locations of decreased wt% in DS-OCT do not necessarily correlate to increased GNR concentration observed in HV-OCT. For example, in Fig. 3a (specimen 1), the stealth arrowhead in the DS-OCT image points to a region of high wt% mucus. There is a large HH and HV signal (bright yellow) in same location in the HH/HV-OCT image. This is likely due to a greater concentration of GNRs having been in this region during GNR pre-loading. In contrast, a similar region of high-wt% mucus in Fig. 4a (specimen 3, also a stealth arrowhead) exhibited a low concentration of GNRs, evidenced by the dark red signal in the HH/HV-OCT image. The regional differences in GNR loading are expected due to the high heterogeneity of the mucus layer, as revealed with DS-OCT. These results highlight the need for diffusion contrast as opposed to standard HH/HV contrast to understand the heterogeneity and dynamics of mucus wt% during treatment. Importantly, these results demonstrate that the DS-OCT and HH/HV-OCT signals are independent of each other. Additionally, rigorous tests used to reject invalid DS-OCT signals (assigned to blue pixels) based upon polarized light fluctuations (see Methods) ensure GNR concentrations are sufficient for accurate wt% estimations, despite variations seen during GNR loading and during hydration therapy.
Conclusion
Concentrated mucus is a hallmark of many airway diseases2. This increase in mucus wt% causes the pericilary layer to collapse, resulting in halted MCC2, 36, which leads to airway obstruction and chronic respiratory infections3. Respiratory treatments require reduction of mucus wt% for efficient MCC and removal of trapped pathogens. Therefore, accurate temporal/spatial measurements of wt% are necessary to measure treatment efficacy. Current outcome measures rely on days-long observation of patients after treatment40, with only recent developments in more rapid measures, on the order of hours39. Here, we presented a new quantitative method for sensing mucus wt% that provides real-time measures of respiratory treatment efficacy. We showed that GNR diffusion was sensitive to wt% in stationary and transporting mucus, then defined a calibration curve used to predict wt% from GNR diffusion measurements. We then used HH-OCT to observe the effects of saline treatment on HBEC. Finally, we employed DS-OCT to quantify mucus wt% in real-time during treatment. We found that, over time, fluid was rapidly reabsorbed and mucus wt% increased to pre-treatment levels with IS. In contrast, mucus wt% changes were heterogeneous during HST. DS-OCT captured evidence of fluid secretion into the apical epithelial surface that is known to promote MCC41, and mixing throughout the mucus layer, which is suggestive of MCC activity. Importantly, DS-OCT provides, for the first time, real-time quantification of the spatial/temporal pattern of changes in mucus wt% during mucus hydration treatments.
Our new methodology is more advantageous than current methods of measuring the hydration level of pulmonary mucus. The current methods either require mucus be removed from the epithelia and be studied ex vivo42 or require tracking 100’s of micron-scale displacements of fiducial markers over time1, 17, which is difficult to achieve in vivo. Also, conventional and confocal microscopy used to monitor cell cultures do not provide a real-time cross-sectional view that are required to record the rapid mucus dynamics observed with DS-OCT during treatment. DS-OCT allows for three main advances compared to conventional means of measuring mucus changes: 1) in situ measurement, allowing for quantification of wt% with minimal disturbance of the epithelium, 2) depth-resolved imaging, allowing for observation of local changes in wt% in relation to both the ciliated and the air interface, and 3) speed, allowing us to monitor GNR diffusion at micro-second timescales that are robust against physiological motion; GNR diffusion rates are then used to resolve mucus wt% at second timescales that are relevant to mucus dynamics. Importantly, differences in cell response to IS and HS are observed on the micrometer length and second time scales, highlighting the power of this technique in pre-clinical studies. DS-OCT not only provides a novel method of measuring immediate responses to treatment, it quantitatively monitors in real-time the magnitude and evolution of mucus concentration. The ability to measure wt% and infer fluid secretion, which is known to elicit a positive long-term treatment response, could provide mechanistic insights into the ultimate restoration of MCC that is also measurable with OCT13.
Future in vivo translation of this methodology depends upon challenges related to the safe and efficient delivery of GNRs in combination with high-speed endoscopic OCT. While PEG coatings on nanoparticles are generally considered safe, the CTAB coatings on GNRs are toxic43 and would need to be fully removed.” GNRs may be nebulized and delivered into the lung via inhalation, after which we estimate they will diffuse throughout a high wt% mucus layer within minutes44. While there will be some transport of mucus during this diffusion time, the nebulized GNRs should remain within reach of an endoscope. Ongoing development of real-time endoscopic OCT of the airway45, as well as PS-OCT techniques for endoscopy46, suggest that DS-OCT is feasible in an endoscopic setup. Importantly, GNRs have not been observed to permeate the bronchial epithelium, suggesting that GNRs delivered in vivo will remain trapped in the mucus and be cleared from the system when mucus transport is reestablished in the patient.
In summary, DS-OCT is a relevant tool, much needed to disentangle mechanisms of reestablishing MCC that are not fully understood in current treatments. DS-OCT, a previously unavailable assessment tool for treatment of CF and other lung diseases, now enables real-time monitoring of the effects of respiratory therapies, taking a critical step toward developing personalized treatments in the clinic.
Supplementary Material
Acknowledgments
We acknowledge the assistance of Timothy O’Brien and Felicity Chung at the University of North Carolina at Chapel Hill (UNC). This work was supported by funds from the National Institutes of Health including Grants R21HL130901, R21HL111968 and R01HL123557 (to A. Oldenburg), P30DK065988 and P01HL034322 (to S. Kreda, D Hill, and L. Ostrowski), and UH2HL123645 (to D. Hill), the National Science Foundation (NSF) including Grants CBET-1351474 (to A. Oldenburg), DMR-1056653 and DMR-1121107 (to J. Tracy), and DMS-1462992 (to D. Hill); the Cystic Fibrosis Foundation including Grants KREDA13G0, RDPRO26 (to S. Kreda), KESIME14XX0 (to L. Ostrowski and P. Sears) and BOUCHE15R0 (to S. Kreda, D. Hill, and L. Ostrowski). We acknowledge use of the Analytical Instrumentation Facility at North Carolina State University (NSF award number ECCS-1542015) and the Computer Integrated Systems for Microscopy and Manipulation at UNC (NIBIB award number P41-EB002025).
Footnotes
Electronic Supplementary Information (ESI) available: [details of any supplementary information available should be included here]. See DOI: 10.1039/x0xx00000x
References
- 1.Hill DB, Vasquez PA, Mellnik J, McKinley SA, Vose A, Mu F, Henderson AG, Donaldson SH, Alexis NE, Boucher RC, Forest MG. PLoS ONE. 2014;9:e87681. doi: 10.1371/journal.pone.0087681. [DOI] [PMC free article] [PubMed] [Google Scholar]
- 2.Button B, Cai LH, Ehre C, Kesimer M, Hill DB, Sheehan JK, Boucher RC, Rubinstein M. Science. 2012;337:937–941. doi: 10.1126/science.1223012. [DOI] [PMC free article] [PubMed] [Google Scholar]
- 3.Boucher RC. Trends Mol Med. 2007;13:231–240. doi: 10.1016/j.molmed.2007.05.001. [DOI] [PubMed] [Google Scholar]
- 4.Henderson AG, Ehre C, Button B, Abdullah LH, Cai LH, Leigh MW, DeMaria GC, Matsui H, Donaldson SH, Davis CW, Sheehan JK, Boucher RC, Kesimer M. J Clin Invest. 2014;124:3047–3060. doi: 10.1172/JCI73469. [DOI] [PMC free article] [PubMed] [Google Scholar]
- 5.Lyczak JB, Cannon CL, Pier GB. Clin Microbiol Rev. 2002;15:194–222. doi: 10.1128/CMR.15.2.194-222.2002. [DOI] [PMC free article] [PubMed] [Google Scholar]
- 6.Tildy BE, Rogers DF. Pharmacology. 2015;95:117–132. doi: 10.1159/000377638. [DOI] [PubMed] [Google Scholar]
- 7.Donaldson SH, Bennett WD, Zeman KL, Knowles MR, Tarran R, Boucher RC. N Engl J Med. 2006;354:241–250. doi: 10.1056/NEJMoa043891. [DOI] [PubMed] [Google Scholar]
- 8.Elkins MR, Bye PTP. Curr Opin Pulm Med. 2006;12:445–452. doi: 10.1097/01.mcp.0000245714.89632.b2. [DOI] [PubMed] [Google Scholar]
- 9.Mall MA. Ann Am Thorac Soc. 2016;13(Suppl 2):S177–185. doi: 10.1513/AnnalsATS.201509-641KV. [DOI] [PubMed] [Google Scholar]
- 10.Yap VL, Metersky ML. Curr Opin Infect Dis. 2015;28:171–176. doi: 10.1097/QCO.0000000000000147. [DOI] [PubMed] [Google Scholar]
- 11.Hart A, Sugumar K, Milan SJ, Fowler SJ, Crossingham I. Cochrane Database Syst Rev. 2014 doi: 10.1002/14651858.CD002996.pub3. [DOI] [PMC free article] [PubMed] [Google Scholar]
- 12.Jonas S, Bhattacharya D, Khokha MK, Choma MA. Biomed Opt Express. 2011;2:2022–2034. doi: 10.1364/BOE.2.002022. [DOI] [PMC free article] [PubMed] [Google Scholar]
- 13.Oldenburg AL, Chhetri RK, Hill DB, Button B. Biomed Opt Express. 2012;3:1978–1992. doi: 10.1364/BOE.3.001978. [DOI] [PMC free article] [PubMed] [Google Scholar]
- 14.Liu L, Shastry S, Byan-Parker S, Houser G, KCK, Birket SE, Fernandez CM, Gardecki JA, Grizzle WE, Wilsterman EJ, Sorscher EJ, Rowe SM, Tearney GJ. Am J Respir Cell Mol Biol. 2014;51:485–493. doi: 10.1165/rcmb.2013-0499MA. [DOI] [PMC free article] [PubMed] [Google Scholar]
- 15.Liu L, Chu KK, Houser GH, Diephuis BJ, Li Y, Wilsterman EJ, Shastry S, Dierksen G, Birket SE, Mazur M, Byan-Parker S, Grizzle WE, Sorscher EJ, Rowe SM, Tearney GJ. PLoS ONE. 2013;8:e54473. doi: 10.1371/journal.pone.0054473. [DOI] [PMC free article] [PubMed] [Google Scholar]
- 16.Chu KK, Unglert C, Ford TN, Cui D, Carruth RW, Singh K, Liu L, Birket SE, Solomon GM, Rowe SM, Tearney GJ. Biomed Opt Express. 2016;7:2494–2505. doi: 10.1364/BOE.7.002494. [DOI] [PMC free article] [PubMed] [Google Scholar]
- 17.Chu KK, Mojahed D, Fernandez CM, Li Y, Liu LB, Wilsterman EJ, Diephuis B, Birket SE, Bowers H, Solomon GM, Schuster BS, Hanes J, Rowe SM, Tearney GJ. Biophys J. 2016;111:1053–1063. doi: 10.1016/j.bpj.2016.07.020. [DOI] [PMC free article] [PubMed] [Google Scholar]
- 18.Boas DA, Bizheva KK, Siegel AM. Opt Lett. 1998;23:319–321. doi: 10.1364/ol.23.000319. [DOI] [PubMed] [Google Scholar]
- 19.Kalkman J, Sprik R, van Leeuwen TG. Phys Rev Lett. 2010:105. doi: 10.1103/PhysRevLett.105.198302. [DOI] [PubMed] [Google Scholar]
- 20.Chhetri RK, Kozek KA, Johnston-Peck AC, Tracy JB, Oldenburg AL. Phys Rev E. 2011:83. doi: 10.1103/PhysRevE.83.040903. [DOI] [PMC free article] [PubMed] [Google Scholar]
- 21.Chhetri RK, Blackmon RL, Wu WC, Hill DB, Button B, Casbas-Hernandez P, Troester MA, Tracy JB, Oldenburg AL. Proc Natl Acad Sci USA. 2014;111:E4289–4297. doi: 10.1073/pnas.1409321111. [DOI] [PMC free article] [PubMed] [Google Scholar]
- 22.Blackmon RL, Sandhu R, Chapman BS, Casbas-Hernandez P, Tracy JB, Troester MA, Oldenburg AL. Biophys J. 2016;110:1858–1868. doi: 10.1016/j.bpj.2016.03.014. [DOI] [PMC free article] [PubMed] [Google Scholar]
- 23.Matsui H, Randell SH, Peretti SW, Davis CW, Boucher RC. J Clin Invest. 1998;102:1125–1131. doi: 10.1172/JCI2687. [DOI] [PMC free article] [PubMed] [Google Scholar]
- 24.Button B, Boucher RC. Respir Physiol Neurobiol. 2008;163:189–201. doi: 10.1016/j.resp.2008.04.020. [DOI] [PMC free article] [PubMed] [Google Scholar]
- 25.Sears PR, Yin WN, Ostrowski LE. Am J Physiol Lung Cell Mol. 2015;309:L99–L108. doi: 10.1152/ajplung.00024.2015. [DOI] [PMC free article] [PubMed] [Google Scholar]
- 26.Kreda SM, Seminario-Vidal L, van Heusden CA, O’Neal W, Jones L, Boucher RC, Lazarowski ER. J Physiol. 2010;588:2255–2267. doi: 10.1113/jphysiol.2009.186643. [DOI] [PMC free article] [PubMed] [Google Scholar]
- 27.Kreda SM, Mall M, Mengos A, Rochelle L, Yankaskas J, Riordan JR, Boucher RC. Mol Biol Cell. 2005;16:2154–2167. doi: 10.1091/mbc.E04-11-1010. [DOI] [PMC free article] [PubMed] [Google Scholar]
- 28.Hill DB, Button B. Methods Mol Biol. 2012;842:245–258. doi: 10.1007/978-1-61779-513-8_15. [DOI] [PubMed] [Google Scholar]
- 29.Oldenburg AL, Chhetri RK. Proc SPIE. 2011;7889:78891V-78891V–78896. [Google Scholar]
- 30.Kozek KA, Kozek KM, Wu WC, Mishra SR, Tracy JB. Chemistry of Materials. 2013:25. doi: 10.1021/cm402277y. [DOI] [PMC free article] [PubMed] [Google Scholar]
- 31.Matsui H, Wagner VE, Hill DB, Schwab UE, Rogers TD, Button B, Taylor RM, 2nd, Superfine R, Rubinstein M, Iglewski BH, Boucher RC. Proc Natl Acad Sci USA. 2006;103:18131–18136. doi: 10.1073/pnas.0606428103. [DOI] [PMC free article] [PubMed] [Google Scholar]
- 32.Tarran R, Grubb BR, Gatzy JT, Davis CW, Boucher RC. J Gen Physiol. 2001;118:223–236. doi: 10.1085/jgp.118.2.223. [DOI] [PMC free article] [PubMed] [Google Scholar]
- 33.Matsui H, Davis CW, Tarran R, Boucher RC. J Clin Invest. 2000;105:1419–1427. doi: 10.1172/JCI4546. [DOI] [PMC free article] [PubMed] [Google Scholar]
- 34.Reeves EP, McCarthy C, McElvaney OJ, Vijayan MS, White MM, Dunlea DM, Pohl K, Lacey N, McElvaney NG. World J Crit Care Med. 2015;4:179–191. doi: 10.5492/wjccm.v4.i3.179. [DOI] [PMC free article] [PubMed] [Google Scholar]
- 35.Bonser LR, Zlock L, Finkbeiner W, Erle DJ. J Clin Invest. 2016;126:2367–2371. doi: 10.1172/JCI84910. [DOI] [PMC free article] [PubMed] [Google Scholar]
- 36.Anderson WH, Coakley RD, Button B, Henderson AG, Zeman KL, Alexis NE, Peden DB, Lazarowski ER, Davis CW, Bailey S, Fuller F, Almond M, Qaqish B, Bordonali E, Rubinstein M, Bennett WD, Kesimer M, Boucher RC. Am J Respir Crit Care Med. 2015;192:182–190. doi: 10.1164/rccm.201412-2230OC. [DOI] [PMC free article] [PubMed] [Google Scholar]
- 37.Button B, Anderson WH, Boucher RC. Ann Am Thorac Soc. 2016;13:S156–S162. doi: 10.1513/AnnalsATS.201507-455KV. [DOI] [PMC free article] [PubMed] [Google Scholar]
- 38.Tarran R, Button B, Boucher RC. Annu Rev Physiol. 2006;68:543–561. doi: 10.1146/annurev.physiol.68.072304.112754. [DOI] [PubMed] [Google Scholar]
- 39.Locke LW, Myerburg MM, Markovetz MR, Parker RS, Weber L, Czachowski MR, Harding TJ, Brown SL, Nero JA, Pilewski JM, Corcoran TE. Eur Respir J. 2014;44:675–684. doi: 10.1183/09031936.00220513. [DOI] [PMC free article] [PubMed] [Google Scholar]
- 40.Hafen GM, Ranganathan SC, Robertson CF, Robinson PJ. Pediatric pulmonology. 2006;41:602–617. doi: 10.1002/ppul.20376. [DOI] [PubMed] [Google Scholar]
- 41.Zeiger RS. J Allergy Clin Immunol. 1992;90:478–495. doi: 10.1016/0091-6749(92)90173-y. [DOI] [PubMed] [Google Scholar]
- 42.Gianotti A, Capurro V, Scudieri P, Galietta LJV, Moran O, Zegarra-Moran O. J Cyst Fibros. 2016;15:295–301. doi: 10.1016/j.jcf.2015.11.003. [DOI] [PubMed] [Google Scholar]
- 43.Dinish US, Goh D, Fu CY, Bhuvaneswari R, Sun W, Olivo M. Plasmonics. 2013;8:591–598. [Google Scholar]
- 44.Suk JS, Lai SK, Wang YY, Ensign LM, Zeitlin PL, Boyle MP, Hanes J. Biomaterials. 2009;30:2591–2597. doi: 10.1016/j.biomaterials.2008.12.076. [DOI] [PMC free article] [PubMed] [Google Scholar]
- 45.Adams DC, Wang Y, Hariri LP, Suter MJ. IEEE J Sel Top Quantum Electron. 2016;22:12. [Google Scholar]
- 46.Villiger M, Karanasos A, Ren J, Lippok N, Shishkov M, van Soest G, Nadkarni S, Regar E, Bouma BE Ieee. 2016 Conference on Lasers and Electro-Optics; New York: Ieee; 2016. [Google Scholar]
Associated Data
This section collects any data citations, data availability statements, or supplementary materials included in this article.