

Abstract
Hepatocellular carcinoma (HCC) is a common cancer that frequently overexpresses the c-Myc (Myc) oncoprotein. Using a mouse model of Myc-induced HCC, we studied the metabolic, biochemical, and molecular changes accompanying HCC progression, regression, and recurrence. These involved altered rates of pyruvate and fatty acid β-oxidation and the likely re-directing of glutamine into biosynthetic rather than energy-generating pathways. Initial tumors also showed reduced mitochondrial mass and differential contributions of electron transport chain complexes I and II to respiration. The uncoupling of complex II's electron transport function from its succinate dehydrogenase activity also suggested a mechanism by which Myc generates reactive oxygen species. RNA sequence studies revealed an orderly progression of transcriptional changes involving pathways pertinent to DNA damage repair, cell cycle progression, insulin-like growth factor signaling, innate immunity, and further metabolic re-programming. Only a subset of functions deregulated in initial tumors was similarly deregulated in recurrent tumors thereby indicating that the latter can “normalize” some behaviors to suit their needs. An interactive and freely available software tool was developed to allow continued analyses of these and other transcriptional profiles. Collectively, these studies define the metabolic, biochemical, and molecular events accompanyingHCCevolution, regression, and recurrence in the absence of any potentially confounding therapies.
Keywords: β-catenin, energy metabolism, glycolysis, hepatocellular carcinoma, Yes-associated protein (YAP)
Introduction
Although relatively uncommon in the United States and other developed Western nations, hepatocellular carcinoma (HCC)3 is the sixth most common cancer worldwide, and in some localities it is actually the most common (1–3). It is also the second leading cause of cancer-related deaths with long-term survival seldom exceeding 10–20% (1, 4, 5). Factors predisposing to HCC include chronic hepatitis B and C infection, cirrhosis, non-alcoholic steatohepatitis, and ingestion of the potent environmental mutagen aflatoxin B1 (1, 4–6). Inherited causes of HCC, accounting for many fewer cases but associated with earlier onset, include hereditary tyrosinemia, α1-antitrypsin deficiency, and hemochromatosis (7, 8).
Given the diversity of HCC etiologies, it is perhaps not surprising that multiple putative driver mutations have been identified in primary tumors. These involve the TERT, TP53, MET, and ARID1A/2 genes and those encoding members of the Wnt/β-catenin pathway, including β-catenin itself and Axin (9–12). Indeed, aberrant nuclear localization of β-catenin and yes-associated protein (YAP) (13), which share numerous genetic targets, occurs frequently in HCC, and in some cases, the mutations responsible for this have been identified (14–16). The MYC gene (Myc), although seldom mutated in any cancer, is also commonly overexpressed and/or amplified in HCC (17–19). In murine models, the singular hepatic deregulation of Myc leads to rapid HCC tumorigenesis with a high degree of penetrance and absolute dependence on its sustained overexpression (20–22).
In this work, we utilized one of these transgenic HCC models in which tumor initiation and sustained growth are solely dependent on the expression of a doxycycline-regulated Myc transgene (22). The model permits an examination of the nature and timing of other molecular, biochemical, and metabolic drivers and modifiers that accumulate during and impact tumorigenesis. It also allows a determination of how these factors respond during tumor regression following Myc silencing and tumor recurrence following Myc re-expression. This approach therefore provides insight into the evolutionary processes that accompany primary and relapsed tumorigenesis in response to the precisely regulated overexpression of a single well defined oncogenic stimulus.
Results
HCC evolution, regression, and recurrence
In contrast to a previous report (22), liver weights remained unchanged for at least 1 week following Myc induction. Tumors also appeared earlier than previously reported, reaching maximal size within 3–4 weeks. Tumors then regressed by ∼50–75% within a week of resuming doxycycline and disappeared over the ensuing 1–2 weeks (supplemental Fig. S1A). Upon re-inducing Myc 2–3 months later, tumors recurred more rapidly than initial tumors, attaining sizes approximating those of the original neoplasms within 11–15 days. We refer to these hereafter as “initial tumors” (or “tumors”) and “recurrent tumors,” respectively. Cell cycle analyses performed on nuclei isolated from initial and recurrent tumors showed distinctly different patterns compared with livers and with one another (supplemental Fig. S1B). For example, nuclei isolated from normal livers, although primarily diploid, also contained the expected subpopulations of tetraploid and octaploid nuclei (23). The paucity of S-phase populations was consistent with these cells being uniformly quiescent. In contrast, nuclei from initial tumors were diploid (or pseudo-diploid) with a significant S-phase population. Recurrent tumors showed a greater fraction of S-phase cells and a more disperse DNA distribution, suggesting that many of the nuclei were aneuploid, despite the known clonal derivation of these from the initial tumors (22). Both initial and recurrent tumors expressed high but otherwise equivalent levels of proliferating cell nuclear antigen (Pcna). Thus, the faster growth of recurrent tumors correlated with a higher S-phase population and aneuploidy (supplemental Fig. S1C). Histologically, all tumors resembled moderately differentiated HCCs with numerous mitotic cells observed in most high-power fields (supplemental Fig. S1D) (22).
Both initial and recurrent tumors expressed high Myc levels (Fig. 1A and supplemental Fig. S2A). Much lower levels were detected in livers prior to the appearance of tumors (D3 and D7), and virtually none was detected in regressing tumors (R3 and R7). Thus, in response to doxycycline removal, and as reported previously (24), Myc accumulated gradually, achieved maximal expression only in fully developed tumors, and disappeared rapidly following return to the “Myc off” state.
Figure 1.

Immunoblot profiling of liver and tumor samples. A, expression of Myc, β-catenin, and YAP in livers and HCCs. Tissues examined included control, D3 and D7 livers, initial tumors, R3 and R7 regressing tumors, and recurrent tumors. The adjacent Myc blot is a repeat of the one shown to the left with both tumor samples removed to allow a longer exposure and reveal the lower but still overexpressed levels of Myc in D3 and D7 liver samples. See supplemental Fig. S2A for additional immunoblots and supplemental Table S6 for band density quantification. B, phosphorylation-dependent regulation of PDH by the inhibitory kinase Pdk1 and the stimulatory phosphatase Pdp2 (27). High ATP/ADP ratios concurrently stimulate Pdk1 and inhibit Pdp2, thereby down-regulating PDH activity and limiting pyruvate's conversion to AcCoA (27). C, immunoblots showing total PDH and phospho-Ser293 PDH E1α subunit (pPDH), an indicator of relative PDH inactivity. Also examined were total amounts of PDK1 and PDP2. See supplemental Fig. S2B for additional immunoblots and supplemental Table S6 for band density quantification. D, PDH enzymatic activity in fresh tissue samples. Groups were compared with ANOVA, and each group was compared with control liver with two-sided t tests with Welch's correction due to heteroskedasticity and Bonferroni correction to control for false discovery (adjusted 0.0083̄). n = 4–5 samples/group except control liver, with 29 samples. The release of 14CO2 during the conversion of 14C-labeled pyruvate to AcCoA was monitored as described previously (30). E, ATP levels were quantified with 3–4 samples per group, each assayed in triplicate, and were compared with ANOVA and Tukey's multiple comparisons two-sided t tests.
Many HCCs co-express β-catenin, YAP, and Myc, and the MYC gene is a target for both the β-catenin and Hippo/YAP pathways (14, 15, 17–19, 25, 26). Whether Myc in turn influences the expression of the other two oncoproteins is unknown as is the order in which these proteins appear during disease progression. β-Catenin expression was detected at low levels in liver, accumulated gradually following Myc induction, and was maximally expressed in initial tumors or R3 tumors. It then tended to decline by R7 and did not reappear in recurrent tumors (Fig. 1 and supplemental Fig. S2A). In contrast, YAP was highly up-regulated in and remained confined to initial and recurrent tumors, although expression in the latter group was lower. This suggested that, at least in initial tumors, the deregulation of YAP and β-catenin was more dependent on sustained Myc expression than on the actual tumor environment. It further indicated distinct biochemical differences between initial and recurrent tumors with regard to the expression of these two critical oncoproteins.
Metabolic changes accompanying HCC evolution
Pyruvate dehydrogenase (PDH) is a mitochondrial enzyme complex that links glycolysis and the TCA cycle by catalyzing pyruvate's irreversible conversion to acetyl coenzyme A (AcCoA) (ΔG0 = −7.5 kcal) (27). Reduced PDH activity in some cancers may allow the accumulation of upstream glycolytic intermediates that serve as anabolic precursors while simultaneously diverting pyruvate away from the TCA cycle in cells that are heavily reliant on the Warburg effect (28, 29). In experimental murine hepatoblastomas (HBs), however, we previously showed PDH to be highly up-regulated and to correlate with decreased expression of the inhibitory kinase Pdk1 and increased expression of the stimulatory phosphatase Pdp2 (Fig. 1B) (27, 30). To determine whether this was also true in HCCs, we measured total and phosphorylated (Ser293) PDH E1 subunit (pPDH), with the latter indicating a less active form of the enzyme (27, 29). In keeping with our earlier HB results (30), both initial and recurrent HCCs showed significantly reduced E1 subunit phosphorylation as well as decreased Pdk1 and increased Pdp2, with changes in the latter being seen as early as D3–D7 (Fig. 1C and supplemental Fig. S2B). Consistent with these findings, PDH enzymatic activity was also markedly increased at these times (Fig. 1D). Despite similarly appearing pPDH/Pdk1/Pdp2 profiles (Fig. 1C and supplemental Fig. S2B), recurrent tumors had lower PDH activity than even control livers (Fig. 1D), perhaps because of an overall lower level of total PDH. In keeping with the notion that high PDH activity might maximize ATP generation in the face of limiting amounts of pyruvate, initial tumors but not recurrent tumors contained significantly more ATP than livers (Fig. 1E). Indeed, recurrent tumors contained even less PDH activity than livers. Collectively, these results showed that PDH activity was highly sensitive to initial fluctuations in Myc levels but that this response was lost in recurrent tumors in a manner that correlated with ATP levels.
To identify additional metabolic changes, we next evaluated certain mitochondrial properties and functions, including mass, oxidative phosphorylation (Oxphos), electron transport chain (ETC) function, and fatty acid β-oxidation (FAO), that are deregulated in HBs (30, 31). These and other human tumors often have significantly reduced mitochondrial mass relative to their corresponding normal tissues, thus partially, if not entirely, explaining the Warburg effect (30, 32). Similarly, an ∼30–40% reduction in mitochondrial mass was noted in initial tumors and persisted during regression and recurrence (Fig. 2A).
Figure 2.

Changes in mitochondrial structure and function during HCC evolution. A, mitochondrial mass. Mitochondrial DNA (mtDNA) content was assessed with two TaqMan probe sets (probe set 1 and probe set 2) designed to amplify distinct regions of the mitochondrial genome. Results were normalized to those of a parallel PCR that amplified a segment of the apolipoprotein B gene (30) and compared with ANOVA and Tukey's multiple comparisons two-sided t tests. n = 4–7 samples/group. B, activities of ETC complexes I and II in intact mitochondria. OCRs were quantified on liver and tumor mitochondrial suspensions by respirometry (30, 31) and compared with Mann-Whitney U tests. Combined complex I + II activities were evaluated by measuring peak OCRs in response to pyruvate, malate, glutamate, and ADP followed by the addition of succinate. After adding rotenone to inhibit complex I, the individual contributions of complex I and complex II were calculated and normalized to protein content. n = 5–7 samples/group. C, ETC complex function. BNGE was performed on liver and tumor samples from each of the indicated groups (30, 31) and compared with ANOVA and Dunnett multiple comparisons two-sided t tests. The relative abundance of each complex was determined by densitometric scanning (supplemental Fig. S3A) and used to normalize in situ enzymatic activities. Complexes I–V measured NADH ubiquinone oxidoreductase, succinate dehydrogenase, decylubiquinol cytochrome c oxidoreductase, cytochrome c oxidase, and ATPase, respectively (31). SDH activity of complex II was measured on total tissue lysates rather than by in situ assay and was log-transformed for analysis to satisfy ANOVA's homoskedasticity requirement. n = 4 samples/group. D, reduced FAO oxidation by initial and recurrent tumors. [3H]Palmitate conversion to water-soluble products was measured from the indicated groups of mice and compared with ANOVA and Tukey's multiple comparisons two-sided t tests. n = 4–5 samples/group except in control liver, which had 18 samples.
Complex I activity of livers remained unchanged in the immediate D3–D7 period but increased significantly in initial tumors as described previously for HBs (Fig. 2B) (30). This persisted in R3 tumors, normalized in R7 tumors, and remained low in recurrent tumors. Complex II activity was also initially unchanged in response to Myc activation but then decreased by ∼50% in initial tumors as also seen previously in HBs (30). Rapid normalization of complex II activity occurred by R3 and persisted, even in recurrent tumors. These results indicate that, relative to livers, initial tumors altered their Oxphos profile so as to favor complex I over complex II as a source of electrons for complex III. In contrast, the overall mitochondrial function in recurrent tumors more closely resembled that of normal livers. Together, these results indicate that, despite the similarity of their mitochondrial mass, initial and recurrent tumors are metabolically distinct with regard to ETC function.
Blue native gel electrophoresis (BNGE) and in situ enzymatic assays (30, 31, 33) revealed no significant differences in the amounts or activities of ETC complexes I, III, and IV or of complex V (ATPase) over the course of HCC evolution (Fig. 2C and supplemental Fig. S3). In contrast, complex II activity was increased nearly 4-fold in initial tumors and somewhat less so in recurrent tumors. These results, together with the lower complex II activity of initial tumors as measured by respirometry (Fig. 2B), indicated that the electron transport function of complex II, as measured by OCR (Fig. 2B), was uncoupled from its succinate dehydrogenase (SDH) activity, which oxidizes succinate to fumarate using flavin adenine dinucleotide (FAD) as the electron donor (34).
The profoundly reduced FAO activity in HBs has suggested that, rather than being metabolized to AcCoA and re-synthesized into lipids, de novo, free fatty acids are instead preferentially incorporated directly into new lipids to support rapid tumor growth, thus presumably increasing tumor reliance on glucose as an energy source (30, 31). Similarly, we observed a gradual decline in FAO in response to Myc activation, culminating in a nearly 7-fold reduction in initial HCCs (Fig. 2D). FAO activity in recurrent tumors was also low, suggesting that this pathway does not contribute significantly to the ATP supply in either case.
Coordinated transcriptional dynamics accompany tumor evolution, regression, and recurrence
We employed RNA-seq to profile the transcriptional landscapes of the above seven sets of tissues. Because of the large number of differentially expressed genes that were identified (Fig. 3A), we used Ingenuity Pathway Analysis (IPA) to categorize them into 13 “super pathways” that were further composed of multiple, functionally related “member pathways” (Fig. 3B and https://prochownik.pitt.edu/hcc). In keeping with the ability of de-regulated Myc to rapidly induce reactive oxygen species (ROS), unscheduled DNA synthesis, and structural chromosomal and genomic damage in vitro (35–38), D3 livers showed extensive but selective deregulation of three super pathways (“cancer signaling/proliferation,” “cell cycle,” and “DNA damage”), composed of 16 individual member pathways devoted almost exclusively to cell cycle and mitotic checkpoint control, growth arrest, and the response to and repair of DNA damage (i.e. ATM and Brca1 signaling and base excision, mismatch, and double-stranded DNA repair) (Fig. 3B). Together, these member pathways contained 156 deregulated transcripts. Consistent with Myc's ability to rapidly induce aberrant DNA synthesis (37, 38), transcripts for virtually all major cyclins, cyclin-dependent kinases and cyclin-dependent kinase inhibitors, were significantly induced at this time (supplemental Fig. S4). A fourth de-regulated super pathway pertained to “small molecule biochemistry” within which only a single member pathway related to pyrimidine deoxyribonucleotide biosynthesis and involving four transcripts was de-regulated as also described for Myc overexpression in vitro (39).
Figure 3.

Patterns of gene expression changes during the course of HCC evolution. A, differentially expressed transcripts. Numbers in parentheses indicate the number of significant gene expression differences between the indicated samples and control livers, per DESeq FDR-adjusted q < 0.05. n = 5 samples/group. Transcripts that were overexpressed relative to control liver are colored orange, and those that were under-expressed are colored green. B, super pathways of gene expression changes during HCC evolution, regression, and recurrence. Differentially expressed transcripts from A were analyzed with IPA (http://www.ingenuity.com), which identified a total of 205 pathways significantly involved across the experimental groups. Individual pathways identified by an IPA comparison of each experimental group with control liver are represented by circles, sized by −log2(p), and colored according to their predicted activation or inhibition (positive or negative Z-score, respectively). Pathways without prediction information from IPA are colored gray. These individual pathways were grouped into 13 super pathways utilizing IPA's category scheme. Numbers in parentheses indicate total number of member pathways in each super pathway. As an example, the overall changes seen in D3 livers were dominated by three major super pathways as follows: cancer signaling/proliferation, cell cycle, and DNA damage. Among the member pathway groups contained therein were those composed of transcripts regulating activities such as Brca1 and ATM signaling; DNA mismatch, base excision, and double-stranded DNA breakage repair; cell cycle control of DNA replication, and G2/M checkpoint regulation. To access super pathways interactively and to explore their component pathway groups and transcripts, see https://prochownik.pitt.edu/hcc.
Disruption of the above individual pathways persisted in D7 livers but were now displaced by 30 of 50 components comprising an “immune response” super pathway. Nineteen of these 30 members were predicted to be up-regulated, and none were predicted to be down-regulated. The vast majority of the 436 differentially expressed constituent transcripts encoded chemokines, cytokines, and other proteins involved in the innate immune response (Fig. 4A). We postulated that these originated from inflammatory cells infiltrating the liver in response to Myc-induced genotoxic or oxidative stress injury (35–38, 40) and/or neoantigens produced prior to actual transformation. To examine this, we isolated single cells from control and D7 livers and characterized the resident hematopoietic (CD45+) cell populations. Strikingly, the mononuclear infiltrate recovered from D7 livers was increased more than 4-fold (Fig. 4B) and comprised both myeloid and lymphoid cells. IL-10-secreting CD68+CD11b+ macrophages were disproportionately enriched in this population, consistent with the idea that this infiltrate represented a primarily acute inflammatory response (Fig. 4C). This was also consistent with the finding that a number of the most highly up-regulated chemokines and cytokines, including Ccl2 (MCP1), Ccl3 (MIP1α), Ccl4 (MIP1β), Ccl7 (MCP3), and Ccl22, are known to be chemotactic for, or activators of, monocytes and/or macrophages (41–45).
Figure 4.

D7 livers demonstrate up-regulation of markers of the innate immune response and infiltration by inflammatory cells. A, heat map showing changes in the expression of transcripts encoding inflammatory cytokines, chemokines, and chemotactic factors pertaining to innate and adaptive immunity. The transcript order is arranged from highest to lowest levels of expression in initial tumors. B, total numbers of hematopoietic cells isolated from control livers, D7 livers, or regressed livers, which were to again overexpress Myc for 7 days (recurrent D7). Compared with two-way ANOVA and Dunnett's multiple comparison two-sided t tests. n = 3–7 samples/group. C, intracellular cytokine staining for IL-10 was performed on infiltrating (CD68+, CD11b+) macrophages following brief exposure to lipopolysaccharide as described under “Experimental procedures” and compared with a two-sided t test assuming homoskedasticity. n = 4 samples/group.
Following a 2–3-month period of complete tumor regression, we re-activated Myc and re-characterized the liver-associated cellular infiltrates on day 7 by flow cytometry. Surprisingly, there was minimal increase in the number of cells recovered on day 7 post-recurrent Myc expression (Fig. 4B). Taken together, these results indicated that the extent and nature of the immune response to hepatic Myc induction prior to the appearance of any tumors was highly dependent upon whether prior tumorigenesis had occurred.
The “RXR/lipid metabolism” super pathway in D7 livers also demonstrated changes, although only one of its 23-member component pathways, involving 17 transcripts related to phosphoinositide metabolism, was significantly deregulated. This gained increased prominence in initial tumors in which additional six-member pathways, totaling 335 transcripts, were deregulated (Fig. 3). Together, these encoded participants in FAO, lipid, and bile acid synthesis and xenobiotic functions normally ascribed to differentiated hepatocytes (46, 47). Consistent with the idea that tumorigenesis leads to a global state of de-differentiation and the assumption of more fetal-like behaviors (48), we observed widespread down-regulation of the “coagulation” super pathway, which involved four member pathways containing transcripts for virtually all clotting factors synthesized by mature hepatocytes (supplemental Fig. S5A). Further supporting the loss of differentiated functions by the normal liver was the >100-fold down-regulation of all detectable transcripts encoding members of the major urinary protein family, which play important roles in pheromone sensing and chemical recognition (supplemental Fig. S5B) (49). A separate “cellular stress” super pathway contained a large set of mostly down-regulated transcripts encoding various acute-phase reactants, which are also typically synthesized by highly differentiated cells (supplemental Fig. S5C) (50). Finally, we noted marked down-regulation of numerous transcripts encoding both class I and class II members of the major histocompatibility complex (supplemental Fig. S5D). These results were consistent with the idea that, beginning as early as 3–7 days after Myc induction, hepatocytes dramatically down-regulate multiple transcripts involved in numerous highly differentiated functions, including immune recognition.
Additional pathways within the RXR/lipid metabolism super pathway, including those involved in fatty acid and cholesterol homeostasis (47), were also highly deregulated in tumors. This agreed with the actual changes in FAO observed in these tumors and previously observed in HBs (Figs. 2D and 5, A and B) (30). Additionally consistent with these findings and with the presumptive induction of the Warburg effect was the up-regulation in tumors of virtually all transcripts involved in glucose transport and glycolysis (Fig. 5C and, https://prochownik.pitt.edu/hcc, “small molecule biochemistry”). Further noted were changes in the expression of transcripts involved in glutamine uptake and glutaminolysis (Fig. 5, D and E). Specifically, those encoding the Slc1A5 glutamine transporter were up-regulated by 42-fold in HCCs relative to control livers, whereas transcripts encoding glutaminase 2 (Gls2), the rate-limiting enzyme of glutaminolysis and glutamate dehydrogenase (Glud1), were down-regulated by 5- and 3-fold, respectively (Fig. 5E).
Figure 5.

Deregulation of select pathways pertaining to lipid, glucose, and glutamine metabolism in initial HCCs. A, heat map of transcripts comprising the combined LXR/FXR/RXR/PXR transcription factor pathways. B and C, heat maps comprising FAO and glycolytic pathways, respectively. D, pathway of glutaminolysis showing the uptake of exogenous glutamine by its transporter, Slc1A5, and its direct conversion to glutamate and α-ketoglutarate mediated by the rate-limiting enzyme glutaminase and glutamate dehydrogenase, respectively. The conversion of glutamate to α-ketoglutarate can also occur via deamination during the glutamate oxaloacetate transaminase-mediated conversion of oxaloacetate to aspartate and the glutamate-pyruvate dehydrogenase-mediated conversion of pyruvate to alanine. E, heat map for the six transcripts encoding the enzymes depicted in D, plus Gls1, which is not normally expressed in normal liver but has been shown to be increased in fetal tissues and tumors and is a known Myc target (51, 52). F, immunoblots for glutaminase 1 and 2 (Gls1 and Gls2) and glutamate dehydrogenase (Glud1) in four sets of tissues from independent groups of mice. See supplemental Table S6 for band density quantification.
Unlike Gls2, which is the liver-specific glutaminase isoform, Gls1 is expressed at low levels in the liver but at much higher levels in tissues such as kidney and brain (51). Indeed, Gls2 transcripts were >60-fold more abundant than Gls1 transcripts in control liver tissues (14,793 reads per kilobase per million (RPKM) versus 241 RPKM) (Fig. 5E). However, Gls1 is also expressed in fetal liver and by transformed cells and is a Myc target (51, 52). Whereas Gls2 transcripts decreased in HCCs by 5-fold as mentioned above, those for Gls1 increased by nearly 25-fold (241 RPKM versus 5918 RPKM). When taken together, however, total Gls1 plus Gls2 transcripts were decreased by 40% in initial HCCs and by 43% in recurrent HCCs. Immunoblots for Gls1, Gls2, and Gludh1 confirmed the results obtained by transcriptional profiling (Fig. 5F). Thus, although Gls1 and Gls2 transcripts and proteins underwent significant changes during the course of initial and recurrent tumorigenesis, our results suggest that a switch to glutaminolysis, as a way of providing a glycolysis-independent alternative fuel source for the TCA cycle, does not play a major role in sustaining HCCs as it does in some tumors (53). Rather, the presumptive increase in glutamine content mediated by Slc1A5 up-regulation is likely channeled into anabolic pathways.
The deregulation of the cancer signaling/proliferation super pathway, first noted in D3 livers and primarily involving cell cycle control and DNA damage repair pathways, assumed an expanded role in initial tumors (396 versus 34 deregulated transcripts). Notably, virtually all transcripts encoding ribosomal proteins, factors involved in ribosomal assembly and mRNA-ribosomal engagement (eIFs), and mTOR signaling now dominated the transcriptional landscape and involved 210 of the 396 de-regulated transcripts (Fig. 6, A–C). Cell cycle and DNA damage transcripts remained de-regulated but were composed of <20% of the differentially expressed transcripts within this super pathway. The rapid tumor regression accompanying Myc inactivation (supplemental Fig. S1A) was associated with equally rapid and marked down-regulation of ribosomal protein-, eIF-, and mTOR-related transcripts (Fig. 6, A–C). Also notable was the reappearance of the immune response super pathway. Individual pathways within this category increased from two in initial tumors to 36 at R3 and 46 at R7 (Fig. 3 and https://prochownik.pitt.edu/hcc). Many of these pathways were those previously identified only transiently in D7 livers (Fig. 3B).
Figure 6.
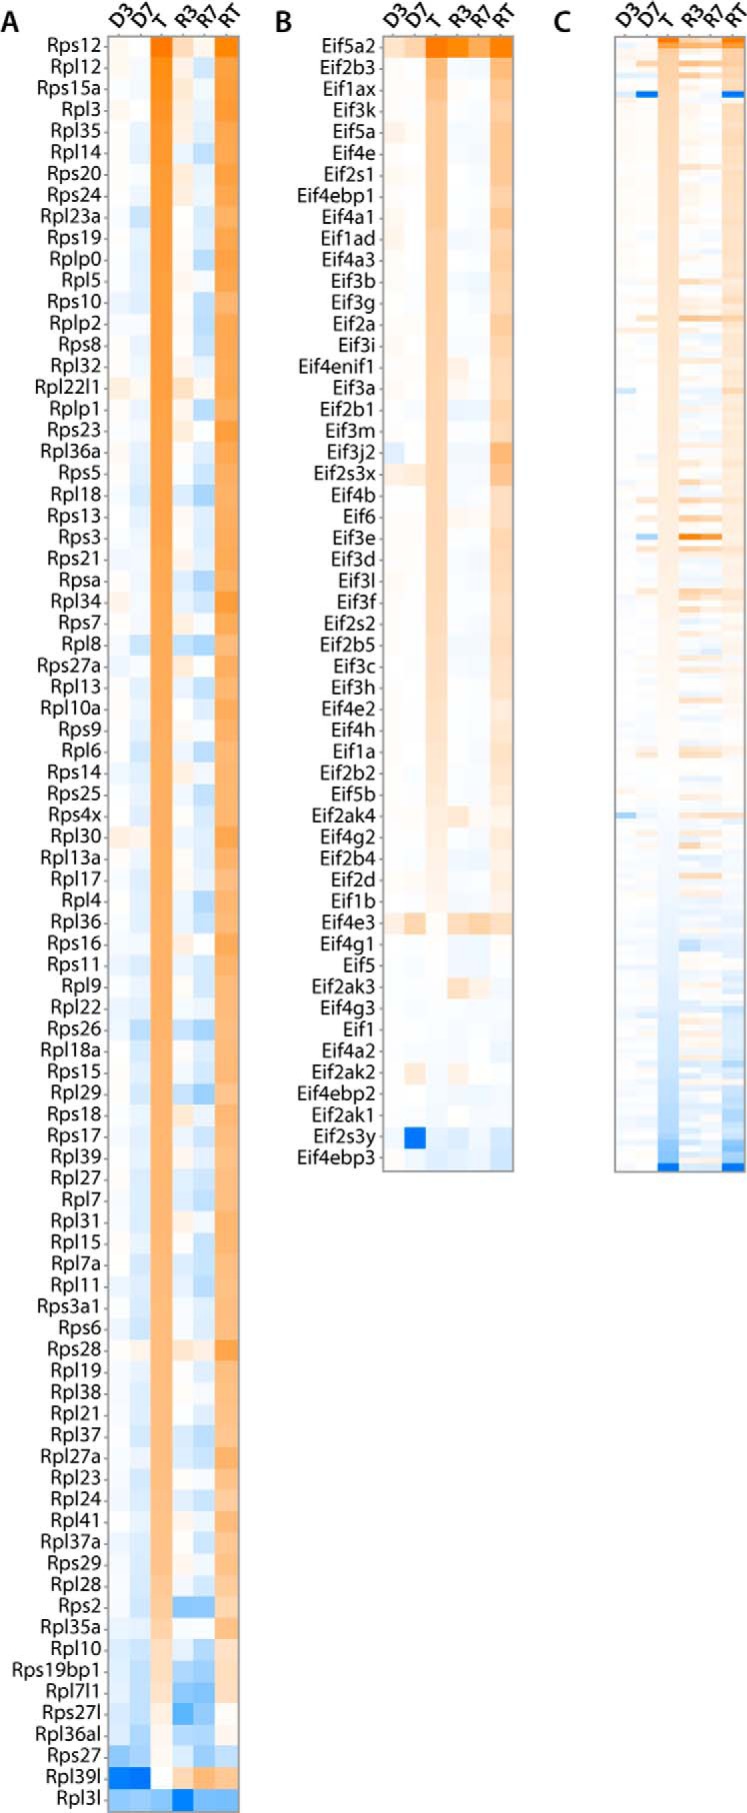
Changes in select transcripts comprising the cancer signaling/proliferation super pathway. In contrast to the 34 differentially expressed transcripts comprising members of the “hereditary breast cancer,” “gadd45,” and “aryl hydrocarbon receptor” signaling pathways (19, 6, and 9 transcripts, respectively) seen in D3 livers, a total of eight pathways involving a total of 396 transcripts were deregulated in the super pathway in initial tumors. Most notably, these involved marked up-regulation of transcripts encoding ribosomal proteins (A), factors that facilitate mRNA engagement of and translation by the ribosome (B), and members of the mTOR pathway, which integrates a variety of growth-promoting signals and serves as a nutrient sensor (C) (57).
In humans, predisposing factors for the development of HCC are extremely varied and include hepatitis B and C infection, non-alcoholic steatohepatitis, and alcoholic and non-alcoholic cirrhosis. Not unexpectedly, these tumors also tend to be biochemically and molecularly heterogeneous; in addition to MYC, oncoprotein drivers for these cancers include β-catenin, Ras, TERT, and members of the insulin-like growth factor and transforming growth factor families (10, 54–56). To correlate the findings in our Myc-driven murine HCC model with human HCCs, we used The Cancer Genome Atlas to compare mRNA expression data between normal liver, non-MYC-amplified tumors, and MYC-amplified tumors. MYC-amplified tumors had 2.2-fold greater expression of MYC transcript than non-MYC-amplified tumors (p = 4.4 × 10⁻¹¹). Compared with normal livers, ribosomal protein, eIF, glycolytic, and glutaminolytic transcripts were deregulated in human HCCs much in the same manner as seen in murine HCCs, and this effect was greater in MYC-amplified tumors (supplemental Fig. S7).
Transcriptional differences between initial and recurrent tumors
Despite their metabolic differences, initial and recurrent tumors appeared quite similar at the transcriptional level in terms of the composition of their deregulated super pathways and the component member pathways (Fig. 3A and https://prochownik.pitt.edu/hcc). However, 441 individual gene expression differences were nonetheless noted between these two cohorts (Figs. 3A and 7A). 409 of these (92.7%) were already deregulated in initial tumors but were disparate in the two tumor groups (Fig. 7B). The remaining 26 transcripts, i.e. those falling on or close to the abscissa in Fig. 7B, were those which, although not differentially expressed between livers and initial tumors, were differentially expressed between the two tumor groups (Fig. 7C). Among this small group of transcripts were several whose encoded proteins might participate in the accelerated growth of recurrent tumors (supplemental Fig. S1A). These included Gdf3, a member of the TGF-β family of growth factors, which was up-regulated (58); Ildr2, Pcx, and Dhtkd1, which regulate lipid and carbohydrate metabolism and which were all down-regulated (59–61); and three putative tumor suppressors, Plk2, Ptpn14, and Tshz2, which were also down-regulated (62–64).
Figure 7.

Gene expression differences between initial and recurrent tumors. A, heat map of the 441 gene expression differences between initial and recurrent tumors, according to DESeq FDR-adjusted q-value <0.05. Transcript levels are arranged so as to reflect their relative abundance in normal liver, with those being the most highly expressed (orange) displayed at the top of the heat map and those being the least highly expressed (blue) displayed at the bottom. B, transcripts from A showing absolute relative expression in initial tumors (ordinate) versus recurrent tumors (abscissa). The dotted diagonal line denotes the position on which individual transcripts would lie if each tumor group expressed them equally in comparison with liver. Points lying within region 1, highlighted in yellow, indicate transcripts that were relatively overexpressed in recurrent tumors versus initial tumors; and points in region 2 indicate transcripts that were overexpressed in initial tumors versus recurrent tumors. C, heat map of the 26 transcripts from B lying on or near the ordinate, which were not significantly different between initial tumors and livers but did differ significantly between the two tumor groups. D, results of qRT-PCR analysis of selected transcripts from C. The high intragroup variability seen with Sfxn3 reflects similar results obtained from RNA-seq data that showed a 5.5-fold variation in transcript levels. T, initial tumor; RT, recurrent tumor. See supplemental Table S5 for primer sequences. Each bar represents the mean of triplicate reactions ± S.E.
Fifty nine percent of the transcripts shown in Fig. 7A encoded metabolic enzymes with 21% of these specifically involved in lipid metabolism. The matching of these with individual metabolic pathways pointed to several potential metabolic differences that were at least partially confirmed by experimental data. This included a reduction in total PDH protein levels in recurrent tumors that was consistent with the reduced level of overall enzymatic activity (Fig. 1, C and D).
Finally, an unbiased assessment of the most highly up- and down-regulated transcripts (100 in each group) that distinguished livers and initial tumors (and in which a signal was detectable in each tissue) showed a median up-regulation in tumors of 331-fold (range, 144–3910-fold) and a median down-regulation of 219-fold (range, 95–145,000-fold). Among the former groups of transcripts were those encoding several solute carriers dedicated to amino acid and carnitine transport and synthesis (Slc7a3, Slc7a9, Slc22a16, and Phgdh) and proteins typically confined to transformed, undifferentiated, or stem cells (Dlk2, Afp, Glis1, and Peg10) (supplemental Fig. S6 and supplemental Table S2). Transcripts for insulin-like growth factor 2 (Igf2), the long non-coding RNA H19 and Lin-28B were also up-regulated by 2000-, 3000-, and 1200-fold, respectively (supplemental Table S4). Although not among the top 100 deregulated transcripts, those encoding Igf2bp3 and Igfbp1, which enhance Igf2 translation and stabilize the protein, were increased by 23- and 20-fold, respectively. Similar results were obtained for recurrent tumors (supplemental Table S4) although, as a group, the median fold up-regulation of these top 100 transcripts was only 232-fold (p = 0.012).
Again consistent with the previously noted loss of highly differentiated functions by tumors, the 100 most highly down-regulated transcripts encoded several classes of proteins involved in xenobiotic metabolism (e.g. 17 members of the Cyp450 family and four members of the Ugt family), amino acid catabolism (Ido2 and Tat), solute carriers involved in bile salt and non-amino acid ion transport (14 Slc and Slco transporters), and multiple members of the major urinary protein family (supplemental Fig. S6 and supplemental Table S3). As was the case with up-regulated transcripts, the median down-regulation of these 100 transcripts in recurrent tumors was only 55-fold versus 219-fold (p < 10−4).
To independently confirm at least some of our RNA-seq results using a different method, we used qRT-PCR to compare transcript levels for a subset of the transcripts listed in Fig. 7C. As shown in Fig. 7D, we found excellent agreement with all tested transcripts.
Discussion
These studies demonstrate that the metabolic and molecular alterations associated with HCC pathogenesis and evolution mediated by Myc overexpression occur gradually, sequentially, and cumulatively. The timing and ordering of these events are defined as they are during the course of tumor regression. Finally, we show that recurrence, following a period of tumor regression and sustained quiescence, differs from initial tumors in a number of ways that involve a relatively small number of key genes and pathways.
Whereas initial tumors reached maximal size within 21–28 days, recurrent tumors required about half this time (supplemental Fig. S1A). Potential reasons include an inherently faster tumor growth rate and/or the presence of residual dormant tumor cells that survive after total regression and remain quiescent until being stimulated by Myc re-expression (22). Such cells, not present in naive livers, might represent a particularly susceptible and responsive population, having previously accumulated additional genetic lesions necessary for initial tumor induction but now requiring only Myc re-expression (22). The larger S-phase fraction present in recurrent tumors (supplemental Fig. S1B) is consistent with the former model but does not rule out additional contributing factors. In fact, these studies indicated that initial tumors were almost exclusively diploid or pseudodiploid and thus representative of a subpopulation of hepatocytes that are otherwise of variable ploidy (supplemental Fig. S1B) (23). This is consistent with findings that polyploid hepatocytes tend to have lower replicative capacity, that fetal and embryonic hepatocytes and human HCCs are almost exclusively diploid, and that tumors are often enriched for self-renewing diploid stem cell populations (65–68). Thus, diploid hepatocytes are either more susceptible to Myc-mediated transformation or, more likely, outcompete their hyperdiploid counterparts during tumor expansion, possibly because of their higher stem cell content and/or inherently faster doubling times. Recurrent tumors contained more cells in S-phase than their initial tumor counterparts yet appeared to be more aneuploid (supplemental Fig. S1B), suggesting a causal relationship between these two features and implying that Myc overexpression can lead to aberrant DNA synthesis without intervening mitoses. Increased DNA synthesis without mitosis results in the generation of tetraploid or pseudotetraploid cells, particularly if Tp53 is absent or mutated (37, 38, 69). Inactivation of the p19ARF/MDM2/p53 tumor suppressor pathway appears to be a relatively late event in initial HCC tumorigenesis but persists in recurrent tumors,4 suggesting that aneuploidy may develop following prolonged Myc overexpression in the absence of this protective tumor suppressor background (37, 38). The deregulation of certain cell cycle regulators, particularly cyclin B1 (supplemental Fig. S4), may further enhance the development of tetraploidy (37). Indeed, it is notable that transcripts encoding cyclin B1 and cyclin B2 were the most highly up-regulated of all cyclins in both initial and recurrent tumors (supplemental Fig. S4). Although aneuploidy is not uncommon in human HCCs, neither its relationship to Tp53 mutation/loss nor its prognostic implications have been firmly established (supplemental Fig. S1B) (28, 67, 68, 70).
Both initial and recurrent tumors tended to be associated with increased expression of β-catenin and even higher levels of YAP (Fig. 1A). Although the regulation of Myc by β-catenin and less so by YAP is well known (25, 71), the reverse has been less well studied. A positive autoregulatory loop by which Myc regulates YAP in liver cancer has been described, although it is not clear whether this is a direct consequence of Myc overexpression or instead involves β-catenin as an intermediate (72, 73).
Recent work has documented that most recurrent human cancers are descendants of the initial malignant clonal population but contain additional genetic or epigenetic changes with distinct functional consequences (16, 74–81). However, it remains unclear how and to what extent the emergence and evolution of these recurrent clones are influenced by therapeutic interventions. Moreover, little is known regarding how these newly acquired alterations relate to specific biochemical and metabolic differences between primary and recurrent tumors. The current model allows correlations among these differences while avoiding the confounding factors introduced by genotoxic therapies and permits the identification of what are likely to be only the most relevant and direct changes associated with HCC recurrence.
Although recurrent HCCs are also clonal descendants of the initial tumors (22), we noticed that many of their metabolic and molecular abnormalities were less pronounced relative to those of initial tumors. For example, YAP expression was consistently lower in recurrent tumors, and the levels of β-catenin were virtually indistinguishable from those in control livers. Indeed, even the levels of doxycycline-driven human Myc expression tended to be lower (Fig. 1A and supplemental Fig. S1A). Additionally, the PDH enzymatic activities, ATP levels, and ETC function of recurrent tumors more closely resembled those of normal livers (Figs. 1, D and E, and 2B). Finally, as a group, the most highly deregulated transcripts were less altered in recurrent tumors than in initial tumors (supplemental Tables S2 and S3). In contrast, certain changes were indistinguishable between the two tumor sets, including the dysregulation of Pdk1 and Pdp2, the suppression of FAO, and the down-regulation of the glutamine catabolic pathway (Figs. 1C, supplemental Fig. S2, B and D, and Fig. 5F). Elsewhere, we have shown the loss of p19ARF expression is similar in the two tumor types.4 Collectively, these results indicate that, while growing even more rapidly than initial tumors, recurrent tumors can “normalize” some aspects of their metabolism. This suggests that some of the changes seen in initial tumors are less important for driving the growth of recurrent tumors and/or that they are normalized as a result of compensatory changes in other pathways.
A possible example of such compensatory mechanisms and how they communicate with and reinforce one another may exist with regard to energy production by initial tumors. Despite their high ATP content and PDH activity (Fig. 1, D and E), their overall mitochondrial function was markedly lower than that of normal and proliferatively quiescent livers. This reduced activity was at least partially reflected by a reduction in mitochondrial mass, which we have also witnessed in HBs and is a common feature of many tumor types (Fig. 2B) (30, 32). Moreover, initial tumors demonstrated significantly lower activity of complex II, which serves as the major electron donor in both livers and HCCs (Fig. 1B). In contrast, the levels and activities of ATP, PDH, and complex II in recurrent tumors more closely resembled those of normal liver. It seems likely that the lack of mitochondrially derived ATP in initial tumors is overcompensated for by an increase in glycolysis (the Warburg effect), which also supplies necessary anabolic precursors in the form of glycolytic intermediates. As a result of this metabolic diversion, initial tumor cells may thus be relatively depleted of pyruvate despite being relatively oversupplied with ATP. We have observed a somewhat analogous PDH response in murine HBs induced by the overexpression of mutant forms of β-catenin and YAP, and we have proposed that this might represent an attempt to convert the remaining limiting amounts of pyruvate to AcCoA, which can then either supply the TCA cycle or anabolic pathways (30). Although the precise reason why recurrent HCCs normalize these features remains to be determined, our results demonstrate that, even in the absence of selective pressures such as chemotherapeutic intervention, tumors can reprogram their metabolic circuits to their benefit. Moreover, the nature of these changes appears to be dependent upon the tumor's past history.
One exception to the above-noted metabolic rewiring was the marked reduction in FAO by both initial and recurrent tumors, indicating that fatty acids are not a major source of energy. Rather, it is likely that exogenous fatty acids, such as the palmitate used to conduct these studies, are utilized directly by tumors for de novo lipid biosynthesis rather than being transported into the mitochondria, oxidized to AcCoA, and re-synthesized into lipids. Glutamine does not appear to be directed into the TCA cycle in the form of α-ketoglutarate in either initial or recurrent tumors (Fig. 5, E and F) or in HBs (30), suggesting that glutaminolysis does not compensate for the anabolic diversion of glycolytic intermediates (53). The coordinate up-regulation of numerous transcript encoding transporters for glutamine and other amino acids further supports this notion (supplemental Table S2). In the case of glutamine, however, this interpretation must be made cautiously due to the complex nature of the changes in Gls1 and Gls2 transcripts and proteins. Gls1 is not typically expressed at high levels in liver, whereas Gls2 is a liver-specific isoform (51). However, these relative levels of expression can change in fetal liver as well as in tumors as we and others have demonstrated (Fig. 5, E and F) (51, 52, 82). Despite such changes, the cumulative levels of Gls1 and Gls2 transcripts in tumors were reduced by ∼40% in tumors (Fig. 5E). It is also noteworthy that high levels of Gls2 expression have recently been shown to impede the growth of HCCs, thereby suggesting that diverting the supply of glutamine too much in favor of catabolic rather than anabolic pathways can be detrimental to tumor growth (83). In Myc-induced HCCs similar to those described here, Yuneva et al. (82), have shown total glutaminase activity to be increased in isolated mitochondria under conditions that provided maximal levels of glutamine and other TCA cycle substrates. However, that same study was unable to measure intratumoral glutamine levels, leaving open the possibility that low levels of the amino acid reflect its immediate use for de novo protein synthesis. High levels of enzyme activity therefore could reflect a compensatory response to a relative glutamine deficit without necessarily increasing the rate of conversion of glutamine to glutamate. Similarly increased demands on glutamate for protein synthetic purposes might further impair the ultimate conversion of glutamine to α-ketoglutarate.
The uncoupling of complex II's electron transport function from Sdha's catalytic activity in initial tumors, and beginning quite early after Myc induction (Fig. 2, B and C), leaves open the possibility that other amino acids such as valine, isoleucine, and methionine may circumvent the glutamine degradation pathway and furnish succinate, thus providing an alternative source of electrons in the form of FAD. However, such a compensatory pathway, particularly when considered in light of the overall lower rate of Oxphos in initial tumors (Fig. 2B) (30), would be expected to extract a metabolic cost in the form of enhanced ROS production as the electrons generated during the succinate to fumarate conversion are now donated to non-physiological acceptors such as molecular oxygen (34). It will be of interest in future work to determine whether the uncoupling of SDH represents the primary means by which Myc overexpression generates ROS (36–38, 40).
Only 157 transcripts were deregulated in response to Myc overexpression at the earliest time point examined (D3) with the vast majority of these (144 (92%)) being involved in cell cycle control, DNA damage response, and DNA repair (Fig. 3, A and B, and supplemental Fig. S4). Indeed, within the cell cycle super pathway (Fig. 3B) was a component IPA-derived member pathway designated “p53 signaling,” 9 of whose 111 members were up-regulated with none being down-regulated. Three of these component transcripts (Tnfrsf10b, Apaf, and Birc5) encoded proteins involved in the regulation of apoptosis, whereas the remaining six (Brca1, Chek1, Chek2, Pcna, Topbp1, and E2f1) encoded proteins involved in DNA damage and cell cycle arrest by virtue of their communication with TP53.
The numerous transcripts encoding hematopoietic chemokines and cytokines expressed by D7 livers correlated with a pronounced acute inflammatory infiltrate. Although tumor cells themselves can express similar factors for purposes such as angiogenesis (84, 85), it seems more likely that the ones we have identified were in fact of hematopoietic origin. The inflammatory infiltrate may arise as a result of hepatocyte death mediated by Myc overexpression, local necrosis, and/or from the expression of neo-antigens arising from ongoing mutations induced by replication errors, chromosomal breaks, and ROS production (36–38, 40, 86, 87). The absence of such an infiltrate in the livers of mice with previously regressed tumors following an otherwise identical 7-day re-induction of Myc (Fig. 4B), indicates either that the initial intrahepatic stimulus that prompted the inflammatory infiltrate was no longer present or that hematopoietic cells were unresponsive. Although we did not perform RNA-seq on this particular cohort, the presence of a similar pattern of immune-related transcript dysregulation in both initial and recurrent tumors (Fig. 4A) suggests that the rate of hematopoietic infiltration during the re-induction phase may be slower relative to that of the initial induction phase.
Relevant to these findings is a recent report by Guo et al. (88) who utilized a different murine HCC model induced by the hydrodynamic tail injection of mutant YAP. Although these animals do not develop tumors until 12–16 weeks, the homing of macrophages to YAP+ tumor-initiating hepatocytes could be detected as early as 2 days post-injection and well before the development of any discernible tumors. Eliminating these macrophages strongly inhibited tumorigenesis. The authors speculated that these macrophages play a decisive role in the survival of single tumor-initiating cells in vivo by inhibiting their clearance and facilitating their expansion. Our failure to detect macrophages after tumor re-induction suggests that they may no longer be needed because previously selected tumor-initiating cells from the initial tumor persist during regression and need not be generated anew (22). A similar phenomenon with regard to mast cell recruitment, as well as macrophage infiltration, in a Myc-driven model of pancreatic islet cell tumors has also been described (89). Taken together, these findings suggest that both Myc and non-Myc-driven tumors may participate in a symbiotic relationship with the innate immune system.
Igf2 and H19, both of which were highly up-regulated in initial and recurrent tumors (supplemental Table S4) are imprinted and physically adjacent loci but are independently transcribed from paternal and maternal alleles, respectively. Both are highly expressed in some human fetal tissues and in lung cancer, Wilms' tumor, and HCC, with IGF2 being a particularly potent driver of the latter (90–93). H19 is a direct Myc target as is Lin-28b, which positively regulates Igf2 expression (20, 94). Lin-28b also down-regulates several let-7 micro-RNAs with tumor suppressor functions (95). Although not as highly up-regulated as transcripts for Igf2, H19, and Lin-28b, those encoding Igfbp1 and Igf2bp3 were also up-regulated significantly in both initial and recurrent tumors (20- and 23-fold, respectively). Igfbp1 binds to and prolongs the serum half-life of Igf2, and both it and Igf2bp3, which binds to and stabilizes Igf2 mRNA, have been reported to drive cancer growth and to be associated in some cases with an adverse prognosis (96). In contrast, Igfbp5 and Igfbp7, which were down-regulated in HCCs by 5- and 2-fold, respectively, are negative regulators of IGF2 and thus possess potential tumor suppressor functions (97–99). These findings, together with the 25-fold down-regulation of Igf1 transcripts (supplemental Table S4), support the idea that HCC tumor growth is at least supported by, if not entirely dependent upon, complex and coordinate activities of members of the H19-Igf2 axis.
In summary, our analyses identified a number of molecular, metabolic, and biochemical pathways that are perturbed and/or re-programmed over the course of HCC tumor evolution in response to a single oncogenic stimulus (Myc). Importantly, this has enabled us to capture some of the earliest events that respond to Myc overexpression, including the induction of many cell cycle-regulated and DNA repair genes and the reprogramming of specific metabolic pathways, all of which occur prior to any changes in liver mass or appearance. Some of these deregulated pathways, particularly those pertaining to glycolysis and glutaminolysis, have been previously identified at the transcriptional level (24). By examining the fate of [13C]pyruvate during the course of tumor evolution, that study also showed that this end-stage glycolytic intermediate is first converted into alanine during the earliest pre-neoplastic stages of Myc induction but that, at later times, and as glycolysis becomes a primary mode of providing energy and anabolic substrates, pyruvate is re-directed into lactate production (24). This study adds to the molecular, biochemical, and metabolic changes that accompany evolution, regression, and recurrence by integrating these and additional pathways, particularly those pertaining to fatty acid and pyruvate oxidation and mitochondrial oxidative phosphorylation, electron transport chain function, and the adaptation of mitochondrial mass to accommodate these changes. The analyses of initial, regressing, and recurrent tumors are also unencumbered by the confounding factors that would otherwise be introduced in response to chemotherapeutic interventions. Approaches of this type should be useful for the evaluation of other tumor models.
Experimental procedures
Animals
All animal studies were reviewed and approved by the University of Pittsburgh Institutional Animal Care and Use Committee. FVB/N-Tg(tetO-MYC)36aBop/J and LAP-tTA mice (B6.Cg-Tg[Cebpb-tTA]5Bjd/J) (The Jackson Laboratory) (22) were genotyped according to published protocols and as recommended by the vendor (31). Animals were housed and fed ad libitum except that drinking water contained doxycycline (100 μg/ml) unless otherwise stated. For tumor induction studies, six groups of 3–4-week-old male and female mice were provided with doxycycline-free water. Three and 7 days later (D3 and D7), well before the appearance of any tumors, two groups of mice were sacrificed. Liver samples were flash-frozen for molecular and biochemical analyses or used immediately for enzymatic and metabolic assays requiring fresh tissues. The remaining mice were maintained off doxycycline for a further 3–4 weeks by which time all had developed large and aggressive HCCs. One group was sacrificed and used to duplicate the above studies, and the remaining three groups were again provided doxycycline-containing drinking water to suppress Myc expression and initiate tumor regression. Regressing tumors were then sampled 3 and 7 days later (R3 and R7 groups), at which point they were at least 50% smaller. Doxycycline was maintained for an additional 2–3 months in the remaining group and was then again removed to induce recurrence.
Cell cycle analysis
Excised tissue was fractionated with a NE-PER isolation kit using the directions provided by the supplier (Thermo Fisher Scientific, Rockford, IL). Tissue was first washed with ice-cold PBS, minced into small pieces, then homogenized in cytoplasmic extraction buffer (∼100 mg tissue/1 ml of buffer), and passed through a 70-μm nylon mesh cell strainer (Thermo Fisher Scientific, Pittsburgh, PA). Homogenates were then centrifuged at 500 × g for 5 min at 4 °C; the resultant pellet was the nuclear fraction. The final nuclear pellet was resuspended in 1 ml of ice-cold 10 mm Tris-HCl, pH 8.0; 10 mm NaCl; 0.1% Nonidet P-40; 0.07 mm propidium iodide (Sigma). RNase A (Sigma) was added to a final concentration of 10 μg/ml, and the nuclei were incubated on ice for 10–15 min. Flow cytometry and downstream analyses were performed as described previously (99).
PDH assays and ATP assays
PDH complex activity on fresh tissue samples was determined as described previously (30). Briefly, ∼50 mg of tissue was minced in ice-cold DMEM lacking glucose, pyruvate, and glutamine and gently homogenized by several rounds of passage through an 18-gauge needle. 0.5-ml aliquots were then placed into 0.5 ml of 2× assay buffer (30) containing 0.075 μCi of [1-14C]pyruvate (PerkinElmer Life Sciences). The rubber stoppers used to seal the tubes contained a central hanging basket (Kimble-Chase Life Science and Research Products, Rockwood, TN) with a 25-mm glass microfiber filter (Whatman/GE Healthcare) saturated with 0.5 m KOH. Reactions were incubated at 37 °C with continuous motion and terminated by injecting 0.5 ml of 4.0 m perchloric acid through the stopper. 14CO2 was collected onto the filters for 40 min at 37 °C and quantified by scintillation counting.
ATP levels were quantified on tissue lysates using the ATP Lite ATP detection system (PerkinElmer Life Sciences) according to the instructions of the supplier. Each point was assayed in at least triplicate and then normalized to protein content. All points were then expressed relative to the ATP levels measured in control liver tissues (30). Tissues from at least five animals were assayed for each time point.
Fatty acid β-oxidation and glutaminase assays
FAO was measured as described previously (30, 31). Briefly, ∼50 mg of tissue was minced in SET buffer and gently disrupted with a Potter-Elvehjem homogenizer on ice. Triplicate ∼5-μl aliquots of the homogenate were added to 195 μl of FAO reaction buffer containing 1 μCi of BSA-conjugated 3H-labeled palmitate (PerkinElmer Life Sciences) (30, 31) and incubated for various times at 37 °C. Reactions were terminated by adding 40 μl of 1 m KOH, and newly synthesized acyl-carnitine esters were hydrolyzed at 60 °C for 1 h. 40 μl of 4 mm perchloric acid was added for an additional hour on ice. After organic extraction, the water-soluble 3H-labeled FAO products were quantified by scintillation counting.
Immunoblotting
Western blotting was performed as described previously (30, 31, 100) with at least 4–5 independent groups of tissues as indicated in the appropriate figures and supplemental figures. All antibodies, their sources, and conditions for their use are listed in supplemental Table S1. Quantification of Western blotting band densities was performed using ImageJ 1.50 (101). Relative band densities are reported in supplemental Table S6 relative to liver, except for blots with no detectable liver band.
Measurements of Oxphos
Respirometry studies were performed as described previously (30, 31). For all measurements, livers from littermate control mice of approximately the same age were evaluated in parallel. Briefly, ∼50 mg of tissue was disrupted in ice-cold MiR05 buffer. 300 μg of the lysate was then used to quantify OCR using an Oroboros Oxygraph 2k instrument (Oroboros Instruments, Inc., Innsbruck, Austria). Following cytochrome c addition to stabilize mitochondrial membranes (31), malate, pyruvate, ADP, and glutamate were sequentially added to initiate electron flow via complex I followed by the addition of succinate to measure the combined activities of ETC complexes I + II. Rotenone was then added (0.5 μm final concentration) to inhibit complex I and to allow for the quantification of pure complex II activity. Final activities were normalized to total protein content.
BNGE and in situ enzymatic assays
BNGE and visualization of ETC complexes by non-denaturing gel electrophoresis was performed as described previously (31, 100, 102). Briefly, purified complexes were electrophoresed on a 3–12% gradient native PAGE Novex BisTris gel (Invitrogen) using the buffer provided, stained with Bio-Safe Coomassie G-250 (Bio-Rad), and then de-stained with water. Band intensities were quantified using an AlphaEase FC2200 scanner and software (Alpha Innotech, Inc., San Leandro, CA). In situ enzymatic assays were performed for complex I (NADH ubiquinone oxidoreductase), complex III (decylubiquinol cytochrome c oxidoreductase), complex IV (cytochrome c oxidase), and complex V (ATPase) as described previously (30, 31, 100). Band intensities were quantified using ImageJ software (National Institutes of Health) (101) and normalized to their corresponding bands on the Coomassie-stained gel. Because in situ assays for complex II (succinate dehydrogenase) were poorly reproducible, measurements were performed in vitro on total lysates (100). Enzymatic activities were assessed at 1-min intervals over a span of 1 h on a BMG LabTech FLUOstar Omega spectrophotometer (500 nm) (Cary, NC). ΔA340/min was obtained using the maximum linear rate over a period of 20 min.
Mitochondrial DNA (mtDNA) quantification
Cellular DNAs were purified from all samples, and mtDNA was quantified with a TaqMan-based assay, as described previously (30, 103), using two separate sets of PCR primers designed to amplify short segments of the cytochrome c oxidase I gene (probe set 1) and the D-loop region (probe set 2), respectively. PCR products were normalized to a similarly sized product of the nuclear apolipoprotein B gene in a parallel reaction. All primers and probes were synthesized by IDT, Inc. (Coralville, IA).
RNA purification, RNA-seq, and qRT-PCR
RNA-seq acquisition and data analyses have been previously described (30, 31). Briefly, liver and tumor RNAs (five samples per time point) were purified using RNA Easy columns (Qiagen, Inc., Valencia, CA). RNA concentrations were determined with a Nanodrop ND-1000 instrument (NanoDrop Technologies Inc., Wilmington, DE), and RNA integrity was assessed with an Agilent 2100 Bioanalyzer (Agilent Technologies, Santa Clara, CA). Single-end sequencing was performed on an Illumina NextSeq 500 sequencer (Illumina, Inc., San Diego). Read counts were normalized across samples and assessed for significance using DESeq, which determined transcript abundance (expressed as RPKM) and statistical significance when comparing transcript abundance levels between experimental groups and control liver (FDR-adjusted q-value < 0.05). Heat maps of specific gene sets were generated by comparing expression values in each experimental group to control liver, expressed as log2-transformed fold-change.
Pathway analysis for each experimental group was performed using IPA (www.qiagen.com/ingenuity). A maximum of 5000 genes could be accommodated by the IPA program at any given time; thus, the following criteria were used in the experimental groups to select genes for pathway analysis: D3 versus liver, 266 significant differences (selected criteria included q-value <0.05 (266 genes)); D7 versus liver, 742 significant differences (selected criteria included q-value <0.05 (742 genes)); initial tumor versus liver, 8846 significant differences (selected criteria included q-value <0.01 and |log2-fold change| >1.4 (4801 genes)); R3 versus liver, 6299 significant differences (selected criteria included q-value <0.01 (4774 genes)); R7 versus liver, 4182 significant differences (selected criteria included q-value <0.05 (4182 genes)); recurrent tumor versus liver; 8848 significant differences (selected criteria included q-value <0.01 and |log2-fold change| >1.3 (4796 genes).
Significant pathways were identified by a Bonferonni-Hochberg corrected (FDR-adjusted) p value of <0.01. For each pathway in each experimental group, the following were recorded for later display: overall significance (p value), ratio of dysregulated genes in the experimental sample compared with all possible genes associated with that pathway (ratio), and predicted pathway activation or inhibition (Z-score, where applicable). Not all pathways included the ability to estimate a Z-score.
Following the above analyses, pathways were grouped into 13 larger super pathways using IPA's category classification scheme. This included such broad groups as cancer signaling/proliferation, small molecule biochemistry, and apoptosis. RXR, LXR, and FXR signaling pathways were combined with those involving lipid metabolism into the larger super pathway termed RXR signaling/lipid metabolism. Although some pathways could be classified into more than one super pathway (e.g. many cancer-related pathways could be classified into both DNA damage and cancer signaling/proliferation), the final inclusion was based on the first-listed IPA category under the category description.
To compare initial and recurrent tumors in an unbiased manner, the top and bottom 100 expressed transcripts in initial tumors were compared with the same transcripts in recurrent tumors. Mean and median expression were compared between the two groups, the former of which was formally tested for significance with a one-sided t test assuming unequal variance.
qRT-PCR analyses were performed for a small subset of relevant transcripts to confirm the results obtained by RNA-seq. For these analysis, we used a Power SYBR Green RNA-to-CtTM 1 Step kit (Applied Biosystems, Inc., Foster City, CA) using the conditions recommended by the supplier. PCR primers were synthesized by IDT, Inc. (Coralville, IA). Sequences of these primers and the conditions used for amplification are listed in supplemental Table S5. All qRT-PCRs were performed with an Applied Biosystems Step One Plus Real Time PCR System.
Transcriptional profiling of human HCCs and livers
Gene expression data for human HCCs were obtained from The Cancer Genome Atlas (TCGA) using the University of California Santa Cruz Xena Browser (UCSC Xena, http://xena.ucsc.edu). Data were stored under the cohort name “TCGA Liver Cancer (LIHC)” with the data tag “gene expression RNA-seq (poly(A)+ IlluminaHiSeq).” MYC gene amplification data were accessed via the data tag “copy number (gistic2ṫhresholded)” and queried for “Myc.” Tissues and normal tissues were identified with the data tag “phenotypes − sample type.” Heat maps of gene expression were generated by comparing average gene expression in each group [MYC-amplified (High Myc) and MYC-non-amplified (Low Myc)] to the average gene expression in normal tissues.
Isolation and antibody labeling of liver-associated leukocytes
Fresh livers were finely minced and disrupted by pressing through a 70 μm nylon mesh screen into 20 ml of ice-cold PBS. 10 ml of 100% Percoll (GE Healthcare Biosciences, Pittsburgh, PA) and 300 units heparin (Thermo Fisher Scientific, Hampton, NH) were then added. The homogenate was centrifuged at 800 × g for 20 min at 22 °C, after which the supernatant was aspirated, and red blood cells were eliminated by incubating for 3 min in ammonium chloride lysis buffer. Cells from the Percoll phase were washed once in FACS buffer (2% FBS in PBS), passed through a 40 μm mesh screen, and enumerated on a Vi-cell cell viability analyzer (Beckman Coulter, Inc. Brea, CA).
Leukocytes were labeled for flow cytometry by first blocking the Fc receptor with anti-mouse CD16/CD32 (BD Biosciences) for 5 min at 4 °C and then incubating with the antibodies listed in supplemental Table S1 for 15 min at 4 °C. Viable cells were enumerated using a Live/Dead Fixable Aqua staining for 30 min according to the manufacturer's instructions (Thermo Fisher Scientific), followed by two washes in FACS buffer and data acquisition on an LSRII Fortessa (BD Biosciences). For intracellular staining, cells were stimulated with lipopolysaccharide (1 μg/ml) for 4 h in the presence of brefeldin A (10 μg/ml), followed by extracellular antigen staining and intracellular fixation and permeabilization as directed (Affymetrix/eBioscience, San Diego). Flow data were analyzed using Flowjo Version 10.0 (Tree Star, Ashland OR).
Statistics
GraphPad Prism 7 (GraphPad Software, Inc., La Jolla, CA) and Stata SE (StataCorp LP, College Station, TX) were used for all statistical tests. Relative PDH activity was compared between groups with analysis of variance (ANOVA) and Brown-Forsythe tests to check for unequal variance, and each group was compared with control liver with two-sided t tests with Welch's correction due to heteroskedasticity and Bonferroni correction to control for false discovery (adjusted α = 0.0083̄) (Fig. 1D). ATP content was compared among groups with ANOVA, Brown-Forsythe tests, and Tukey's multiple comparisons two-sided t tests (Fig. 1E). Relative mitochondrial DNA content was compared with ANOVA, Brown-Forsythe, and Tukey's multiple comparisons two-sided t tests (Fig. 2A). OCR for complex I and II were compared between each experimental group and control liver using non-parametric Mann-Whitney U tests, as data were not normally distributed (Fig. 2B). BNGE in situ enzymatic assay activity was compared between experimental groups with ANOVA, Brown-Forsythe tests, and Dunnett's multiple comparisons two-sided t tests. Complex II SDH activity was log-transformed to satisfy the equal-variance requirement of the ANOVA test; after log transformation, the Brown-Forsythe p value was 0.0681 (Fig. 2C). FAO was compared between experimental groups with ANOVA, Brown-Forsythe, and Tukey's multiple comparisons two-sided t tests (Fig. 2D). Total immune cell population differences were compared with a two-way ANOVA and Dunnett's multiple comparisons two-sided t tests (Fig. 4B). Percent IL-10 positivity was compared with an F-test to ensure homogeneity of variance and a two-sided t test assuming homoskedasticity (Fig. 4C). Statistically significant differences for RNA-seq data were defined as FDR-adjusted q-value of < 0.05, as provided by the DESeq software package and as described previously (Fig. 7) (28, 29). S-phase content was compared between liver and tumors with ANOVA, Brown-Forsythe, and Tukey's multiple comparisons two-sided t tests (supplemental Fig. S1). Expression differences in the top and bottom 100 transcripts between initial and recurrent tumors were compared with non-parametric Mann-Whitney U tests, as expression levels for these transcripts were not normally distributed (supplemental Fig. S6). Degrees of dysregulation (absolute value of fold-change in tumors relative to normal liver) between Myc-amplified and non-Myc-amplified human HCCs were compared with Wilcoxon signed-rank tests, as data were not normally distributed. All error bars in figures represent mean ± S.E.
Study approval
All animal studies were reviewed and approved by the University of Pittsburgh Institutional Animal Care and Use Committee, IACUC No. 14104886.
Author contributions
J. M. D., H. W., S. K., L. J., J. L., S. B., and K. B. performed, analyzed, and interpreted experiments. J. M. D. developed software and analyzed data sets. E. S. G. and C. A. B. analyzed and interpreted data. S. R. performed histopathologic examinations. E. V. P. devised experiments, supervised and coordinated research, and analyzed and interpreted data. E. V. P. and J. M. D. wrote the paper.
Supplementary Material
Acknowledgments
We thank Paul S. Monga and Panayiotis V. Benos for helpful discussions.
This work was supported by National Institutes of Health Grants R01CA174713 (to E. V. P.), R01DK090242 (to E. S. G.), and K08HL123631 (to C. A. B.). The authors declare that they have no conflicts of interest with the contents of this article. The content is solely the responsibility of the authors and does not necessarily represent the official views of the National Institutes of Health.
RNA-seq data have been deposited in the ArrayExpress database at EMBL-EBI under accession number E-MTAB-5722.
This article contains supplemental Figs. S1–S7 and Tables S1–S6.
S. Kulkarni, J. M. Dolezal, H. Wang, L. Jackson, J. Lu, B. Frodey, A. Dosunmuu-Ogunbi, Y. Li, M. Fromherz, A. Kang, L. Santana-Santos, P. V. Benos, and E. V. Prochownik, manuscript in preparation.
- HCC
- hepatocellular carcinoma
- HB
- hepatoblastoma
- BNGE
- blue native gel electrophoresis
- oxphos
- oxidative phosphorylation
- ETC
- electron transport chain
- FAO
- fatty acid oxidation
- OCR
- O2 consumption rate
- ROS
- reactive oxygen species
- ANOVA
- analysis of variance
- FDR
- false-discovery rate
- PDH
- pyruvate dehydrogenase
- IPA
- Ingenuity Pathway Analysis
- AcCoA
- acetyl coenzyme A
- TCA
- tricarboxylic acid
- BisTris
- 2-[bis(2-hydroxyethyl)amino]-2-(hydroxymethyl)propane-1,3-diol
- BNGE
- Blue native gel electrophoresis
- RNA-seq
- RNA sequence
- FDR
- false discovery rate
- RPKM
- reads per kilobase per million
- SDH
- succinate dehydrogenase
- mTOR
- mechanistic target of rapamycin
- qRT
- quantitative RT'
- RXR
- retinoid X receptor
- LXR
- liver X receptor
- FXR
- farnesoid X receptor
- PXR
- pregnane X receptor.
References
- 1. El-Serag H. B. (2011) Hepatocellular carcinoma. N. Engl. J. Med. 365, 1118–1127 [DOI] [PubMed] [Google Scholar]
- 2. Forner A., Llovet J. M., and Bruix J. (2012) Hepatocellular carcinoma. Lancet 379, 1245–1255 [DOI] [PubMed] [Google Scholar]
- 3. Grandhi M. S., Kim A. K., Ronnekleiv-Kelly S. M., Kamel I. R., Ghasebeh M. A., and Pawlik T. M. (2016) Hepatocellular carcinoma: from diagnosis to treatment. Surg. Oncol. 25, 74–85 [DOI] [PubMed] [Google Scholar]
- 4. Okuda K., Ohtsuki T., Obata H., Tomimatsu M., Okazaki N., Hasegawa H., Nakajima Y., and Ohnishi K. (1985) Natural history of hepatocellular carcinoma and prognosis in relation to treatment. study of 850 patients. Cancer 56, 918–928 [DOI] [PubMed] [Google Scholar]
- 5. Torre L. A., Bray F., Siegel R. L., Ferlay J., Lortet-Tieulent J., and Jemal A. (2015) Global cancer statistics, 2012. CA Cancer J. Clin. 65, 87–108 [DOI] [PubMed] [Google Scholar]
- 6. Greten T. F., Papendorf F., Bleck J. S., Kirchhoff T., Wohlberedt T., Kubicka S., Klempnauer J., Galanski M., and Manns M. P. (2005) Survival rate in patients with hepatocellular carcinoma: a retrospective analysis of 389 patients. Br. J. Cancer 92, 1862–1868 [DOI] [PMC free article] [PubMed] [Google Scholar]
- 7. Dragani T. A. (2010) Risk of hcc: genetic heterogeneity and complex genetics. J. Hepatol. 52, 252–257 [DOI] [PubMed] [Google Scholar]
- 8. Riegler J. L. (1996) Preneoplastic conditions of the liver. Semin. Gastrointest. Dis. 7, 74–87 [PubMed] [Google Scholar]
- 9. Giordano S., and Columbano A. (2014) Met as a therapeutic target in hcc: facts and hopes. J. Hepatol. 60, 442–452 [DOI] [PubMed] [Google Scholar]
- 10. Schulze K., Nault J. C., and Villanueva A. (2016) Genetic profiling of hepatocellular carcinoma using next-generation sequencing. J. Hepatol. 65, 1031–1042 [DOI] [PubMed] [Google Scholar]
- 11. Tornesello M. L., Buonaguro L., Tatangelo F., Botti G., Izzo F., and Buonaguro F. M. (2013) Mutations in tp53, ctnnb1 and pik3ca genes in hepatocellular carcinoma associated with hepatitis b and hepatitis c virus infections. Genomics 102, 74–83 [DOI] [PubMed] [Google Scholar]
- 12. Valero V. 3rd., Pawlik T. M., and Anders R. A. (2015) Emerging role of hpo signaling and yap in hepatocellular carcinoma. J. Hepatocel. Carcinoma 2, 69–78 [DOI] [PMC free article] [PubMed] [Google Scholar]
- 13. Jung K. Y., Wang H., Teriete P., Yap J. L., Chen L., Lanning M. E., Hu A., Lambert L. J., Holien T., Sundan A., Cosford N. D., Prochownik E. V., and Fletcher S. (2015) Perturbation of the c-myc-max protein-protein interaction via synthetic α-helix mimetics. J. Med. Chem. 58, 3002–3024 [DOI] [PMC free article] [PubMed] [Google Scholar]
- 14. Tao J., Calvisi D. F., Ranganathan S., Cigliano A., Zhou L., Singh S., Jiang L., Fan B., Terracciano L., Armeanu-Ebinger S., Ribback S., Dombrowski F., Evert M., Chen X., and Monga S. P. (2014) Activation of β-catenin and yap1 in human hepatoblastoma and induction of hepatocarcinogenesis in mice. Gastroenterology 147, 690–701 [DOI] [PMC free article] [PubMed] [Google Scholar]
- 15. Vilchez V., Turcios L., Marti F., and Gedaly R. (2016) Targeting wnt/β-catenin pathway in hepatocellular carcinoma treatment. World J. Gastroenterol. 22, 823–832 [DOI] [PMC free article] [PubMed] [Google Scholar]
- 16. Xu X. L., Xing B. C., Han H. B., Zhao W., Hu M. H., Xu Z. L., Li J. Y., Xie Y., Gu J., Wang Y., and Zhang Z. Q. (2010) The properties of tumor-initiating cells from a hepatocellular carcinoma patient's primary and recurrent tumor. Carcinogenesis 31, 167–174 [DOI] [PubMed] [Google Scholar]
- 17. Kawate S., Fukusato T., Ohwada S., Watanuki A., and Morishita Y. (1999) Amplification of c-myc in hepatocellular carcinoma: correlation with clinicopathologic features, proliferative activity and p53 overexpression. Oncology 57, 157–163 [DOI] [PubMed] [Google Scholar]
- 18. Nesbit C. E., Tersak J. M., and Prochownik E. V. (1999) Myc oncogenes and human neoplastic disease. Oncogene 18, 3004–3016 [DOI] [PubMed] [Google Scholar]
- 19. Schlaeger C., Longerich T., Schiller C., Bewerunge P., Mehrabi A., Toedt G., Kleeff J., Ehemann V., Eils R., Lichter P., Schirmacher P., and Radlwimmer B. (2008) Etiology-dependent molecular mechanisms in human hepatocarcinogenesis. Hepatology 47, 511–520 [DOI] [PubMed] [Google Scholar]
- 20. Alajez N. M., Shi W., Wong D., Lenarduzzi M., Waldron J., Weinreb I., and Liu F. F. (2012) Lin28b promotes head and neck cancer progression via modulation of the insulin-like growth factor survival pathway. Oncotarget 3, 1641–1652 [DOI] [PMC free article] [PubMed] [Google Scholar]
- 21. Santoni-Rugiu E., Jensen M. R., Factor V. M., and Thorgeirsson S. S. (1999) Acceleration of c-myc-induced hepatocarcinogenesis by co-expression of transforming growth factor (tgf)-α in transgenic mice is associated with tgf-β1 signaling disruption. Am. J. Pathol. 154, 1693–1700 [DOI] [PMC free article] [PubMed] [Google Scholar]
- 22. Shachaf C. M., Kopelman A. M., Arvanitis C., Karlsson A., Beer S., Mandl S., Bachmann M. H., Borowsky A. D., Ruebner B., Cardiff R. D., Yang Q., Bishop J. M., Contag C. H., and Felsher D. W. (2004) Myc inactivation uncovers pluripotent differentiation and tumour dormancy in hepatocellular cancer. Nature 431, 1112–1117 [DOI] [PubMed] [Google Scholar]
- 23. Duncan A. W. (2013) Aneuploidy, polyploidy and ploidy reversal in the liver. Semin. Cell Dev. Biol. 24, 347–356 [DOI] [PubMed] [Google Scholar]
- 24. Hu S., Balakrishnan A., Bok R. A., Anderton B., Larson P. E., Nelson S. J., Kurhanewicz J., Vigneron D. B., and Goga A. (2011) 13C-pyruvate imaging reveals alterations in glycolysis that precede c-myc-induced tumor formation and regression. Cell Metab. 14, 131–142 [DOI] [PMC free article] [PubMed] [Google Scholar]
- 25. Turato C., Cannito S., Simonato D., Villano G., Morello E., Terrin L., Quarta S., Biasiolo A., Ruvoletto M., Martini A., Fasolato S., Zanus G., Cillo U., Gatta A., Parola M., and Pontisso P. (2015) Serpinb3 and yap interplay increases myc oncogenic activity. Sci. Rep. 5, 17701. [DOI] [PMC free article] [PubMed] [Google Scholar]
- 26. Xu M. Z., Yao T. J., Lee N. P., Ng I. O., Chan Y. T., Zender L., Lowe S. W., Poon R. T., and Luk J. M. (2009) Yes-associated protein is an independent prognostic marker in hepatocellular carcinoma. Cancer 115, 4576–4585 [DOI] [PMC free article] [PubMed] [Google Scholar]
- 27. Patel M. S., and Korotchkina L. G. (2001) Regulation of mammalian pyruvate dehydrogenase complex by phosphorylation: complexity of multiple phosphorylation sites and kinases. Exp. Mol. Med. 33, 191–197 [DOI] [PubMed] [Google Scholar]
- 28. Chiu J. H., Kao H. L., Wu L. H., Chang H. M., and Lui W. Y. (1992) Prediction of relapse or survival after resection in human hepatomas by DNA flow cytometry. J. Clin. Invest. 89, 539–545 [DOI] [PMC free article] [PubMed] [Google Scholar]
- 29. Saunier E., Benelli C., and Bortoli S. (2016) The pyruvate dehydrogenase complex in cancer: an old metabolic gatekeeper regulated by new pathways and pharmacological agents. Int. J. Cancer 138, 809–817 [DOI] [PubMed] [Google Scholar]
- 30. Wang H., Lu J., Edmunds L. R., Kulkarni S., Dolezal J., Tao J., Ranganathan S., Jackson L., Fromherz M., Beer-Stolz D., Uppala R., Bharathi S., Monga S. P., Goetzman E. S., and Prochownik E. V. (2016) Coordinated activities of multiple myc-dependent and myc-independent biosynthetic pathways in hepatoblastoma. J. Biol. Chem. 291, 26241–26251 [DOI] [PMC free article] [PubMed] [Google Scholar]
- 31. Edmunds L. R., Otero P. A., Sharma L., D'Souza S., Dolezal J. M., David S., Lu J., Lamm L., Basantani M., Zhang P., Sipula I. J., Li L., Zeng X., Ding Y., Ding F., et al. (2016) Abnormal lipid processing but normal long-term repopulation potential of myc−/− hepatocytes. Oncotarget 7, 30379–30395 [DOI] [PMC free article] [PubMed] [Google Scholar]
- 32. Reznik E., Miller M. L., Şenbabaoğlu Y., Riaz N., Sarungbam J., Tickoo S. K., Al-Ahmadie H. A., Lee W., Seshan V. E., Hakimi A. A., and Sander C. (2016) Mitochondrial DNA copy number variation across human cancers. Elife 5, e10769. [DOI] [PMC free article] [PubMed] [Google Scholar]
- 33. Han S., Auger C., Castonguay Z., Appanna V. P., Thomas S. C., and Appanna V. D. (2013) The unraveling of metabolic dysfunctions linked to metal-associated diseases by blue native polyacrylamide gel electrophoresis. Anal. Bioanal. Chem. 405, 1821–1831 [DOI] [PubMed] [Google Scholar]
- 34. Tretter L., Patocs A., and Chinopoulos C. (2016) Succinate, an intermediate in metabolism, signal transduction, ros, hypoxia, and tumorigenesis. Biochim. Biophys. Acta 1857, 1086–1101 [DOI] [PubMed] [Google Scholar]
- 35. Felsher D. W., and Bishop J. M. (1999) Transient excess of myc activity can elicit genomic instability and tumorigenesis. Proc. Natl. Acad. Sci. U.S.A. 96, 3940–3944 [DOI] [PMC free article] [PubMed] [Google Scholar]
- 36. Vafa O., Wade M., Kern S., Beeche M., Pandita T. K., Hampton G. M., and Wahl G. M. (2002) c-myc can induce DNA damage, increase reactive oxygen species, and mitigate p53 function: a mechanism for oncogene-induced genetic instability. Mol. Cell 9, 1031–1044 [DOI] [PubMed] [Google Scholar]
- 37. Yin X. Y., Grove L., Datta N. S., Katula K., Long M. W., and Prochownik E. V. (2001) Inverse regulation of cyclin b1 by c-myc and p53 and induction of tetraploidy by cyclin b1 overexpression. Cancer Res. 61, 6487–6493 [PubMed] [Google Scholar]
- 38. Yin X. Y., Grove L., Datta N. S., Long M. W., and Prochownik E. V. (1999) c-Myc overexpression and p53 loss cooperate to promote genomic instability. Oncogene 18, 1177–1184 [DOI] [PubMed] [Google Scholar]
- 39. Mannava S., Grachtchouk V., Wheeler L. J., Im M., Zhuang D., Slavina E. G., Mathews C. K., Shewach D. S., and Nikiforov M. A. (2008) Direct role of nucleotide metabolism in c-myc-dependent proliferation of melanoma cells. Cell Cycle 7, 2392–2400 [DOI] [PMC free article] [PubMed] [Google Scholar]
- 40. Egler R. A., Fernandes E., Rothermund K., Sereika S., de Souza-Pinto N., Jaruga P., Dizdaroglu M., and Prochownik E. V. (2005) Regulation of reactive oxygen species, DNA damage, and c-myc function by peroxiredoxin 1. Oncogene 24, 8038–8050 [DOI] [PubMed] [Google Scholar]
- 41. Wang X., Yang X., Tsai Y., Yang L., Chuang K. H., Keng P. C., Lee S. O., and Chen Y. (2017) Il-6 mediates macrophage infiltration after irradiation via up-regulation of ccl2/ccl5 in non-small cell lung cancer. Radiat. Res. 187, 50–59 [DOI] [PubMed] [Google Scholar]
- 42. Tsou C. L., Peters W., Si Y., Slaymaker S., Aslanian A. M., Weisberg S. P., Mack M., and Charo I. F. (2007) Critical roles for ccr2 and mcp-3 in monocyte mobilization from bone marrow and recruitment to inflammatory sites. J. Clin. Invest. 117, 902–909 [DOI] [PMC free article] [PubMed] [Google Scholar]
- 43. Keepers T. R., Gross L. K., and Obrig T. G. (2007) Monocyte chemoattractant protein 1, macrophage inflammatory protein 1α, and rantes recruit macrophages to the kidney in a mouse model of hemolytic-uremic syndrome. Infect. Immun. 75, 1229–1236 [DOI] [PMC free article] [PubMed] [Google Scholar]
- 44. Bystry R. S., Aluvihare V., Welch K. A., Kallikourdis M., and Betz A. G. (2001) B cells and professional apcs recruit regulatory t cells via ccl4. Nat. Immunol. 2, 1126–1132 [DOI] [PubMed] [Google Scholar]
- 45. Vulcano M., Albanesi C., Stoppacciaro A., Bagnati R., D'Amico G., Struyf S., Transidico P., Bonecchi R., Del Prete A., Allavena P., Ruco L. P., Chiabrando C., Girolomoni G., Mantovani A., and Sozzani S. (2001) Dendritic cells as a major source of macrophage-derived chemokine/ccl22 in vitro and in vivo. Eur. J. Immunol. 31, 812–822 [DOI] [PubMed] [Google Scholar]
- 46. Waxman D. J. (1999) p450 gene induction by structurally diverse xenochemicals: central role of nuclear receptors car, pxr, and ppar. Arch. Biochem. Biophys. 369, 11–23 [DOI] [PubMed] [Google Scholar]
- 47. Zhao C., and Dahlman-Wright K. (2010) Liver x receptor in cholesterol metabolism. J. Endocrinol. 204, 233–240 [DOI] [PubMed] [Google Scholar]
- 48. Sell S. (1993) Cellular origin of cancer: dedifferentiation or stem cell maturation arrest? Environ. Health Perspect. 101, 15–26 [DOI] [PMC free article] [PubMed] [Google Scholar]
- 49. Zhou Y., and Rui L. (2010) Major urinary protein regulation of chemical communication and nutrient metabolism. Vitam Horm. 83, 151–163 [DOI] [PMC free article] [PubMed] [Google Scholar]
- 50. Ceciliani F., Giordano A., and Spagnolo V. (2002) The systemic reaction during inflammation: the acute-phase proteins. Protein Pept. Lett. 9, 211–223 [DOI] [PubMed] [Google Scholar]
- 51. Curthoys N. P., and Watford M. (1995) Regulation of glutaminase activity and glutamine metabolism. Annu. Rev. Nutr 15, 133–159 [DOI] [PubMed] [Google Scholar]
- 52. Gao P., Tchernyshyov I., Chang T. C., Lee Y. S., Kita K., Ochi T., Zeller K. I., De Marzo A. M., Van Eyk J. E., Mendell J. T., and Dang C. V. (2009) c-myc suppression of mir-23a/b enhances mitochondrial glutaminase expression and glutamine metabolism. Nature 458, 762–765 [DOI] [PMC free article] [PubMed] [Google Scholar]
- 53. Altman B. J., Stine Z. E., and Dang C. V. (2016) From Krebs to clinic: glutamine metabolism to cancer therapy. Nat. Rev. Cancer 16, 619–634 [DOI] [PMC free article] [PubMed] [Google Scholar]
- 54. Allain C., Angenard G., Clément B., and Coulouarn C. (2016) Integrative genomic analysis identifies the core transcriptional hallmarks of human hepatocellular carcinoma. Cancer Res. 76, 6374–6381 [DOI] [PMC free article] [PubMed] [Google Scholar]
- 55. Lin D. C., Mayakonda A., Dinh H. Q., Huang P., Lin L., Liu X., Ding L. W., Wang J., Berman B., Song E., Yin D., and Koeffler H. P. (2017) Genomic and epigenomic heterogeneity of hepatocellular carcinoma. Cancer Res. 10.1158/0008-5472.can-16-2822 [DOI] [PMC free article] [PubMed] [Google Scholar]
- 56. Lu L. C., Hsu C. H., Hsu C., and Cheng A. L. (2016) Tumor heterogeneity in hepatocellular carcinoma: facing the challenges. Liver Cancer 5, 128–138 [DOI] [PMC free article] [PubMed] [Google Scholar]
- 57. Beauchamp E. M., and Platanias L. C. (2013) The evolution of the TOR pathway and its role in cancer. Oncogene 32, 3923–3932 [DOI] [PubMed] [Google Scholar]
- 58. Tykwinska K., Lauster R., Knaus P., and Rosowski M. (2013) Growth and differentiation factor 3 induces expression of genes related to differentiation in a model of cancer stem cells and protects them from retinoic acid-induced apoptosis. PLoS ONE 8, e70612. [DOI] [PMC free article] [PubMed] [Google Scholar]
- 59. Gray L. R., Tompkins S. C., and Taylor E. B. (2014) Regulation of pyruvate metabolism and human disease. Cell. Mol. Life Sci. 71, 2577–2604 [DOI] [PMC free article] [PubMed] [Google Scholar]
- 60. Watanabe K., Watson E., Cremona M. L., Millings E. J., Lefkowitch J. H., Fischer S. G., LeDuc C. A., and Leibel R. L. (2013) Ildr2: an endoplasmic reticulum resident molecule mediating hepatic lipid homeostasis. PLoS ONE 8, e67234. [DOI] [PMC free article] [PubMed] [Google Scholar]
- 61. Xu W., Zhu H., Gu M., Luo Q., Ding J., Yao Y., Chen F., and Wang Z. (2013) Dhtkd1 is essential for mitochondrial biogenesis and function maintenance. FEBS Lett. 587, 3587–3592 [DOI] [PubMed] [Google Scholar]
- 62. Helmke C., Becker S., and Strebhardt K. (2016) The role of plk3 in oncogenesis. Oncogene 35, 135–147 [DOI] [PubMed] [Google Scholar]
- 63. Wilson K. E., Yang N., Mussell A. L., and Zhang J. (2016) The regulatory role of kibra and ptpn14 in hippo signaling and beyond. Genes 7, e23. [DOI] [PMC free article] [PubMed] [Google Scholar]
- 64. Yamamoto M., Cid E., Bru S., and Yamamoto F. (2011) Rare and frequent promoter methylation, respectively, of tshz2 and 3 genes that are both downregulated in expression in breast and prostate cancers. PLoS ONE 6, e17149. [DOI] [PMC free article] [PubMed] [Google Scholar]
- 65. Celton-Morizur S., and Desdouets C. (2010) Polyploidization of liver cells. Adv. Exp. Med. Biol. 676, 123–135 [DOI] [PubMed] [Google Scholar]
- 66. Gentric G., and Desdouets C. (2014) Polyploidization in liver tissue. Am. J. Pathol. 184, 322–331 [DOI] [PubMed] [Google Scholar]
- 67. Nagasue N., Yamanoi A., Takemoto Y., Kimoto T., Uchida M., Chang Y. C., Taniura H., Kohno H., and Nakamura T. (1992) Comparison between diploid and aneuploid hepatocellular carcinomas: a flow cytometric study. Br. J. Surg. 79, 667–670 [DOI] [PubMed] [Google Scholar]
- 68. Ruá S., Comino A., Fruttero A., Torchio P., Bouzari H., Taraglio S., Torchio B., and Capussotti L. (1996) Flow cytometric DNA analysis of cirrhotic liver cells in patients with hepatocellular carcinoma can provide a new prognostic factor. Cancer 78, 1195–1202 [DOI] [PubMed] [Google Scholar]
- 69. Li Q., and Dang C. V. (1999) c-myc overexpression uncouples DNA replication from mitosis. Mol. Cell. Biol. 19, 5339–5351 [DOI] [PMC free article] [PubMed] [Google Scholar]
- 70. Okada S., Shimada K., Yamamoto J., Takayama T., Kosuge T., Yamasaki S., Sakamoto M., and Hirohashi S. (1994) Predictive factors for postoperative recurrence of hepatocellular carcinoma. Gastroenterology 106, 1618–1624 [DOI] [PubMed] [Google Scholar]
- 71. He T. C., Sparks A. B., Rago C., Hermeking H., Zawel L., da Costa L. T., Morin P. J., Vogelstein B., and Kinzler K. W. (1998) Identification of c-myc as a target of the apc pathway. Science 281, 1509–1512 [DOI] [PubMed] [Google Scholar]
- 72. Konsavage W. M., Zhang L., Wu Y., and Shenberger J. S. (2012) Hyperoxia-induced activation of the integrated stress response in the newborn rat lung. Am. J. Physiol. Lung Cell Mol. Physiol. 302, L27–L35 [DOI] [PubMed] [Google Scholar]
- 73. Xiao W., Wang J., Ou C., Zhang Y., Ma L., Weng W., Pan Q., and Sun F. (2013) Mutual interaction between yap and c-myc is critical for carcinogenesis in liver cancer. Biochem. Biophys. Res. Commun. 439, 167–172 [DOI] [PubMed] [Google Scholar]
- 74. Beck J., Handgretinger R., Klingebiel T., Dopfer R., Schaich M., Ehninger G., Niethammer D., and Gekeler V. (1996) Expression of pkc isozyme and mdr-associated genes in primary and relapsed state aml. Leukemia 10, 426–433 [PubMed] [Google Scholar]
- 75. Farrar J. E., Schuback H. L., Ries R. E., Wai D., Hampton O. A., Trevino L. R., Alonzo T. A., Guidry Auvil J. M., Davidsen T. M., Gesuwan P., Hermida L., Muzny D. M., Dewal N., Rustagi N., Lewis L. R., et al. (2016) Genomic profiling of pediatric acute myeloid leukemia reveals a changing mutational landscape from disease diagnosis to relapse. Cancer Res. 76, 2197–2205 [DOI] [PMC free article] [PubMed] [Google Scholar]
- 76. Huang Q., Zhang Q. B., Dong J., Wu Y. Y., Shen Y. T., Zhao Y. D., Zhu Y. D., Diao Y., Wang A. D., and Lan Q. (2008) Glioma stem cells are more aggressive in recurrent tumors with malignant progression than in the primary tumor, and both can be maintained long-term in vitro. BMC Cancer 8, 304. [DOI] [PMC free article] [PubMed] [Google Scholar]
- 77. Madan V., Shyamsunder P., Han L., Mayakonda A., Nagata Y., Sundaresan J., Kanojia D., Yoshida K., Ganesan S., Hattori N., Fulton N., Tan K. T., Alpermann T., Kuo M. C., Rostami S., et al. (2016) Comprehensive mutational analysis of primary and relapse acute promyelocytic leukemia. Leukemia 30, 2430. [DOI] [PMC free article] [PubMed] [Google Scholar]
- 78. Masetti R., Castelli I., Astolfi A., Bertuccio S. N., Indio V., Togni M., Belotti T., Serravalle S., Tarantino G., Zecca M., Pigazzi M., Basso G., Pession A., and Locatelli F. (2016) Genomic complexity and dynamics of clonal evolution in childhood acute myeloid leukemia studied with whole-exome sequencing. Oncotarget 7, 56746–56757 [DOI] [PMC free article] [PubMed] [Google Scholar]
- 79. Riehmer V., Gietzelt J., Beyer U., Hentschel B., Westphal M., Schackert G., Sabel M. C., Radlwimmer B., Pietsch T., Reifenberger G., Weller M., Weber R. G., Loeffler M., and German Glioma Network. (2014) Genomic profiling reveals distinctive molecular relapse patterns in idh1/2 wild-type glioblastoma. Genes Chromosomes Cancer 53, 589–605 [DOI] [PubMed] [Google Scholar]
- 80. van den Bent M. J., Gao Y., Kerkhof M., Kros J. M., Gorlia T., van Zwieten K., Prince J., van Duinen S., Sillevis Smitt P. A., Taphoorn M., and French P. J. (2015) Changes in the egfr amplification and egfrviii expression between paired primary and recurrent glioblastomas. Neuro. Oncol. 17, 935–941 [DOI] [PMC free article] [PubMed] [Google Scholar]
- 81. Li R., Chen X., You Y., Wang X., Liu Y., Hu Q., and Yan W. (2015) Comprehensive portrait of recurrent glioblastoma multiforme in molecular and clinical characteristics. Oncotarget 6, 30968–30974 [DOI] [PMC free article] [PubMed] [Google Scholar]
- 82. Yuneva M. O., Fan T. W., Allen T. D., Higashi R. M., Ferraris D. V., Tsukamoto T., Matés J. M., Alonso F. J., Wang C., Seo Y., Chen X., and Bishop J. M. (2012) The metabolic profile of tumors depends on both the responsible genetic lesion and tissue type. Cell Metab. 15, 157–170 [DOI] [PMC free article] [PubMed] [Google Scholar]
- 83. Liu J., Zhang C., Lin M., Zhu W., Liang Y., Hong X., Zhao Y., Young K. H., Hu W., and Feng Z. (2014) Glutaminase 2 negatively regulates the PI3K/akt signaling and shows tumor suppression activity in human hepatocellular carcinoma. Oncotarget 5, 2635–2647 [DOI] [PMC free article] [PubMed] [Google Scholar]
- 84. Kuniyasu H., Ohmori H., Sasaki T., Sasahira T., Yoshida K., Kitadai Y., and Fidler I. J. (2003) Production of interleukin 15 by human colon cancer cells is associated with induction of mucosal hyperplasia, angiogenesis, and metastasis. Clin. Cancer Res. 9, 4802–4810 [PubMed] [Google Scholar]
- 85. Waugh D. J., and Wilson C. (2008) The interleukin-8 pathway in cancer. Clin. Cancer Res. 14, 6735–6741 [DOI] [PubMed] [Google Scholar]
- 86. Graves J. A., Metukuri M., Scott D., Rothermund K., and Prochownik E. V. (2009) Regulation of reactive oxygen species homeostasis by peroxiredoxins and c-myc. J. Biol. Chem. 284, 6520–6529 [DOI] [PMC free article] [PubMed] [Google Scholar]
- 87. Prochownik E. V. (2008) c-myc: linking transformation and genomic instability. Curr. Mol. Med. 8, 446–458 [DOI] [PubMed] [Google Scholar]
- 88. Guo X., Zhao Y., Yan H., Yang Y., Shen S., Dai X., Ji X., Ji F., Gong X. G., Li L., Bai X., Feng X. H., Liang T., Ji J., Chen L., Wang H., and Zhao B. (2017) Single tumor-initiating cells evade immune clearance by recruiting type ii macrophages. Genes Dev. 31, 247–259 [DOI] [PMC free article] [PubMed] [Google Scholar]
- 89. Soucek L., Lawlor E. R., Soto D., Shchors K., Swigart L. B., and Evan G. I. (2007) Mast cells are required for angiogenesis and macroscopic expansion of myc-induced pancreatic islet tumors. Nat. Med. 13, 1211–1218 [DOI] [PubMed] [Google Scholar]
- 90. Martinez-Quetglas I., Pinyol R., Dauch D., Torrecilla S., Tovar V., Moeini A., Alsinet C., Portela A., Rodriguez-Carunchio L., Solé M., Lujambio A., Villanueva A., Thung S., Esteller M., Zender L., and Llovet J. M. (2016) Igf2 is up-regulated by epigenetic mechanisms in hepatocellular carcinomas and is an actionable oncogene product in experimental models. Gastroenterology 151, 1192–1205 [DOI] [PubMed] [Google Scholar]
- 91. Maschietto M., Charlton J., Perotti D., Radice P., Geller J. I., Pritchard-Jones K., and Weeks M. (2014) The igf signalling pathway in Wilms tumours–a report from the encca renal tumours biology-driven drug development workshop. Oncotarget 5, 8014–8026 [DOI] [PMC free article] [PubMed] [Google Scholar]
- 92. Matouk I., Raveh E., Ohana P., Lail R. A., Gershtain E., Gilon M., De Groot N., Czerniak A., and Hochberg A. (2013) The increasing complexity of the oncofetal h19 gene locus: functional dissection and therapeutic intervention. Int. J. Mol. Sci. 14, 4298–4316 [DOI] [PMC free article] [PubMed] [Google Scholar]
- 93. Raveh E., Matouk I. J., Gilon M., and Hochberg A. (2015) The h19 long non-coding RNA in cancer initiation, progression and metastasis–a proposed unifying theory. Mol. Cancer 14, 184. [DOI] [PMC free article] [PubMed] [Google Scholar]
- 94. Barsyte-Lovejoy D., Lau S. K., Boutros P. C., Khosravi F., Jurisica I., Andrulis I. L., Tsao M. S., and Penn L. Z. (2006) The c-myc oncogene directly induces the h19 noncoding RNA by allele-specific binding to potentiate tumorigenesis. Cancer Res. 66, 5330–5337 [DOI] [PubMed] [Google Scholar]
- 95. Chang T. C., Zeitels L. R., Hwang H. W., Chivukula R. R., Wentzel E. A., Dews M., Jung J., Gao P., Dang C. V., Beer M. A., Thomas-Tikhonenko A., and Mendell J. T. (2009) Lin-28b transactivation is necessary for myc-mediated let-7 repression and proliferation. Proc. Natl. Acad. Sci. U.S.A. 106, 3384–3389 [DOI] [PMC free article] [PubMed] [Google Scholar]
- 96. Lederer M., Bley N., Schleifer C., and Hüttelmaier S. (2014) The role of the oncofetal igf2 mRNA-binding protein 3 (igf2bp3) in cancer. Semin. Cancer Biol. 29, 3–12 [DOI] [PubMed] [Google Scholar]
- 97. Bei Y., Huang Q., Shen J., Shi J., Shen C., Xu P., Chang H., Xia X., Xu L., Ji B., and Chen J. (2016) Igfbp6 regulates cell apoptosis and migration in glioma. Cell. Mol. Neurobiol. 10.1007/s10571-016-0426-4 [DOI] [PMC free article] [PubMed] [Google Scholar]
- 98. Pickard A., and McCance D. J. (2015) Igf-binding protein 2–oncogene or tumor suppressor? Front. Endocrinol. 6, 25. [DOI] [PMC free article] [PubMed] [Google Scholar]
- 99. Wang J., Ding N., Li Y., Cheng H., Wang D., Yang Q., Deng Y., Yang Y., Li Y., Ruan X., Xie F., Zhao H., and Fang X. (2015) Insulin-like growth factor binding protein 5 (igfbp5) functions as a tumor suppressor in human melanoma cells. Oncotarget 6, 20636–20649 [DOI] [PMC free article] [PubMed] [Google Scholar]
- 100. Edmunds L. R., Sharma L., Wang H., Kang A., d'Souza S., Lu J., McLaughlin M., Dolezal J. M., Gao X., Weintraub S. T., Ding Y., Zeng X., Yates N., and Prochownik E. V. (2015) c-myc and ampk control cellular energy levels by cooperatively regulating mitochondrial structure and function. PLoS ONE 10, e0134049. [DOI] [PMC free article] [PubMed] [Google Scholar]
- 101. Schneider C. A., Rasband W. S., and Eliceiri K. W. (2012) NIH image to ImageJ: 25 years of image analysis. Nat. Methods 9, 671–675 [DOI] [PMC free article] [PubMed] [Google Scholar]
- 102. Sarin M., Wang Y., Zhang F., Rothermund K., Zhang Y., Lu J., Sims-Lucas S., Beer-Stolz D., Van Houten B. E., Vockley J., Goetzman E. S., Graves J. A., and Prochownik E. V. (2013) Alterations in c-myc phenotypes resulting from dynamin-related protein 1 (drp1)-mediated mitochondrial fission. Cell Death Dis. 4, e670. [DOI] [PMC free article] [PubMed] [Google Scholar]
- 103. Trinei M., Berniakovich I., Pelicci P. G., and Giorgio M. (2006) Mitochondrial DNA copy number is regulated by cellular proliferation: a role for ras and p66(shc). Biochim. Biophys. Acta 1757, 624–630 [DOI] [PubMed] [Google Scholar]
Associated Data
This section collects any data citations, data availability statements, or supplementary materials included in this article.