

Abstract
Beta adrenergic receptors (βARs) are G-protein-coupled receptors essential for physiological responses to the hormones/neurotransmitters epinephrine and norepinephrine which are found in the nervous system and throughout the body. They are the targets of numerous widely used drugs, especially in the case of the most extensively studied βAR, β2AR, whose ligands are used for asthma and cardiovascular disease. βARs signal through Gαs G-proteins and via activation of adenylyl cyclase and cAMP-dependent protein kinase, but some alternative downstream pathways have also been proposed that could be important for understanding normal physiological functioning of βAR signaling and its disruption in disease. Using fluorescence-based Ca2+ flux assays combined with pharmacology and gene knock-out methods, we discovered a previously unrecognized endogenous pathway in HEK-293 cells whereby β2AR activation leads to robust Ca2+ mobilization from intracellular stores via activation of phospholipase C and opening of inositol trisphosphate (InsP3) receptors. This pathway did not involve cAMP, Gαs, or Gαi or the participation of the other members of the canonical β2AR signaling cascade and, therefore, constitutes a novel signaling mechanism for this receptor. This newly uncovered mechanism for Ca2+ mobilization by β2AR has broad implications for adrenergic signaling, cross-talk with other signaling pathways, and the effects of βAR-directed drugs.
Keywords: adrenergic receptor, calcium intracellular release, cell signaling, cyclic AMP (cAMP), G-protein-coupled receptor (GPCR), β2-adrenergic receptor
Introduction
Among G-protein-coupled receptors (GPCRs),3 encoded by the largest gene family in the human genome, receptors of the β-adrenoreceptor family (βARs), are perhaps the most thoroughly studied and some of the most commonly targeted by therapeutic drugs. βARs are divided into three subtypes: β1AR, β2AR, and β3AR, differing in their localization (1) and responsiveness to drugs (2–4). These receptors are ubiquitously expressed throughout the body and respond to the hormones/neurotransmitters epinephrine and norepinephrine (5). The β2AR in particular has been widely studied and has been often used as a model for studying GPCR structure and function (6).
Canonically, all βARs signal through coupling to Gαs G-proteins, adenylyl cyclase (AC), and cAMP-dependent protein kinase A (PKA) (1), but in recent years there has been increasing interest in alternative downstream pathways (7). In some cell types, β2AR activation has been linked to mobilization of Ca2+ from intracellular stores, but these have been attributed to the actions of cAMP acting on PKA (8, 9) or exchange protein activated by cAMP (EPAC) (10–12). Understanding all of the pathways downstream from β2AR is of great importance for comprehending normal physiological functioning of adrenergic signaling and its disruption in disease, cross-talk between cyclic nucleotide-mediated and Ca2+-meditated signaling, and the effects of β2AR-directed drugs.
Results
Activation of endogenous β2ARs in HEK cells leads to an increase in cytoplasmic Ca2+
In the course of testing responsiveness of mutant dopamine receptors to various agonists (15), we observed that treatment of HEK-293 cells with norepinephrine (NE) led to a dramatic increase in intracellular Ca2+(Fig. 1a). To determine which receptors are responsible for this response, we tested the cells with adrenergic agonists and antagonists of known specificity. Epinephrine (Epi), norepinephrine (NE), and isoproterenol (ISO) all activated the response with a rank order of potency (ISO > Epi > NE), consistent with that of β2AR (2), and the β2AR-selective terbutaline (Ter) activated with high potency (Fig. 1b). Whereas propranolol, an inhibitor of β2AR and β1AR, but not β3AR, and the β2AR-specific inhibitor ICI 118,551 did not block responses of purinergic-P2Y receptors to adenosine triphosphate (ATP; Fig. 1c), they blocked the response to isoproterenol (Fig. 1, d and e). In contrast, α1/2AR inhibitor yohimbine and α1AR-selective inhibitor prazosin did not block signaling (Fig. 1, f and g). These results point strongly to β2AR, known to be expressed in this cell line (16), as the receptor responsible for the Ca2+ release. Supplemental Table S1 summarizes the effects of all GPCR agonists and antagonists tested.
Figure 1.

Endogenous β2AR activation increased cytoplasmic [Ca2+] in HEK cells. Continuous changes in Fluo-4 fluorescence intensity with time (a and c) or peak increases in intensity as a function of drug concentration (b and d–h) are plotted. a, NE treatment increased cytoplasmic [Ca2+]. b, NE response is mimicked by AR agonists epinephrine (Epi) and isoproterenol (ISO) and the β2AR-selective terbutaline (Ter). c, the β-AR inhibitor propranolol and the β2AR-selective ICI 118,551 do not suppress P2Y receptor signaling. d and e, β-adrenergic inhibitors suppress responses to ISO. f and g, α-adrenergic inhibitors do not suppress ISO responses. h and i, loss of Ca2+ response in cells lacking β2AR and restoration by β2AR expression. h, β2AR deletion mutant cells (KO) were transfected with pcDNA3.1 or HA-tagged β2AR and tested for Ca2+ responses over a range of ISO concentrations. i, β2AR deletion mutant cells (KO) or wildtype (WT) cells were treated with 10 μm ISO at the indicated times, and Ca2+ responses were monitored over time. For all panels Ca2+ traces represent three or more independent experiments; error bars indicate internal replicate S.E. Dose responses are the averages of three or more independent experiments, and error bars indicate S.E. AU, absorbance units.
Potent isoproterenol stimulation of Ca2+ release requires a functional β2AR gene
To test for the role of β2AR in the observed Ca2+ release by a genetic approach, to supplement the strong pharmacological evidence, we created an ADRB2 gene deletion using the CRISPR/Cas9 system. This knock-out line was transfected with control or HA-β2AR-expressing constructs and tested for Ca2+ response to ISO. In the absence of β2AR (Fig. 1, h and i) there was no detectable Ca2+ response to ISO up to its EC50 in WT cells (Fig. 1d), and at much higher concentrations only a very attenuated response was observed, likely due to nonspecific effects on other targets. The response was completely rescued by transfection with a plasmid directing expression of β2AR (Fig. 1h).
The cytoplasmic [Ca2+] increase is due to release from thapsigargin-sensitive intracellular stores through the actions of phospholipase C (PLC) and the inositol trisphosphate receptor (InsP3R)
Removal of extracellular Ca2+ with EGTA did not block β2AR-mediated Ca2+ release (Fig. 2, a and b), although it did eliminate the characteristic long-term plateau of the Ca2+ signal, suggesting the latter may be due to store-operated Ca2+ entry. In contrast, treatment of cells with thapsigargin to inhibit the endoplasmic-reticulum-resident SERCA Ca2+-ATPase pump and deplete intracellular Ca2+ stores resulted in a transient increase in intracellular Ca2+ concentration and almost completely blocked Ca2+ release in response to β2AR activation (Fig. 2c). Inhibition of PLC with U73122 or of the InsP3R with 2-APB blocked β2AR-mediated Ca2+ release (Fig. 2d). These results point strongly to a mechanism in which β2AR activation leads to PLC activation, release of InsP3, and Ca2+ release from thapsigargin-sensitive intracellular stores via the InsP3 receptor.
Figure 2.
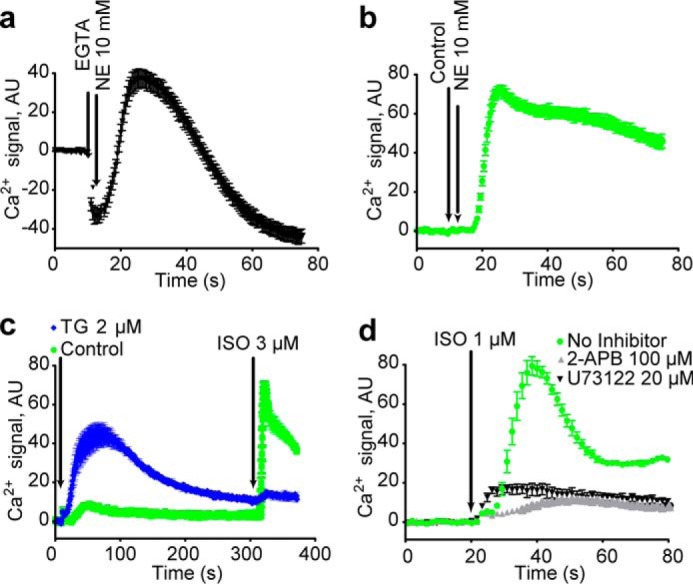
The β2AR induced calcium response is due to release from the endoplasmic reticulum. a and b, chelation of extracellular Ca2+ with EGTA does not eliminate β2AR-mediated Ca2+ mobilization. c, depletion of endoplasmic reticulum Ca2+ by treatment with thapsigargin (TG) for 5 min nearly eliminates signaling with ISO. d, treatment with InsP3R inhibitor 2-APB and PLC inhibitor U73122 for 1 h suppresses signaling with ISO. Ca2+ traces represent three or more independent experiments, and error bars indicate internal replicate S.E. AU, absorbance units.
Activity of cAMP-dependent protein kinase is not necessary or sufficient for β2AR-mediated Ca2+ signaling
To test for canonical signaling through cAMP-dependent PKA we treated with the cell-permeant PKA activator, 8-bromo-cAMP (8-Br-cAMP). Challenge of HEK cells with 2 mm 8-Br-cAMP after pretreatment for 1 h with 200 μm 3-isobutyl-1-methylxanthine (IBMX) did not yield a Ca2+ response (Fig. 3a) even after prolonged observation of Ca2+ accumulation in real time (30 min) (Fig. 3b) even though on the same time scale we did observe PKA-mediated accumulation of phosphorylated cAMP response element-binding protein (CREB) (Fig. 3d). Thus PKA activation is not sufficient to stimulate Ca2+ release. Treatment with two widely used PKA inhibitors, H-89 and KT-5720, failed to suppress β2AR-mediated Ca2+ signaling (Fig. 3e), demonstrating that PKA activity is not necessary for this response.
Figure 3.
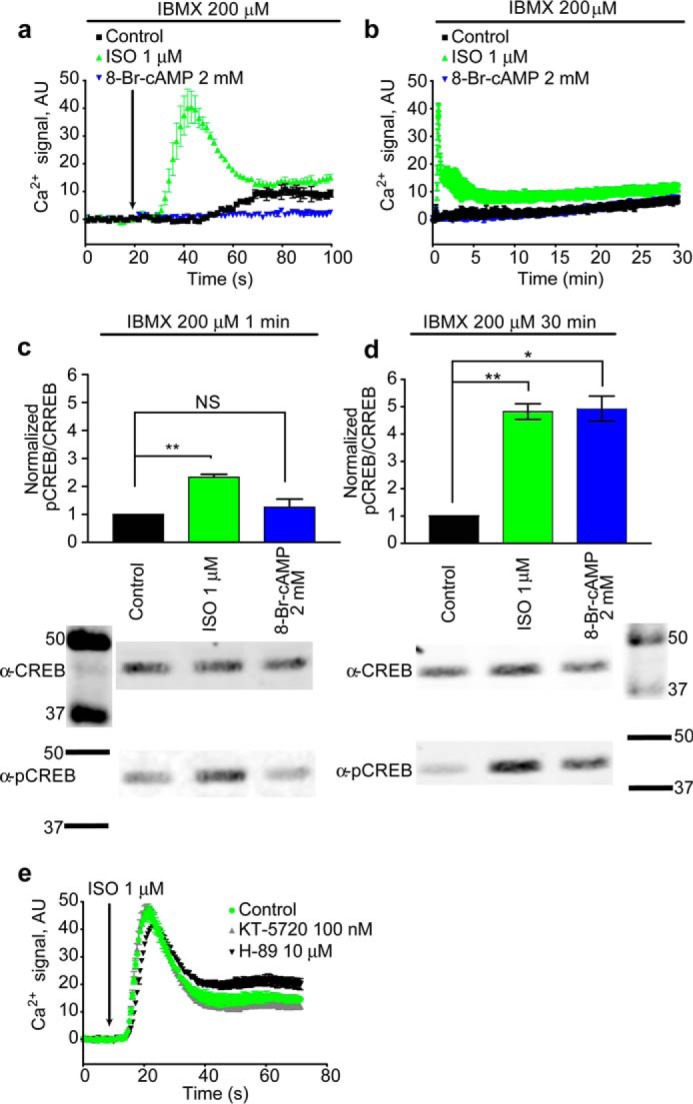
PKA did not mediate the β2AR calcium response. a, 1 min of 8-Br-cAMP treatment did not mimic ISO response. b, 30 min of 8-Br-cAMP treatment did not mimic ISO response. c, 1 min of ISO significantly raised pCREB levels (**, p = 0.0065), whereas 1 min of 8-Br-cAMP treatment did not significantly raise pCREB levels (NS). d, 30 min of ISO (**, p = 0.0056) and 8-Br-cAMP treatment (*, p = 0.0133) significantly elevated intracellular pCREB. e, treatment with PKA inhibitors KT-5720 and H-89 for 1 h did not suppress signaling with ISO. Ca2+ traces represent three or more independent experiments, and error bars indicate internal replicate S.E. pCREB/CREB graphs are the averages of three independent experiments; error bars indicate S.E. Full blot images are shown in supplemental Fig. S1. AU, absorbance units.
Inhibition of AC and the reduction of intracellular cAMP do not hinder β2AR-induced Ca2+ mobilization
To test for PKA-independent mechanisms downstream of AC, we used HEK cells stably expressing the μ-opioid receptor (HEK-μOR), which couples to the AC-inhibiting G-protein, Gαi. Activation of μ-opioid receptor (μOR) with 3 μm DAMGO did not suppress β2AR-mediated Ca2+ mobilization (Fig. 4a) but did activate the Gαi-activated TRPC4β channel, depolarizing the membrane (Fig. 4b), a response that was abolished by pertussis toxin (PTX; Fig. 4c).
Figure 4.

The β2AR calcium response was not mediated by AC or cAMP. a, Gαi activation did not inhibit ISO signals. b, Gαi activation induced changes in membrane potential. c, treatment with PTX abolished μOR-induced membrane potential changes. d–g, treatment with AC inhibitors SQ 22,536 and ddAd did not suppress signaling with ISO, even at 1 mm, although AC inhibitor treatment significantly suppressed cAMP formation (* = p = 0.0298 and ** = p = 0.0059) (f). h and i, IBMX treatment did not potentiate signaling with ISO. Ca2+ traces represent three or more independent experiments, and error bars indicate internal replicate S.E. Dose responses and bar graphs are the averages of three or more independent experiments, and error bars indicate S.E. AU, absorbance units.
To investigate potential Gαi-insensitive roles of AC in our Ca2+ pathway, we used varying concentrations of the AC inhibitors 9-(tetrahydrofuryl)-adenine (SQ 22536) and 2′5′-dideoxyadenosine (ddAd) and found that both inhibitors failed to suppress Ca2+ signaling (Fig. 4, d and e) even at 1 mm (Fig. 4, d, e, and g). Control experiments confirmed the ability of these compounds to block cAMP accumulation (Fig. 4f), leading to the conclusion that AC activity is not necessary for the Ca2+ response.
To determine whether increases in cAMP concentration mimic or enhance β2AR-induced responses, we treated HEK cells with the phosphodiesterase inhibitor IBMX and found that although this reagent increased isoproterenol-induced CREB phosphorylation (supplemental Fig. S1) and promoted robust cAMP production in response to ISO (Fig. 4f), it failed to potentiate isoproterenol-induced increases in intracellular Ca2+ (Fig. 4, h and i). These results demonstrate that activation of AC and increasing cAMP levels inside the cell are neither necessary nor sufficient for the mobilization of Ca2+ by β2AR.
β2AR-induced calcium release from intracellular stores is independent of Gαs and Gαi/o G-proteins
To test for the participation of β2AR's canonical signaling partner Gαs, which may act through effectors other than AC, we treated cells with cholera toxin (CTX), which leads to persistent activation of Gαs. CTX treatment neither induced Ca2+ release (not shown) nor potentiated β2AR-induced Ca2+ responses (Fig. 5a), whereas CTX treatment generated a very large increase in cAMP (Fig. 5b). These results not only indicate that Gαs does not play an important role but also further confirm that cAMP, the canonical second messenger regulated by β2AR, does not play any role in the Ca2+ response.
Figure 5.
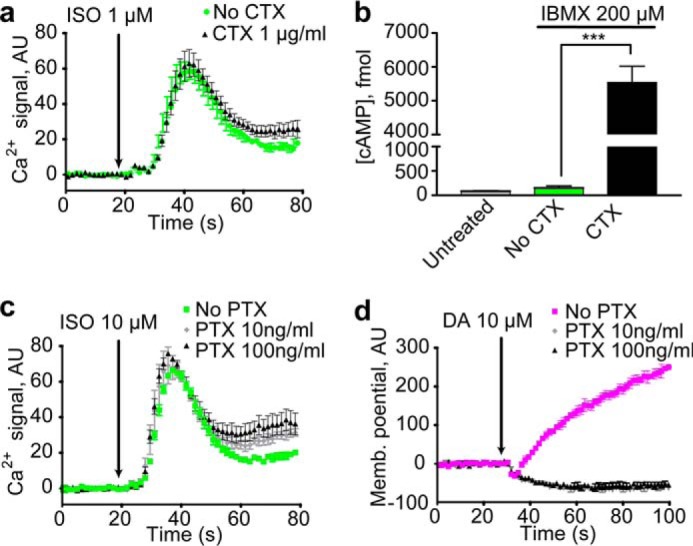
β2AR did not couple to Gαs or Gαi to initiate the calcium response. a, treatment with the Gαs CTX did not potentiate signaling with ISO. b, treatment with CTX significantly increased cytoplasmic cAMP (***, p = 0.0004). c, treatment with the Gαi PTX did not suppress signaling with ISO. d, treatment with PTX completely eliminated changes in membrane potential induced by the dopamine-2 receptor upon the addition of dopamine (DA). Ca2+ and membrane potential traces represent three or more independent experiments, and error bars indicate internal replicate S.E. The bar graphs are the averages of three or more independent experiments, and the error bars indicate S.E. AU, absorbance units.
It has been reported that upon PKA phosphorylation β2AR can couple to the PTX-sensitive G-protein Gαi (16). We treated cells with PTX and found that it failed to suppress signaling with ISO (Fig. 5c), whereas in control experiments in cells expressing Gαi-activated TRPC4β, it strongly suppressed activation of Gαi by the dopamine D2 receptor (Fig. 5d) or the μ-opioid receptor (Fig. 4c). Moreover, Gαi activation with DAMGO did not lead to increases in cytoplasmic Ca2+ concentration (Fig. 4a), and isoproterenol treatment alone did not lead to Gαi activation of TRPC4β (Fig. 4b). Thus, neither Gαi nor Gαs was necessary or sufficient for β2AR-induced Ca2+ release.
Discussion
Our results reveal that in HEK-293 cells, β2AR activation led to rapid and robust Ca2+ signaling that relied on phospholipase C, the InsP3 receptor, and intracellular Ca2+ stores but not on the canonical downstream signaling partners, Gαs, Gαi, AC, or PKA. For a summary of the drugs used to test for involvement of these molecules, please refer to supplemental Table S1.
There have been previous reports of intracellular Ca2+ mobilization or modulation by adrenoreceptor activation, but compelling evidence for a pathway leading to InsP3 release without involvement of Gαs, Gαi, or cAMP has been lacking. For example, Ca2+ release upon adrenergic stimulation of rat submandibular and parotid cells, although not specifically attributed to β2AR (17–19) and subject to dispute (20), was reported to be downstream of cAMP production (19). In ostensibly the same cell line as that studied here, it was reported that activation of overexpressed recombinant β2AR led to Ca2+ mobilization but that the pathway proceeded through cAMP and EPAC (12). More recently, in an HEK-293-derived cell line overexpressing a tagged recombinant β2AR, Ca2+ release from intracellular stores was reported to contribute to impedance changes resulting from β2AR activation, but the pathways leading from receptor to release were not explored (21).
The involvement of β2AR in the modulation of Ca2+ release from intracellular stores has been previously observed during cross-talk between β2AR-mediated pathways and those of Gαq-coupled receptors such as the M3 muscarinic receptor (22, 23) and α1AR (24). In these studies AR agonist effects were shown to depend on co-activation of both receptors, in contrast to our findings that clearly show that treatment with β2AR agonists alone leads to increasing cytoplasmic Ca2+. Additionally, cAMP was found to be a necessary mediator for cross-talk, whereas our data demonstrate that cAMP is not necessary for β2AR agonist-induced Ca2+ mobilization. Thus the previously observed cross-talk between β2AR and Gαq-coupled receptors likely represents a signaling cascade distinct from the one studied here. Previous failure to observe the robust Ca2+ release seen here may be attributable to differences in conditions, e.g. loading cells with indicator dye at 37 °C (25), known to increase dye accumulation in intracellular compartments (26), culturing cells in suspension (25), or clonal differences in HEK-293 cells. In this regard it is important to note that we have observed this phenomenon in five different clonal HEK-derived cell lines from two different laboratories as well as in cells freshly obtained from ATCC. In addition, we have shown that a lack of β2AR leads to a huge reduction in Ca2+ release, which can be rescued by transient transfection with an HA-tagged β2AR.
The lack of involvement of Gαs, Gαi, and cAMP in this pathway is quite surprising; even currently recognized “alternative” signaling mechanisms for β2AR primarily go through at least one of these effectors. Gαq and Gα11 couple a variety of GPCRs to phospholipase C; however, β2AR failed to couple to Gαq, Gα11, and Gα14 to activate PLC in co-expression studies (27, 28) and has only been shown to couple to Gαq in overexpression systems where the G-protein and receptor were fused together (29). Moreover, treatment of HEK-TRPC4β cells with carbachol, an agonist for the Gαq-coupled M3 muscarinic receptor, leads to a robust change in membrane potential. In a previous study we confirmed that these changes are dependent on activation of Gαq G-proteins (30). In contrast, we found that treatment with ISO does not lead to a change in membrane potential (Fig. 6), further arguing against a role for Gαq.
Figure 6.
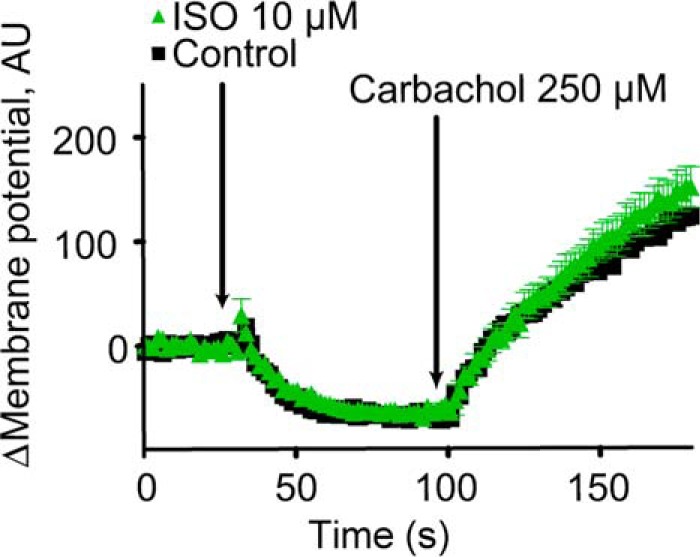
Supporting evidence against Gαq coupling to β2AR in TRPC4 β-expressing HEK-293 cells. Treatment with ISO did not mimic the membrane potential response of the Gαq-coupled M3 muscarinic receptors activated with carbachol. Ca2+ traces represent three or more independent experiments, and error bars indicate internal replicate S.E. Fig. 4 demonstrates robust membrane potential changes in response to μOR stimulation with DAMGO under these conditions without PTX treatment and robust Ca2+ release in response to isoproterenol stimulation under these conditions in these cells. AU, absorbance units.
Two promiscuous G-proteins, human Gα16 and the mouse version, Gα15, are known to couple a wide range of GPCRs to PLC. We determined previously that D2 dopamine receptors and Group II and Group III metabotropic glutamate receptors do not couple to PLC and Ca2+-release significantly through endogenous G-proteins in HEK-293 cells but produce robust Ca2+ responses upon activation in cells co-transfected with plasmids directing expression of Gα15 or Gα16 or in cell lines stably expressing Gα16 (15, 30), arguing strongly against a role for Gα16 in the responses observed here. Another candidate for future study is Gαz, potentially acting through a previously unknown pathway. Presumably, any number of Gβγ subunits could be involved, as these have been shown to activate PLC (32). Another possible mechanism for this response could involve the participation of β-arrestins, which initiate an array of signaling cascades. Activation of β-arrestin is not typically associated with PLC activation or the opening of InsP3Rs (33–35), so a β-arrestin-linked pathway would represent a novel branch of signaling mediated by these molecules. Moreover, the rapid nature of the responses we observed would also represent a novel feature of β-arrestin-mediated responses, which are generally much slower than those mediated by G-proteins (31). Exploration of the mechanisms linking receptor activation to phospholipase C and the implications of this novel pathway for responses to endogenous β2AR agonists and β2AR-directed drugs will be important impacts of these observations.
Experimental procedures
Reagents
Fluo-4-AM, thapsigargin, pluronic F-127, Lipofectamine 2000 were purchased from Life Technologies (Grand Island, NY). ATP, terbutaline, propranolol, yohimbine, prazosin, ddAd, U73122, epinephrine, and norepinephrine were purchased from Sigma-Aldrich. ICI 118,551, H-89, isoproterenol, KT 5720, IBMX carbachol, and 2-APB were purchased from EMD Millipore (Darmstadt, Germany). DAMGO was purchased from TOCRIS (Bristol, UK). CTX and PTX were purchased from List Biological Laboratories (Campbell, CA). 8-Bromo-cAMP and 9-(tetrahydrofuryl)-adenine (SQ 22536) were purchased from Enzo Life Sciences (Farmingdale, NY). Phospho-CREB (pCREB) antibody (Ser-133) (1B6) antibody and CREB (48H2) antibody were purchased from Cell Signaling (Danvers, MA). IR dye-conjugated secondary antibodies were purchased from LICOR (Lincoln, NE).
Cell culture and transfection
Human embryonic kidney 293 wild type (HEK) cells were obtained from the American Type Culture Collection (Manassas, VA). HEK-293 cells, HEK-293 cells stably expressing transient receptor potential channel-4-β (TRPC4β) (HEK-TRPC4β), and HEK-293 cells stably expressing both μOR and TRPC4β (HEK-μOR) were kindly donated by Dr. Michael X. Zhu from the University of Texas Health Science Center (Houston, TX). All cell cultures were maintained at 37 °C, 5% CO2 in a humidified incubator in Dulbecco's modified Eagle's medium (DMEM) supplemented with 10% fetal bovine serum. Wild-type cells were maintained in antibiotic free DMEM, whereas stably transfected cells were maintained in media containing 0.5 g/liter G418, 100 units/ml penicillin, and 100 μg/ml streptomycin. Transfections were performed in 96-well plates with Lipofectamine 2000 following the manufacturer's recommendations.
Electroporation of the ADRB2 knock-out cell line to introduce control or rescue constructs was performed using a BTX ECM830 square wave machine (Harvard Apparatus, Holliston MS). For each electroporation, 400 μl of 5 × 10⁵ cells/ml in PBS were combined with 20 μg of plasmid DNA in H20. The ADRB2 rescue construct contains an N-terminal HA3-tagged human ADRB2 cloned into pcDNA3.1 (cDNA Resource Center). The electroporation was done with 3–2-ms pulses of 260 V in 4-ms intervals. Cells were allowed to recover for 1–3 days and were then plated as described for 96-well Ca2+ release assays.
Generation of ADRB2 knock-out HEK-293 cell line
The ADRB2 gene deletion was generated in HEK-293 cells using the CRISPR/Cas9 method (13). Several 20-bp DNA targeting sequences upstream of protospacer adjacent motif sites were identified in both the 5′ and 3′ ends of ADRB2 using Benchling. These sequences were cloned into px458 (Addgene #48138), which contains the Cas9 gene from Streptococcus pyogenes and a single-guide RNA (sgRNA) sequence. The constructs were transfected into HEK-293 cells and tested for efficiency using the surveyor assay (13, 14). The mismatch-specific endonuclease CEL1 used for this assay was extracted from celery as described (36). Two constructs targeting the 5′ (5′-GCCGGACCACGACGTCACGC-3′) and 3′ (5′-AGCGATAACATTGATTCACAC-3′) ends of the gene were co-transfected into HEK-293 cells and tested for gene deletion using PCR. Clonal cell lines were generated at the Baylor College of Medicine Cell Based Assay Screening Service core facility by limited dilution and expansion and screening of clones by PCR.
Calcium mobilization assay
Cells were plated in clear, flat-bottom, poly-d-lysine-coated 96-well plates (Corning Life Sciences, Corning, NY) at 80,000 or 150,000 cells per well and allowed to grow for ∼48 or 24 h, respectively. The day of the experiment plating medium was removed, and cells were washed with Krebs/Ringer/HEPES (KRH) buffer (120 mm NaCl, 4.7 mm KCl, 2.2 mm CaCl2, 10 mm HEPES, 1.2 mm KH2PO4, 1.2 mm MgSO4) supplemented with 1.8 g/liter glucose, 2.5 mm probenecid (to prevent dye efflux), and ascorbic acid (to prevent oxidation of assayed drugs). KRH buffer that was supplemented with glucose, probenecid, and ascorbic acid is abbreviated as KRH-A. After washing, cells were loaded with Fluo-4-AM in DMSO (final concentration 2 μm in KRH-A) premixed with an equal volume of 20% pluronic F-127 in DMSO. Cells were then incubated in the dark at room temperature for 1 h. After incubation, the dye was removed, and cells were washed 2 times in KRH-A buffer. An appropriate volume of KRH-A buffer was then added back to each well, and cells were allowed to equilibrate to 37 °C for 10 min before testing drug responses. Drug solutions were prepared in KRH-A buffer at 3× the final concentration. Stock solutions of water insoluble drugs were prepared in an appropriate solvent, and 3× assay solutions were made alongside a vehicle control. Real-time Ca2+ measurements were acquired by reading fluorescence (excitation/emission 485/528 nm) from the bottom in a Flexstation 3 (Molecular Devices, Sunnyvale, CA) or a Synergy 2000 plate reader (ZONTEC, Cincinnati, OH). Before adding test drugs a baseline of fluorescence was collected for 10 or 20 s (for the Synergy or the Flexstation, respectively). After baseline collection, test drugs were injected while continuing to take fluorescence measurements. Data were analyzed with GraphPad Prism software (GraphPad Software for Science, Inc., La Jolla, CA).
Gαi activation assay
Activation of Gαi was assessed by measuring changes in membrane potential caused by the opening of TRPC4β ion channels. These assays were done in HEK-TRPC4β and HEK-μOR cells, which were plated as described for the Ca2+ mobilization assay. The day of the experiment the plating media was removed, and cells were washed with KRH buffer. The cells were loaded with a membrane potential dye and quencher combination (Molecular Devices) diluted in KRH buffer and incubated at 32 °C for 30 min. Dye was not removed during the assay. Differences in membrane potential were measured by reading fluorescence (excitation/emission 530/565 nm) from the bottom with a Flexstation 3 plate reader. A baseline of fluorescence was collected for 30 s before drug injection. Data were analyzed using GraphPad Prism software.
Total intracellular cyclic AMP measurements
Total intracellular cAMP was measured with the Amersham Biosciences cAMP Biotrak Enzyme Immunoassay system RPN2251 (GE Healthcare). Measurements were acquired by following the manufacturer's recommendations. In brief, HEK-293 cells were plated at 50,000 cells per well in 96-well plates 24 h before the assay. Drug treatments were performed as described under “Results.” Total cAMP ELISA was done following manufacturer's instructions, followed by optical density measurements at 450 nm using a Flexstation 3 plate reader.
Immunoblotting
Cells were plated at a density of 400,000 cells per well in 24-well plates and assayed the next day. After treatment with pertinent drugs, cells were lysed by the addition of sample application buffer (50 mm Tris HCl, pH 6.8, 6% v/v glycerol, 2% w/v sodium dodecyl sulfate, 10 μm dithiothreitol, and 1% v/v β-mercaptoethanol) with cOmplete protease inhibitor mixture (Roche Diagnostics) and PhosSTOP (Roche Diagnostics) phosphatase inhibitor mixture. Cell lysates were collected into prechilled microcentrifuge tubes and sonicated in an ethanol/ice bath for 30 s. Equal volumes of all samples were separated on 10 or 12% polyacrylamide gels in Tris-glycine-SDS running buffer. Protein bands were transferred onto nitrocellulose membranes in Tris-glycine-SDS buffer + 20% methanol at 350 mA for 90 min at 4 °C. Membranes were blocked with 5% milk for 1 h and incubated overnight at 4 °C in 1:1000 primary antibody solutions (anti-CREB antibody anti-phospho-CREB antibody (Cell Signaling Technologies)) made in 5% milk. Membranes were washed three times in Tris-buffered saline with Triton X-100 before secondary antibody incubation. IR dye-conjugated antibodies (donkey-anti-mouse 800CW and goat-anti-rabbit 680RD (LICOR)) were diluted 1:5000 in 5% milk. Membranes were incubated in this solution for 1 h at room temperature. Incubation was followed by 3 washes in Triton X-100. After washing blots were scanned using an Odyssey scanner (LICOR), light intensity in both the 700 and 800 channels was quantified using Odyssey software, and data were analyzed with GraphPad Prism. Blot raw images were adjusted in Adobe Photoshop by inverting colors and adjusting brightness on all blots at the same time to make bands clear.
Data analysis
Ca2+ and membrane potential traces
Data shown are representative of at least three independent experiments. Both Ca2+ and membrane potential experimental data were corrected for by subtracting the average fluorescence from baseline measurements. For Ca2+ and membrane potential traces three replicates of each condition were averaged, and standard error between these replicates was used to determine error bars, which indicate the internal replicate error.
Dose-response curves
For dose-response curves the maximum Ca2+ response from individual Ca2+ traces was plotted against drug concentration. These data were fitted to a sigmoidal dose-response curve with a Hill coefficient of 1.0 using GraphPad Prism. The error bars shown in these curves correspond to the S.E. obtained from three independent experiments.
cAMP accumulation assays
All cAMP experiments were carried out alongside a standard cAMP curve, which was used to convert optical density measurements into cAMP concentration. The data from three independent experiments were averaged to construct cAMP bar graphs, and the statistical differences between samples treated with test drugs and their respective controls were determined by use of an unpaired two-tailed t test. Specific p values for each figure are indicated in their respective figure legends. The error bars in these plots represent the S.E. of the three independent experiments. The statistical significance in the difference of cAMP accumulation from various samples was determined by applying two-tailed non-parametric t tests to the data from three or more independent experiments, and the corresponding p values are reported. The use of a t test for statistical analysis assumes that samples that are compared with each other have similar variances (which logically applies in our case as in our experiments the only difference between drug-treated samples and controls is the actual drug treatment). However, in experiments testing the effect of AC inhibitors, the variance for measurements after ddAd treatment is substantially lower than for the other samples, likely as an artifact of a low n. We, therefore, analyzed using both the observed sample variance (p = 0.0059) and the larger variance for the samples treated with SQ 22,536 (p = 0.0086), with the latter considered the more reliable analysis. Likewise, the variances of control and CTX-treated samples are different because the variance increases as the size of the signal (i.e. relative sample S.D. are similar but absolute variances are not) so that the non-CTX-treated samples with virtually no signal yield an artificially low variance. Assuming a larger variance for the control samples (i.e. the variance of the CTX treated samples), the p value continues to be significant (p = 0.0014 versus p = 0.0004 with the observed sample variance).
Phospho-CREB accumulation semiquantitative immunoblots
After blotting, membranes were scanned on an Odyssey scanner. The blots shown are representative of two internal replicates and three independent experiments. Data from CREB and pCREB bands were collected with Odyssey software. After background subtraction, pCREB/CREB values were calculated, and the data were normalized by dividing by the respective control value so that control samples have a pCREB/CREB value of 1.0. The data from three independent experiments were averaged and used to plot pCREB/CREB bar graphs. One-sample t tests were used to determine whether the differences between the means of drug-treated samples were significantly different to a theoretical mean of 1.0 representing the control sample. Specific p values for each plot are indicated in figure legends. The error bars in these plots also represent the S.E. from the three independent experiments.
Author contributions
M. G.-M. designed, performed, and analyzed most experiments and contributed to the writing of the manuscript. S. J. W. designed, performed, and analyzed some of the experiments and contributed to the writing of the manuscript. G. J. R. made the initial discovery that led to the project. O. L. provided input on experiments and project directions. T. G. W. provided guidance with experimental design and project directions and contributed to the writing of this manuscript. All authors reviewed the results and approved the final version of the manuscript.
Supplementary Material
Acknowledgments
We thank Dr. Michael X. Zhu of the University of the Texas Health Science Center at Houston for kindly sharing his HEK-TRPC4β and HEK-μOR-TRBC4β cells. Special thanks to Dr. James Mancuso for helpful comments on the manuscript and to Dr. Melina A. Agosto for invaluable help and suggestions throughout the development of this project and preparation of the manuscript. We thank Tyler Hilton of Baylor College of Medicine for preparing CEL1 nuclease. This project was supported by the Cell-Based Assay Screening Service core (with special thanks to Drs. D. Liu and J. Xu) at Baylor College of Medicine with funding from the NIH (P30 CA125123).
This work was supported by National Institutes of Health Grant R01-GM66099 (to O. L.) and Training Grants T32-EY007102 and T32-GM008280 (to M. G.-M.). This work was also supported by The Welch Foundation Q0035 (to T. G. W.) and by Cancer Center Support Grant P30-CA125123.
The authors declare that they have no conflicts of interest with the contents of this article. The content is solely the responsibility of the authors and does not necessarily represent the official views of the National Institutes of Health.
This article contains supplemental Table S1 and Fig. S1.
- GPCRs
- G-protein-coupled receptors
- AR
- adrenergic receptor
- μOR
- μ-opioid receptor
- AC
- adenylate cyclase
- CTX
- cholera toxin
- CREB
- cAMP response element-binding protein
- ddAd
- 2′5′-dideoxyadenosine
- EPAC
- exchange protein activated by cAMP
- InsP3(R)
- inositol-1,4,5-trisphosphate (receptor)
- ISO
- isoproterenol
- NE
- norepinephrine
- PLC
- phospholipase C
- PTX
- pertussis toxin
- TRPC4β
- transient receptor potential channel-4-β
- IBMX
- 3-isobutyl-1-methylxanthine
- KRH
- Krebs/Ringer/HEPES
- 2-APB
- 2-aminoethoxydiphenyl borate.
References
- 1. Milligan G., Svoboda P., and Brown C. M. (1994) Why are there so many adrenoceptor subtypes? Biochem. Pharmacol. 48, 1059–1071 [DOI] [PubMed] [Google Scholar]
- 2. Hoffmann C., Leitz M. R., Oberdorf-Maass S., Lohse M. J., and Klotz K. N. (2004) Comparative pharmacology of human β-adrenergic receptor subtypes: characterization of stably transfected receptors in CHO cells. Naunyn Schmiedebergs Arch. Pharmacol. 369, 151–159 [DOI] [PubMed] [Google Scholar]
- 3. Weitl N., and Seifert R. (2008) Distinct interactions of human β1- and β2-adrenoceptors with isoproterenol, epinephrine, norepinephrine, and dopamine. J. Pharmacol. Exp. Ther. 327, 760–769 [DOI] [PubMed] [Google Scholar]
- 4. Bylund D. B., Eikenberg D. C., Hieble J. P., Langer S. Z., Lefkowitz R. J., Minneman K. P., Molinoff P. B., Ruffolo R. R. Jr., and Trendelenburg U. (1994) International Union of Pharmacology nomenclature of adrenoceptors. Pharmacol. Rev. 46, 121–136 [PubMed] [Google Scholar]
- 5. Summers R. J., Kompa A., and Roberts S. J. (1997) β-adrenoceptor subtypes and their desensitization mechanisms. J. Auton. Pharmacol. 17, 331–343 [DOI] [PubMed] [Google Scholar]
- 6. Manglik A., and Kobilka B. (2014) The role of protein dynamics in GPCR function: insights from the β2AR and rhodopsin. Curr. Opin. Cell Biol. 27, 136–143 [DOI] [PMC free article] [PubMed] [Google Scholar]
- 7. Giembycz M. A., and Newton R. (2006) Beyond the dogma: novel β2-adrenoceptor signalling in the airways. Eur. Respir. J 27, 1286–1306 [DOI] [PubMed] [Google Scholar]
- 8. Giovannucci D. R., Sneyd J., Groblewski G. E., and Yule D. I. (2000) Modulation of InsP3 receptor properties by phosphorylation: targeting of PKA to InsP3 receptors shapes oscillatory calcium signals in pancreatic acinar cells. J. Korean Med. Sci. 15, S55–S56 [DOI] [PMC free article] [PubMed] [Google Scholar]
- 9. Betzenhauser M. J., Fike J. L., Wagner L. E. 2nd, and Yule D. I. (2009) Protein kinase A increases type-2 inositol 1,4,5-trisphosphate receptor activity by phosphorylation of serine 937. J. Biol. Chem. 284, 25116–25125 [DOI] [PMC free article] [PubMed] [Google Scholar]
- 10. Pereira L., Ruiz-Hurtado G., Morel E., Laurent A. C., Métrich M., Domínguez-Rodríguez A., Lauton-Santos S., Lucas A., Benitah J. P., Bers D. M., Lezoualc'h F., and Gómez A. M. (2012) Epac enhances excitation-transcription coupling in cardiac myocytes. J. Mol. Cell Cardiol. 52, 283–291 [DOI] [PMC free article] [PubMed] [Google Scholar]
- 11. Oestreich E. A., Wang H., Malik S., Kaproth-Joslin K. A., Blaxall B. C., Kelley G. G., Dirksen R. T., and Smrcka A. V. (2007) Epac-mediated activation of phospholipase Cϵ plays a critical role in β-adrenergic receptor-dependent enhancement of Ca2+ mobilization in cardiac myocytes. J. Biol. Chem. 282, 5488–5495 [DOI] [PubMed] [Google Scholar]
- 12. Schmidt M., Evellin S., Weernink P. A., von Dorp F., Rehmann H., Lomasney J. W., and Jakobs K. H. (2001) A new phospholipase-C-calcium signalling pathway mediated by cyclic AMP and a Rap GTPase. Nat. Cell Biol. 3, 1020–1024 [DOI] [PubMed] [Google Scholar]
- 13. Ran F. A., Hsu P. D., Wright J., Agarwala V., Scott D. A., and Zhang F. (2013) Genome engineering using the CRISPR-Cas9 system. Nat. Protoc. 8, 2281–2308 [DOI] [PMC free article] [PubMed] [Google Scholar]
- 14. Qiu P., Shandilya H., D'Alessio J. M., O'Connor K., Durocher J., and Gerard G. F. (2004) Mutation detection using surveyor nuclease. Biotechniques 36, 702–707 [DOI] [PubMed] [Google Scholar]
- 15. Rodriguez G. J., Yao R., Lichtarge O., and Wensel T. G. (2010) Evolution-guided discovery and recoding of allosteric pathway specificity determinants in psychoactive bioamine receptors. Proc. Natl. Acad. Sci. U.S.A. 107, 7787–7792 [DOI] [PMC free article] [PubMed] [Google Scholar]
- 16. Daaka Y., Luttrell L. M., and Lefkowitz R. J. (1997) Switching of the coupling of the β2-adrenergic receptor to different G proteins by protein kinase A. Nature 390, 88–91 [DOI] [PubMed] [Google Scholar]
- 17. Horn V. J., Baum B. J., and Ambudkar I. S. (1988) β-adrenergic receptor stimulation induces inositol trisphosphate production and Ca2+ mobilization in rat parotid acinar cells. J. Biol. Chem. 263, 12454–12460 [PubMed] [Google Scholar]
- 18. Cook D. I., Day M. L., Champion M. P., and Young J. A. (1988) Ca2+ not cyclic AMP mediates the fluid secretory response to isoproterenol in the rat mandibular salivary gland: whole-cell patch-clamp studies. Pflugers Arch. 413, 67–76 [DOI] [PubMed] [Google Scholar]
- 19. Helman J., Ambudkar I. S., and Baum B. J. (1987) Adrenoreceptor mobilization of calcium in rat submandibular cells. Eur. J. Pharmacol. 143, 65–72 [DOI] [PubMed] [Google Scholar]
- 20. Tojyo Y., Tanimura A., Nezu A., and Matsumoto Y. (1998) Activation of β-adrenoceptors does not cause any change in cytosolic Ca2+ distribution in rat parotid acinar cells. Eur. J. Pharmacol. 360, 73–79 [DOI] [PubMed] [Google Scholar]
- 21. Stallaert W., Dorn J. F., van der Westhuizen E., Audet M., and Bouvier M. (2012) Impedance responses reveal β2-adrenergic receptor signaling pluridimensionality and allow classification of ligands with distinct signaling profiles. PLoS ONE 7, e29420. [DOI] [PMC free article] [PubMed] [Google Scholar]
- 22. Soltoff S. P., and Hedden L. (2010) Isoproterenol and cAMP block ERK phosphorylation and enhance [Ca2+]i increases and oxygen consumption by muscarinic receptor stimulation in rat parotid and submandibular acinar cells. J. Biol. Chem. 285, 13337–13348 [DOI] [PMC free article] [PubMed] [Google Scholar]
- 23. Pera T., and Penn R. B. (2014) Crosstalk between β2-adrenoceptor and muscarinic acetylcholine receptors in the airway. Curr. Opin. Pharmacol. 16, 72–81 [DOI] [PMC free article] [PubMed] [Google Scholar]
- 24. Copik A. J., Ma C., Kosaka A., Sahdeo S., Trane A., Ho H., Dietrich P. S., Yu H., Ford A. P., Button D., and Milla M. E. (2009) Facilitatory interplay in α1a- and β2-adrenoceptor function reveals a non-Gq signaling mode: implications for diversification of intracellular signal transduction. Mol. Pharmacol. 75, 713–728 [DOI] [PubMed] [Google Scholar]
- 25. Kurian N., Hall C. J., Wilkinson G. F., Sullivan M., Tobin A. B., and Willars G. B. (2009) Full and partial agonists of muscarinic M3 receptors reveal single and oscillatory Ca2+ responses by β2-adrenoceptors. J. Pharmacol. Exp. Ther. 330, 502–512 [DOI] [PMC free article] [PubMed] [Google Scholar]
- 26. Bootman M. D., Rietdorf K., Collins T., Walker S., and Sanderson M. (2013) Loading fluorescent Ca2+ indicators into living cells. Cold Spring Harb. Protoc. 2013, 122–125 [DOI] [PubMed] [Google Scholar]
- 27. Offermanns S., and Simon M. I. (1995) Gα15 and Gα16 couple a wide variety of receptors to phospholipase C. J. Biol. Chem. 270, 15175–15180 [DOI] [PubMed] [Google Scholar]
- 28. Wu D., Kuang Y., Wu Y., and Jiang H. (1995) Selective coupling of β2-adrenergic receptor to hematopoietic-specific G proteins. J. Biol. Chem. 270, 16008–16010 [DOI] [PubMed] [Google Scholar]
- 29. Wenzel-Seifert K., and Seifert R. (2000) Molecular analysis of β2-adrenoceptor coupling to Gs, Gi, and Gq proteins. Mol. Pharmacol. 58, 954–966 [DOI] [PubMed] [Google Scholar]
- 30. Kang H. J., Menlove K., Ma J., Wilkins A., Lichtarge O., and Wensel T. G. (2014) Selectivity and evolutionary divergence of metabotropic glutamate receptors for endogenous ligands and G proteins coupled to phospholipase C or TRP channels. J. Biol. Chem. 289, 29961–29974 [DOI] [PMC free article] [PubMed] [Google Scholar]
- 31. Ahn S., Shenoy S. K., Wei H., and Lefkowitz R. J. (2004) Differential kinetic and spatial patterns of β-arrestin and G protein-mediated ERK activation by the angiotensin II receptor. J. Biol. Chem. 279, 35518–35525 [DOI] [PubMed] [Google Scholar]
- 32. Camps M., Hou C., Sidiropoulos D., Stock J. B., Jakobs K. H., and Gierschik P. (1992) Stimulation of phospholipase C by guanine-nucleotide-binding protein βγ subunits. Eur. J. Biochem. 206, 821–831 [DOI] [PubMed] [Google Scholar]
- 33. Shenoy S. K., and Lefkowitz R. J. (2011) β-Arrestin-mediated receptor trafficking and signal transduction. Trends Pharmacol. Sci. 32, 521–533 [DOI] [PMC free article] [PubMed] [Google Scholar]
- 34. DeWire S. M., Ahn S., Lefkowitz R. J., and Shenoy S. K. (2007) β-Arrestins and cell signaling. Annu. Rev. Physiol. 69, 483–510 [DOI] [PubMed] [Google Scholar]
- 35. Shukla A. K., Xiao K., and Lefkowitz R. J. (2011) Emerging paradigms of β-arrestin-dependent seven transmembrane receptor signaling. Trends Biochem. Sci. 36, 457–469 [DOI] [PMC free article] [PubMed] [Google Scholar]
- 36. Till B.J., Burtner C., Comai L., and Henikoff S. (2004) Mismatch cleavage by single-strand specific nucleases. Nucleic Acids Res. 32, 2632–2641 [DOI] [PMC free article] [PubMed] [Google Scholar]
Associated Data
This section collects any data citations, data availability statements, or supplementary materials included in this article.