Abstract
An in-situ and real-time electrochemical study in a vascular bioreactor was designed to analyze corrosion mechanism of magnesium alloy (MgZnCa) under mimetic hydrodynamic conditions. Effect of hydrodynamics on corrosion kinetics, types, rates and products was analyzed. Flow-induced shear stress (FISS) accelerated mass and electron transfer, leading to an increase in uniform and localized corrosions. FISS increased the thickness of uniform corrosion layer, but filiform corrosion decreased this layer resistance at high FISS conditions. FISS also increased the removal rate of localized corrosion products. Impedance-estimated and linear polarization-measured polarization resistances provided a consistent correlation to corrosion rate calculated by computed tomography.
Keywords: Magnesium, Flow induced corrosion, Monitoring, Vascular bioreactor, EIS
1. Introduction
Absorbable metals have a dynamic corrosion profile depending on the environments [1,2]. The accurate and comprehensive determination of corrosion behavior for absorbable metals is a crucial technological issue [3]. Thus, the test environment and operational parameters for studied systems should be carefully selected according to specific applications [4]. Magnesium (Mg)-based vascular stents have received considerable attention due to their absorbable potential in vivo [5–7]. In fact, the in vivo condition around an implant critically determines the implant’s chemical dynamic processes. For example, the flow of blood plays a significant role in the initial stage of Mg-based stent degradation, as circulatory blood is in the immediate contact with stent surface before endothelialization [4,8,9]. Various vessels in human body are exposed to wall shear stresses associated with different mean values [4], such as 0.68 ± 0.03 Pain coronary artery, 0.36 ± 0.16 Pa in femoral artery, 0.35 ± 0.08 Pa in supraceliac aorta, 0.13 ± 0.06 Pa in infrarenal aorta. Mg-based stents at different implanted positions undergo different blood flow-induced shear stresses, leading to varying biodegradation behavior. It is thus important to understand how the flow affects the Mg corrosion mechanism.
The effect of flow on metal corrosion is a complex phenomenon depending on the chemistry and physics of the metal and solution [10]. Studies have demonstrated that the corrosion rates of Mg and its alloys would increase under dynamic conditions, such as local peri-implant perfusion in vivo [11], flowing [12], circulating [13], and rotating [14] conditions compared with static conditions. Furthermore, corrosion types can be affected by flow induced shear stress. For example, Mg alloy (AM60B-F) surface was protected from localized corrosion at a low shear stress (0.88 Pa), while more severe uniform corrosion and localized corrosion occurred at a high shear stress (8.8 Pa) [9]. In addition, it has been shown that flow can prevent the accumulation of corrosion products on pure Mg [2,15].
Mg and its alloys have a high reactivity of corrosion which is attributed to the rapid anodic dissolution tendency of Mg and the multiple types of corrosion [16,17], such as uniform, localized or filiform corrosion, simultaneously occurring on the surface [18,19]. Therefore, it is complicated to establish a relationship between fluid dynamics, mass transport, and the chemical and electrochemical reactions occurring on the surface of Mg. There are many parameters [20,21] that have been identified as important factors for the accurate determination of Mg corrosion, and these factors may vary from test to test, as noted by Kirkland [22]. To study these issues more precisely, some combined experiments are developed to make use of the relative merits of individual testing methods in more recent work. King et al. [3] designed an investigation to permit in-situ electrochemical impedance spectroscopy (EIS) and H2 collection, along with subsequent mass loss measurement. The results provided an excellent correlation between mass loss, hydrogen gas collection and EIS-estimated polarization resistance. Doepke et al. [23] developed a real-time monitoring of soluble corrosion products OH−, Mg2+, and H2 during immersion tests, commonly used to study the corrosion of Mg materials. This instrumentation was also developed to record EIS simultaneously in the same solution to monitor changes in the Mg samples. Curioni [24] investigated potentiodynamic polarization behavior of Mg electrodes complemented with real-time direct measurement of the amount of hydrogen evolved and real-time optical imaging of the electrode surface. Lebouil et al. [25] provided a novel approach to on-line measurement of gas evolution kinetics from Mg corrosion in a microfluidic system, based on an electrochemical cell and a time resolved atomic emission spectroscopic detection. Rossrucker et al. [26] studied the dissolution of Mg using an electrochemical flow cell combined with online analytics, particularly electrochemical polarization experiments and Mg concentrations detected downstream via inductively coupled plasma-mass spectroscopy.
An accurate technique, particularly in-situ and real-time assessment, is important for the determination of corrosion activity and corrosion rate, evolution of corrosion products and types, and acquisition of corrosion mechanisms and knowledge in a vascular environment. Our previous work [27] has established an essential foundation for the study of flow-induced corrosion behavior of Mg-based stent in a mimicking vascular environment. However, the electrochemical technology to study the corrosion mechanisms and kinetics of Mg in a simulated vascular dynamic environment is still lacking.
Because of the complex nature of the Mg corrosion types, complementary techniques should be used, especially based on the microscopic views of surface areas under investigation, to detect the changes of the surface morphology [28]. In this work, a three-electrode cell was introduced into a fluid dynamic vascular bioreactor to monitor in-situ and real-time corrosion behavior of Mg alloy as a function of flow-induced shear stress (FISS). Based on electrochemical impedance spectroscopy, polarization resistance and surface morphology, more determinant corrosion behavior, such as corrosion activities, types, rates and products, were analyzed in details. It is expected that the study will establish a simple technique to analyze flow/Mg alloy interactions and provide a deeper understanding of corrosion and product formation.
2. Experimental
2.1. Preparation of Mg alloy
A Mg-based alloy with the nominal composition of 5 wt.% zinc (Zn) and 0.3 wt.% calcium (Ca) was processed from high purity Mg ingot (99.77%, US Magnesium), pure Zn shot (99.99%, Alfa Aesar) and pure Ca granules (99.5%, Alfa Aesar). The details of the process can be found in Ref. [29]. Melting and alloying operations were performed in a low carbon steel crucible in an ultra-high-purity argon environment. Pure Mg ingot was melted at 710 °C until it is fully melted, and then zinc and calcium was added and kept for 10 min before applying stirring. Mechanical stirring was applied for 15 min to help provide a homogeneous element distribution. The melt was then raised to 730 °C and was held still for 30 min. Afterwards, it was poured through a ceramic filter to a horizontal steel mold which was heated to about 250 °C. The cast was allowed to cool down in the same argon environment.
Rectangular specimens with dimensions of 5 mm × 2.7 mm × 1 mm were mechanically ground and polished with silicon carbide (SiC) paper successively from 400 grit to 1000 grit with water and then polished with 1200 grit SiC paper with isopropyl alcohol. Specimens were then ultrasonically degreased with acetone, cleaned with ethanol, and dried using compressed air.
2.2. Vascular bioreactor with an electrochemical monitoring system
To effectively study, model and optimize the effect of flow on the Mg corrosion, we developed an in-situ and real-time monitoring equipment combining a vascular bioreactor and an electrochemical measurement system (Fig. 1). The vascular bioreactor, according to our latest work [27], was developed to imitate physiological conditions encountered in vessels. It consists of a test channel (tygon tubing with an inner diameter of 3.2 mm), electrolyte (Dulbeco’s modified Eagle’s medium (DMEM, Bioind®, USA) with 10% fetal bovine serum and 1% penicillin-streptomycin, the composition of DMEM is summarized in Table 1), variable-flow pump, reservoir and incubator (37 °C, 5% CO2, 95% RH). A typical three-electrode cell was introduced into the vascular bioreactor. It consists of a Ag/AgCl/3 M KCl reference electrode (RE-6 (MW-2030), BASi®, USA), a platinum wire counter electrode, and the MgZnCa specimen sealed by epoxy resin (Epokwick®Epoxy resin, Buehler, USA) with an exposed area of 13.5 mm2 as the working electrode. A potentiostat (Gamry® Instruments, USA) was used to perform EIS, open circuit potential (OCP) and linear polarization measurement (LPM) studies in 30-min loop measurements for 24 h. Impedance was measured over a frequency range of 100 kHz–0.1 Hz with 10 mVrms of amplitude of sinusoidal potential signals with respect to OCP. LPM was measured in the potential scan range of ±10 mV from the measured OCP with a scan rate of 0.25 mV s−1.
Fig. 1.
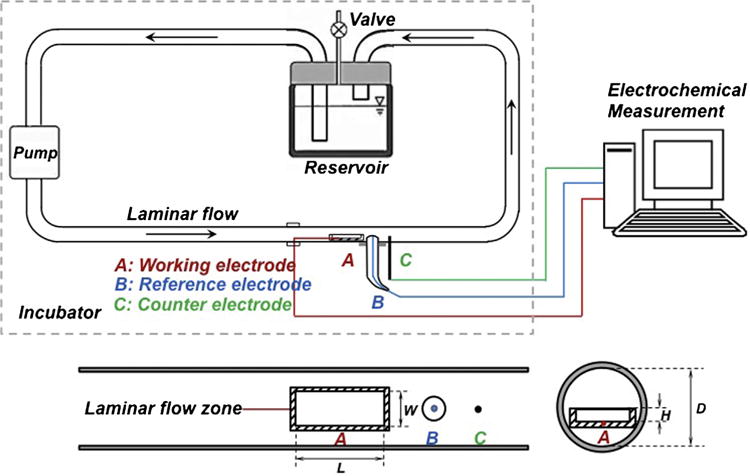
Schematic of the vascular bioreactor with an electrochemical monitoring system and close-up upside view of the test channel with the cross section view of specimen in place. Note: L = length of the specimen; W = width of the specimen; H = height of the specimen; D = inner diameter of test channel.
Table 1.
Composition of corrosion medium/electrolyte DMEM.
| Component | Concentrate (mg/L) |
|---|---|
| Inorganic salts | |
| Calcium chloride (CaCl2·2H2O) | 264.92 |
| Ferric Nitrate (Fe(NO3)3·9H2O) | 0.10 |
| Magnesium sulphate (MgSO4·7H2O) | 200.00 |
| Potassium chloride (KCl) | 400.00 |
| Sodium bicarbonate (NaHCO3) | 3700.00 |
| Sodium chloride (NaCl) | 6400.00 |
| Sodium phosphate monobasic (NaH2PO4·2H2O) | 125.00 |
| Other components | |
| D-Glucose (dextrose) | 1000.00 |
| Phenol red | 15.00 |
| Sodium pyruvate | 110.00 |
| Amino acids | |
| L-Arginine-HCl | 84.00 |
| L-Cystine | 48.00 |
| Glycine | 30.00 |
| L-Histidine HCl–H2O | 42.00 |
| L-Isoleucine | 105.00 |
| L-LEUCINE | 105.00 |
| L-Lysine-HCl | 146.00 |
| L-Methionine | 30.00 |
| L-Phenylalanine | 66.00 |
| L-Senrine | 42.00 |
| L-Threonine | 95.00 |
| L-Tryptophan | 16.00 |
| L-Tyrosine | 72.00 |
| L-Valine | 94.00 |
| Vitamins | |
| D-Calcium pantothenate | 4.00 |
| Choline Chloride | 4.00 |
| Folic Acid | 4.00 |
| i-Inositol | 7.20 |
| Niacinamide | 4.00 |
| Pyridoxal HCl | 4.00 |
| Riboflavin | 0.40 |
| Thiamine HCl | 4.00 |
2.3. Simulation of FISS distribution on the surface
Computational fluid dynamics (CFD) simulation was used to predict FISS distribution on the MgZnCa strip surface as a function of the flow rate using COMSOL Multiphysics® software. The mathematical model assumed an incompressible and isotropic Newtonian fluid. The FISS on a two-dimensional (2-D) surface was calculated by Eq. (1) [30]:
| (1) |
where η is the shear viscosity of the fluid, xi is the ith spatial coordinate, vi is the fluid’s velocity in the direction of axis i, τij is the jth component of the stress acting on the faces of the fluid element perpendicular to axis i. The viscosity and density of DMEM with supplements are 0.78 mPa s and 0.99 g cm−3 at 37 °C [31]. The diameter (D) of the inner of the tubing was 3.2 mm. Different values of flow rate (i.e., 0, 5, 10, 20 and 40 ml min−1) were used to simulate the experimental conditions. The inlet boundary condition was laminar flow rate with 1 m in entrance length, and the outlet boundary condition was laminar outflow with zero pressure and 1 m in exit length. FISS distribution on the strip surface as a function of the flow rate was calculated.
2.4. Morphology and corrosion products characterization
Morphologies and chemical compositions of alloys and corrosion products formed on the samples were analyzed using a field emission scanning electron microscope (SEM; SU8000, Hitachi, Japan) and electron dispersive X-ray spectroscopy (EDX; Bruker AXS5350, Germany) after sputter coating. The samples for cross sectional investigation of corrosion products were prepared through polishing after mounting with epoxy resin. The samples were also analyzed by micro X-ray computed tomography (micro-CT; GE Phoenix Nanotom-M™, GE Sensing & Inspection Technologies GmbH). The X-ray emission parameters of the micro-CT included a voltage of 80 kV and a current of 80 μA. The 2-D planes and the three-dimensional (3-D) models were reconstructed using the phoenix datos|x software. Localized corrosion coverage ratios and corrosion product removal coverage ratios of the samples at different depths were calculated from 2-D images using Image-Pro® Plus.
2.5. Corrosion rate calculation
Average corrosion rates depending on the reduction of the metallic volume after the corrosion were calculated from the obtained CT 3-D data. Assuming uniform corrosion, the reduction of the alloy volume could be converted into an average corrosion rate by using a modification of Eq. (2) [32]:
| (2) |
where ΔV is the volume loss calculated from CT data analysis using VG Studio Max software (v 2.1), which is equal to the residual alloy volume (without corrosion product volume) subtracted from the initial implant volume, A is the implant surface area exposed to corrosion, and t is the exposure time. The number of repeats was three in this study.
3. Results and discussion
3.1. Computational fluid dynamic simulation
Fluid flow need be expressed in terms of broadly flow parameters that are common to all hydrodynamic systems and that effectively define the interaction of the fluid with the metal surface. The parameters that best fit this requirement are shear stress and mass transfer [10]. Computational fluid dynamic calculations were conducted to evaluate FISS distribution on the whole exposed surface as a function of the fluid flow rate (Fig. 2). To avoid edge effects, the middle area (3 mm × 1.5 mm) of the sample surface (defined as the ‘test area’) was used for further observation and analysis (Fig. 2b). The average FISS values on the test area were approximately 0, 0.07, 0.15, 0.31, and 0.62 Pa, resulting from CFD simulations under the inlet flow rates of 0, 5, 10, 20, and 40 ml min−1, respectively. A single CFD contour at the inlet flow rate condition of 10 ml min−1 is shown as an example of the one of the CFD simulations (Fig. 2a). Mass transfer defines the chemical and electrochemical effects of fluid flow [10,33]. The mass transfer coefficient (k) can be related to the shear stress (τ) by the Chilton–Colburn analogy [10]:
| (3) |
where ρ is fluid density (kg m−3) and Sc is the Schmidt number. The density DMEM with supplements is 990 kg m−3. The major constituent of DMEM is sodium chloride, and the Sc of sodium chloride is 540 for dilute solution in water. The flow rate, flow-induced shear stress and mass transfer coefficient are listed in Table 2. To simplify the model, the initial shear stresses were applied to describe the test conditions. Actually, the shear stress on the sample surface should be slightly changed with the corrosive morphologies as the corrosion evolution.
Fig. 2.
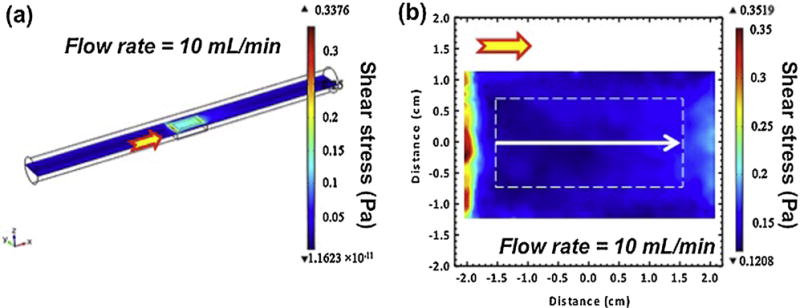
A typical single CFD contour (a) and a 2-D slice of test area in a white dashed box (b) at the inlet flow rate of 10 ml min−1 condition. The arrows on the channel indicate the flow direction of corrosion medium in the bioreactor.
Table 2.
The flow rate, flow-induced shear stress and mass transfer coefficient at each condition.
| Flow rate (mL min−1) | Shear stress (Pa) | Mass transfer coefficient (m s−1) |
|---|---|---|
| 0 | 0 | 0 |
| 5 | 0.07 | 9.6 |
| 10 | 0.15 | 14.1 |
| 20 | 0.31 | 20.2 |
| 40 | 0.62 | 28.6 |
3.2. Corrosion types of MgZnCa alloy under different flow conditions
Based on the corrosion morphologies (Fig. 3), the flow mainly affects two types of corrosion, uniform corrosion and localized corrosion. The macro-morphologies suggest that localized corrosion events dominate the corrosion processes on the overall surface of the test areas (Fig. 3a–c). The relatively flat regions represent uniform corrosion with complete corrosion layer (Fig. 3d–f). Under the static condition (FISS = 0 Pa), some pieces of corrosion products deposit on the surface. With the increase of FISS, severer localized corrosion attacks and faster removal of corrosion products on the localized corrosion areas are clearly observed (Fig. 3a–c), and a growing attacks of filiform corrosion appear on the micro-morphologies surfaces of the uniform corrosion areas (Fig. 3d–f).
Fig. 3.
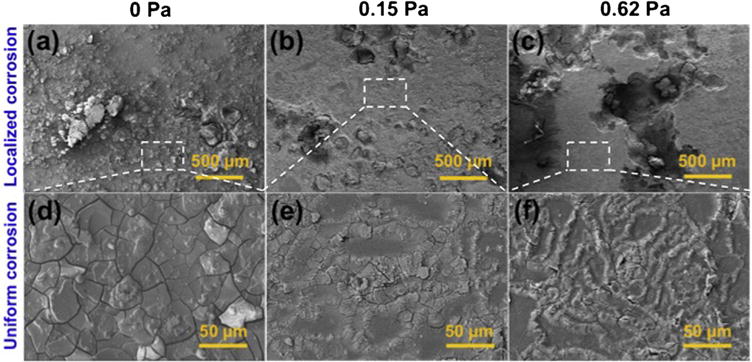
SEM images of the localized and uniform corrosion regions on the surface of the test areas under the FISS values of 0, 0.15 and 0.62 Pa.
3.3. In-situ and real-time EIS
One key aspect to this investigation, which differs it from previous Mg electrochemical studies, is to understand the hydrodynamic corrosion mechanism of Mg utilizing an in-situ and real-time approach. In the case of hydrodynamic environment, the in-situ data can provide more reliable results. As described in the introduction, the rapid fluctuation on anodic characteristics of Mg makes the Tafel extrapolation technique essentially reliable only for the short-term or transient estimation of corrosion rate, while for that long-term corrosion determination EIS is more applicable, non-destructive and can perform continuous monitoring [3]. Furthermore, EIS tests can provide quantitative information on the corrosion process at the electrolyte/electrode interface as well as the changes of the electrode [18].
The EIS spectra of the typical specimens at the FISS values of 0, 0.07, 0.15, 0.31, and 0.62 Pa conditions are periodically recorded over 24 h in Fig. 4. Three time constants can be determined from the Bode plots of phase angle vs. frequency, which is in accord with the feature of the Nyquist plots. Two capacitive loops at high and medium frequencies and one inductive loop at low frequencies can be obviously identified on the most of Nyquist plots except the plots in the FISS values of 0 and 0.07 Pa conditions at 0.5 h. It is also evident that the phase angles are less than 0° in the low frequency range, indicating the inductance behavior [34]. In terms of the plots in the FISS values of 0 and 0.07 Pa conditions at 0.5 h, the impedance at low frequency is the sum of the contribution of a high capacitance and a low inductance, which leads to an invisible inductive loop and positive phase angles. A three-time-constant electrical equivalent circuit (EEC) is used to fit the impedance response (Fig. 5). By using this EEC a good fit is obtained with an average value of χ2 = 3.7 × 10⁻⁴ ± 1.5 × 10⁻⁴. A constant phase element (CPE) is used to model the electrode capacitive behavior in the practical situation. CPE is often used to describe a non-ideal capacitive behavior due to different factors such as distributed surface reactivity, surface inhomogeneity, roughness or fractal geometry, electrode porosity and non-uniform current and potential distributions [35]. The impedance of a CPE is given by the following Eq. (4):
| (4) |
where Z is the CPE impedance (Ω cm2), Q is a constant with units Ω−1 cm−2 sn, n is a dimensionless constant in the range −1 ≤ n ≤ 1, j is the imaginary number j = (−1)0.5 and Ω is the angular frequency (Ω = 2πf, f being the frequency in Hz). An ideal capacitor behavior yields n = 1, a resistor yields n = 0 and an inductor yields n = −1, while n = 0.5 represents the response of mass-transport processes [20].
Fig. 4.
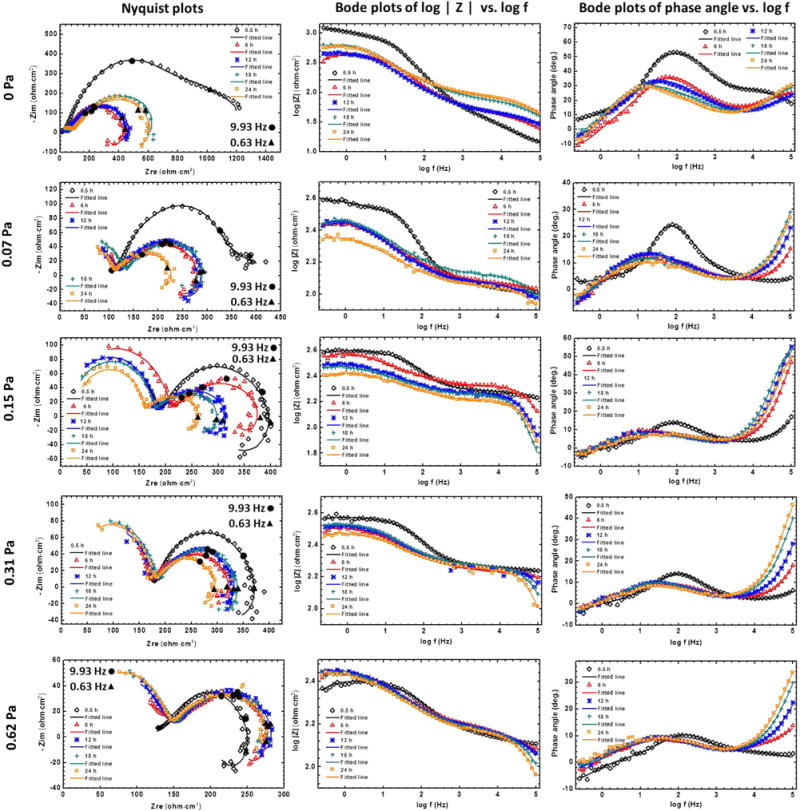
EIS and fitted results for Mg alloys as the functions of time and FISS: Nyquist plots, bode plots of |Z| vs. frequency, and bode plots of phase angle vs. frequency. Symbols represent experimental values, whereas lines represent simulated spectra.
Fig. 5.
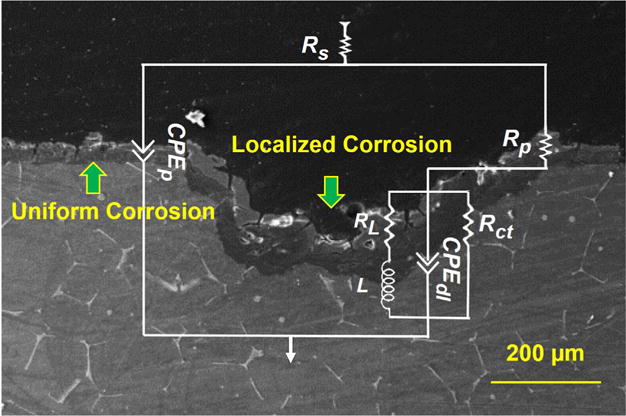
Equivalent electrical circuit (EEC) used to fit the EIS data shown on the cross-section of the corroded sample at each FISS and time condition.
The EEC physical interpretation was elaborated according to the following data reported in the literature for the corrosion of pure Mg. Assuming the MgZnCa alloy α-Mg matrix has a corrosion behavior similar to that of pure Mg, as has been pointed out by some authors for other Mg alloys [36,37]: (1) the corrosion layer is composed of a (hydro) oxide film between the electrolyte and the Mg matrix; and (2) Mg corrosion occurs on the corrosion film-free areas with the formation of adsorbed Mg intermediates. Thus, the Nyquist plots can be further analyzed as following: the resistance (Rp) and the combined capacitance (CPEp) of the uniform corrosion product layer shown in the capacitive loop at high frequencies can be related to mass transport relaxation due to the diffusion of Mg2+ species through the uniform corrosion layer [38]; the charge transfer resistance (Rct) and the combined electrochemical double layer capacitance (CPEdl) seen in the capacitive loop at medium frequencies can be related to charge transfer and electrochemical double-layer effects at the substrate/electrolyte interface; the inductance resistance (RL) and the inductance (L) shown in the inductive loop at low frequencies can be related to a relaxation process due to adsorption of Mg2+ intermediate species at localized defective sites [39]; and Rs describes the electrolyte resistance between the working and reference electrodes. A model of Rs(CPEp//(Rp(Rct//CPEdl//(RL L)))) (Fig. 5) is proposed as a corresponding EEC for fitting the EIS data [18], where “/” indicates series and “//” indicates parallel. The solid lines of the spectra produced from regression fits using the EEC in Fig. 5 show well correlation with the experimental data in Fig. 4. Similar circuits have also been used by King et al. to interpret the EIS diagram [3].
After verifying the circuit, the frequency dependent impedance response of the entire corrosion system can be determined by the simple circuit analysis and is described by Eq. (5):
| (5) |
where Zi presents the impedance value of ith element. Based on this equivalent circuit, the trends of variation of samples at the different FISS conditions were further analyzed to collectively account for the flow-induced corrosion behavior of the Mg alloy. Different from the traditional static test results [20,40], it is interesting that the resistances in the high-frequency capacitive loops are higher than that in the medium-frequency capacitive loops at the dynamic conditions (Fig. 4). This phenomenon becomes more apparent with the increase of FISS. A logically valid deduction is that the uniform corrosion product layer mainly contributed to the resistance under the flow conditions, compared with the charge transfer and double-layer effects.
3.4. Flow-induced uniform corrosion
The effect of fluid flow on the uniform corrosion layer was investigated by the EDX line analysis of the corroded alloys cross-sections and the real-time EEC calculation after the in-situ corrosion test. The evolution of the uniform corrosion with the increase of FISS is shown in Fig. 3d–f. Corrosion of Mg was associated with the growth of the corrosion product layer. The corrosion products consist of two main layers, an outer layer composes mainly of Ca and P and an inner layer composes of Mg and O (Fig. 6a). Mg ions released during corrosion participate in reactions with OH− from cathode sites, forming a Mg(OH)2 layer [21,28]. The local pH increased during the corrosion, causing the precipitation of a calcium phosphate complex (Ca–P) [41]. In Fig. 6b, MgO and/or Mg(OH)2 layers thicken with the increase of FISS, which indicates the increase of mass transfer from fluid flow can be the cause for the increase in corrosion rate [10,33]. However, the thicknesses of the Ca–P layers decreased with the further increase of FISS. This can be attributed to the fact that the high mechanical force prevents the precipitation of Ca–P. In addition, the accelerated arrival of the corrosive medium leads to increased ion diffusion to prevent the increase of local pH. Whilst Ca–P is easier to deposit on the alkaline surface under the slow diffusion condition [42]. As a result, the precipitation of the Ca–P was inhibited at the higher FISS conditions.
Fig. 6.
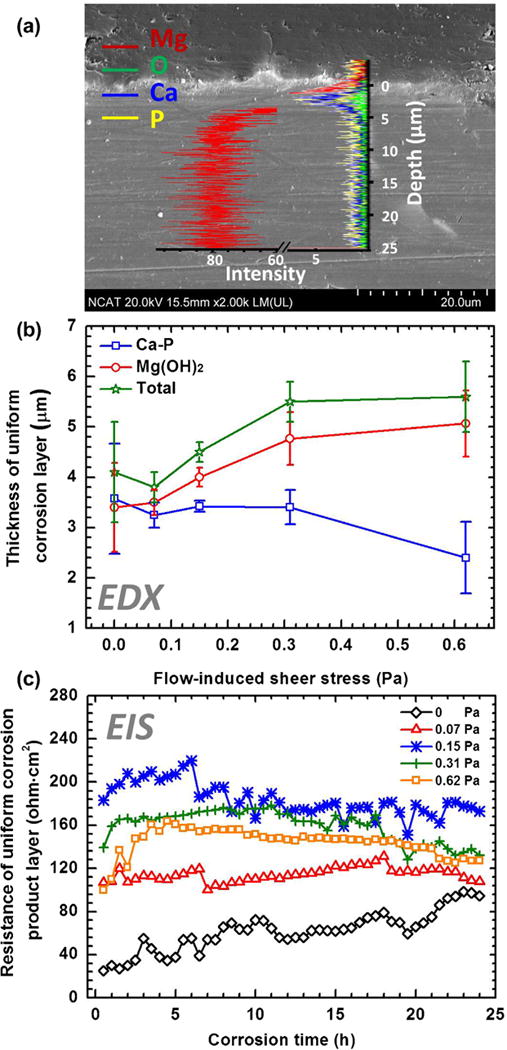
(a) Typical EDX line analysis of the cross sections of the uniform corrosion product layer at 0.15 Pa for 24 h. (b) Thickness of the entire, Ca–P and MgO/Mg(OH)2 layers as the functions of FISS on the uniform corrosion regions for all samples for 24 h. (c) The resistances of corrosion product layer as the functions of time and FISS.
The variation in resistance of the uniform corrosion product layer with FISS and time are represented in Fig. 6c. With the increase of the thickness of the entire corrosion layer, the Rp values of each EIS spectra during all the corrosion time increased when the FISS was increased from 0 Pa to 0.15 Pa, while then most of them decreased when the FISS continued to increase from 0.15 Pa to 0.62 Pa. Although these layers became thicker at the higher FISS conditions, they were more vulnerable to corrosion attack due to faster chloride ion arrival at the interface [43]. Also, more filiform corrosions [44] developed on the surfaces (Fig. 3d–f), providing ion diffusion channels for further corrosion. With prolonging time, the growth in Rp at 0 Pa of the quiescent environment is contributed to the deposition of corrosion products; Rp leveled off at 0.07 Pa, which might be caused by a thickening corrosion product layer and slight filiform corrosion. The initial increase and subsequently slow decrease of Rp at 0.15, 0.31 and 0.62 Pa could be due to corrosion product film thickening followed by a breakdown of the metastable corrosion product layer. This is consistent with a recent report in static simulated body fluid [45], which supports the reliability of the current experimental results. Also, the circuit path CPEp with time represents a typical variation in the impedance of uniform corrosion product layers at 0.15 Pa. The capacitors in the CPEp increased slightly with time along with the corresponding exponents (n) increased from 0.79 to 1, which is near ideal capacitive behavior (when n = 1). The representative values of the equivalent circuit components are listed in Table 3.
Table 3.
Typical results of fitting analysis from electrochemical impedance measurements of samples exposed in DMEM solution at 0.15 Pa after 0.5, 6, 12, 18 and 24 h.
| 0.5 h | 6 h | 12 h | 18 h | 24 h | ||
|---|---|---|---|---|---|---|
| Rs | (Ω cm2) | 1.84 × 10⁻⁶ | 9.70 × 10⁻⁸ | 10.86 | 19.91 | 26.79 |
| CPEp | (μF cm−2 s−n) | 4.66 × 10⁻² | 1.72 × 10⁻² | 1.80 × 10⁻² | 2.76 × 10⁻² | 3.53 × 10⁻² |
| n | – | 0.79 | 0.94 | 1 | 1 | 1 |
| Rp | (Ω cm2) | 192 | 244 | 166 | 154 | 131 |
| CPEdl | (μF cm−2 s−n) | 61 | 467 | 551 | 651 | 630 |
| n | – | 0.75 | 0.54 | 0.54 | 0.53 | 0.56 |
| Rct | (Ω cm2) | 209 | 187 | 157 | 143 | 117 |
| RL | (Ω cm2) | 235 | 319 | 225 | 237 | 201 |
| L | (Ω s cm2) | 546 | 278 | 303 | 291 | 287 |
3.5. Flow-induced localized corrosion
The effect of fluid flow on the localized corrosion was further investigated by the EDX mapping and CT analysis of the corroded alloys cross-sections, as well as, the real-time EEC calculation after the in-situ corrosion test. The evolution of the localized corrosion with the increase of FISS is shown in Fig. 3a–c. The growth of localized corrosion areas was associated with the removal of corrosion products. Both of them were notably observed on the cross sectional EDX images of the samples in Fig. 7. At the quiescent condition (0 Pa), the precipitated corrosion products covered the whole surface with a little localized corrosion. At the medium FISSs (e.g., 0.15 Pa), a part of the corrosion products peeled off from the localized corrosion areas. At the high FISSs (e.g., 0.62 Pa), most of the corrosion products produced were detached from the localized corrosion areas. The average grain size of the MgZnCa alloy was larger than 150 μm. The secondary phases are located within the grain boundary as well as inside the α-Mg matrix (Fig. 8a) [46]. The micro-galvanic corrosion promoted the evolution of localized corrosion [47,48]. To further understand the effect of FISS on localized corrosion, we statistically analyzed the localized corrosion coverage ratio (LCCR) and corrosion product removal coverage ratio (CPRCR) of samples at 50 μm depth intervals by 2-D cross section slices of CT data using Image-Pro® Plus, as shown in Fig. 8a. As FISS increased, the LCCR and CPRCR both increased (Fig. 8b). As a result, the higher the FISS, the closer the LCCR and CPRCR values converge toward each other. This is attributed to the higher fluid shear stress and a higher mass transfer coefficient. The mass transfer coefficient determines the movement of corrosive species to a metal surface and corrosion products away from the metal surface [10]. Thus, its kinetics increases the adsorption–desorption cycle of the electrode which increases the corrosion product removal rate from the surface [49]. Likewise, a high-speed hydrodynamic system provides a high driving force for mechanical removal of corrosion products [49,50].
Fig. 7.

EDX mapping analysis of the cross sectional areas of the localized corrosion regions at 0, 0.15 and 0.62 Pa for 24 h.
Fig. 8.
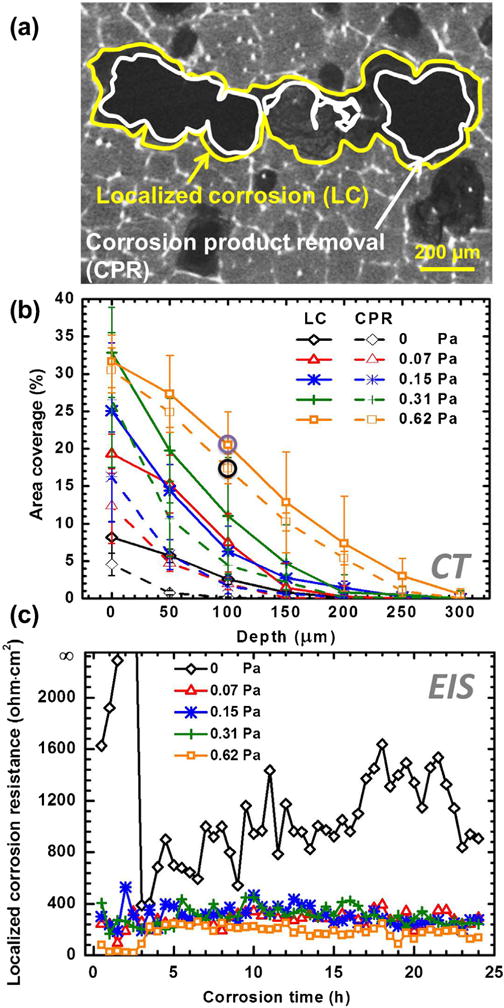
(a) Typical 2-D CT slice of the localized corrosion coverage region (yellow) and corrosion product removal coverage region (white) of sample at the depth of 100 μm at 0.62 Pa for 24 h. (b) LCCR and CPRCR of all the samples at 50 μm depth intervals for 24 h. The data marked with purple and black circles represent by LC and CPR regions (a). (c) The resistances of localized corrosion as the functions of time and FISS. RL at 0 Pa for 2 and 2.5 h are close to 20000 Ω cm2. (For interpretation of the references to color in this figure legend, the reader is referred to the web version of this article).
The application of the circuit model presented in this work accounts for the inductance in Fig. 5. The faradaic reaction became much stronger in the presence of FISS as a consequence of severer localized corrosion damage with FISS (Figs. 7 and 8 b). The values of RL at the dynamic conditions were remarkably lower than that under the static condition (Fig. 8c). The values of RL at 0.62 Pa condition were the lowest among all the test conditions. More specifically, these values of RL were lower than 250 Ω cm2 during the entire test period, which indicates most of corrosion products detached from the localized corrosion areas. When Mg exposed on the flow conditions, there was a larger contribution of the inductive response as compared to the static condition. This suggests that an adsorbed intermediate does play a role in Mg corrosion.
In the case of the plots in the FISS values of 0 and 0.07 Pa conditions at the initial stage (the first 3 h for the static condition and the first half-hour for the 0.05 Pa condition), there was an invisible inductive loop and positive phase angles at the low frequency. The behavior is typically attributed that a low inductive loop from a small amount of localized corrosion was covered by a high capacitive loop from the charge transfer resistance of the initial passivation layer from the sample preparation process. However, the high FISS can fast attack the initial passivation layer to make an obvious inductive loop. With prolonging time, the values of RL at 0 Pa condition increased albeit fluctuated to some extent as the corrosion products inside the localized corrosion areas were unstable in between each 30 min test period. However, the values of RL at the dynamic conditions became stable and low due to the increased number of localized corrosion and the detachment of corrosion products. For instance, the values of RL slightly increased then declined a little bit with time at 0.15 Pa condition as shown in Table 3. It reveals that the formation of the localized corrosion areas was associated with the evolution of corrosion products at the early stage, after that the corrosion products inside the localized corrosion areas peeled off with the flow at the later stage. After the corrosion products were removed, new α-Mg phase and second phase were exposed on the electrolyte again, which can promote the galvanic corrosion, compared with the static condition. Moreover, there was a higher chance for micro-galvanic cells formation between newly exposed Mg areas (anode) and surrounding corrosion product areas (cathode) [27]. Thus, corrosion was likely to propagate preferentially in these local areas. All the above suggest that fluid flow has a significant effect on localized corrosion and corrosion products removal.
3.6. Flow-induced comprehensive corrosion
The OCP curves as the functions of the FISS and time are shown in Fig. 9. The stable potentials are achieved after 6 h for all the samples. After steady state, the OCP of the specimen at the static condition is −1501 ± 10 mV vs. Ag/AgCl with a little fluctuation. Meanwhile, a similar evolution in OCP is observed at the flow conditions, with a very stable potential −1513 ± 1 mV vs. Ag/AgCl. The comprehensive corrosion (Fig. 10) including both uniform (Fig. 6) and localized (Figs. 7 and 8) corrosion aggravated at the higher FISS conditions. The comprehensive corrosion performances with the FISSs were more delicately calculated as illustrated in Fig. 11, compared with the general corrosion rate in the prior works. The average corrosion rate (Fig. 11a, blue line) is converted from the volume loss without the corrosion products as above-mentioned Eq. (2). The uniform corrosion rate (Fig. 11a, red line) is calculated according the thickness of the uniform corrosion layer divided by exposure time. The localized corrosion rate is the difference value between the average corrosion rate and the uniform corrosion rate. The results show the localized corrosion dominated more and more of the entire corrosion with the increase of FISS. To deeply study the localized corrosion, the localized corrosion area coverage ratio (Fig. 11b, blue line) and the removal ratio of corrosion product (Fig. 11b, red line) on the sample faces are provided as the important and accurate parameters as the functions of FISS as well.
Fig. 9.
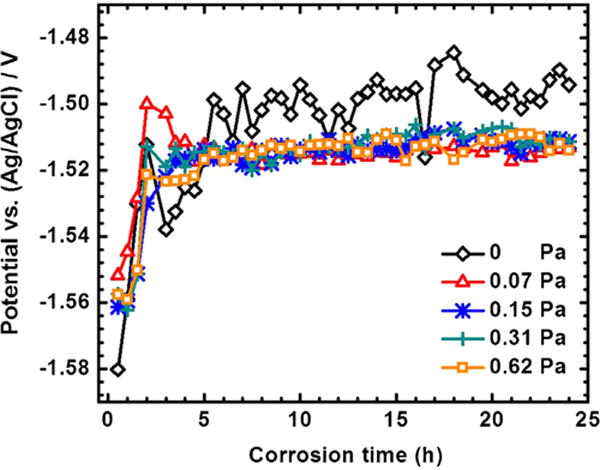
OCP as the functions of time and FISS.
Fig. 10.

(a–c) Typical 3-D reconstructions using X-ray micro-CT of samples at 0, 0.15 and 0.62 Pa for 24 h.
Fig. 11.
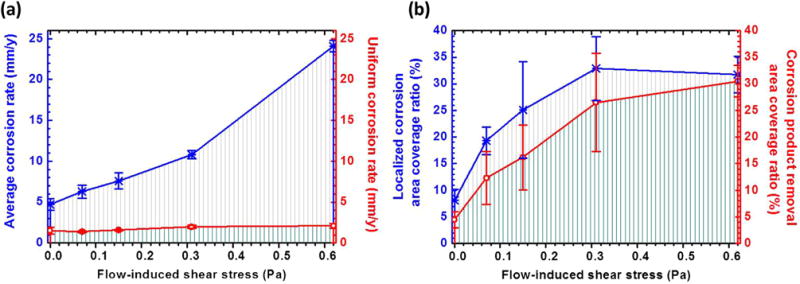
The average corrosion rate (a, blue line), the uniform corrosion rate (a, red line), the localized corrosion area coverage ratio (b, blue line) and the removal ratio of corrosion product (b, red line) on the sample surfaces as the functions of FISS. (For interpretation of the references to color in this figure legend, the reader is referred to the web version of this article).
Polarization resistance (Rpolar) can profile the corrosion rate with time. According to King et al. [3] and Gao et al. [51] the Rpolar can be defined as the difference in impedance between low frequency asymptote (|Z|f→0) and the solution resistance (|Z|f→ ∞). As the frequency is sufficiently low (f → 0), capacitive components of a system approach infinite impedance (ZC = ∞) and inductive components approach zero impedance (ZL = 0). As shown schematically in Fig. 12a insert EEC, this enables circuit to be simplified and Rpolar to be estimated by:
| (6) |
Fig. 12.
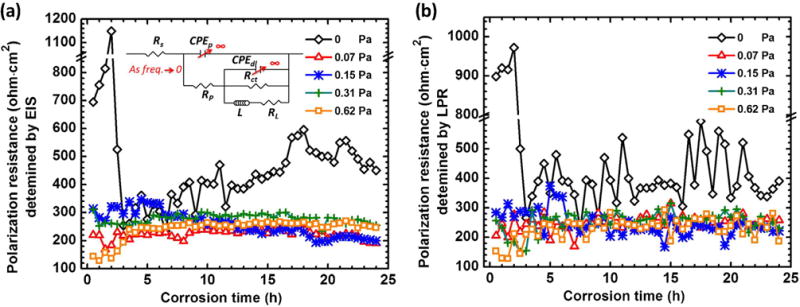
Polarization resistance relationships determined by EIS and LPM are shown in (a) and (b). Low frequency asymptote (when f → 0) simplifications and resulting polarization resistance relationships for equivalent circuit as an insert into (a).
To verify the reliability of the Rpolar, it can be determined by the linear polarization measurement as well. The slope of E–I plot gives Rpolar. The Rpolar values calculated by EIS (Fig. 12a) and LPR (Fig. 12b) respectively exhibited a good consistency. In other words, equivalent circuit models match the EIS spectra very well. At the static condition, the Rpolar of the sample sharply decreased and then slowed increased with some fluctuations over time. The initial passivation layer from the preparation process on the sample surface and the low charge transfer kinetics (Fig. 13) both contributed to the high Rpolar in the beginning. Then, the Rpolar sharply decreased and the corrosion rate increased along with the appearance of localized corrosion at around 3 h due to the accumulation of chloride ion on the surface [52]. The growth in Rpolar and the decrease in corrosion rate with time (after 3 h) are rationalized on the basis of alkalization of the near surface electrolyte owing to the diffusion limitation of the static environment [3]. Another reason might be the thickening of both the Mg(OH)2 layer and the deposited Ca–P layer which slowed down the charge transfer as well. At the dynamic conditions, the Rpolar values only changed a little over time (Fig. 12). In particular, corrosion at the initial stage is fairly faster than that at the later stage at the FISSs of 0.31 and 0.62 Pa. The initial passivation layers were quickly broken down at the flow conditions within tens of minutes. All of Rct under dynamic conditions presented very low values in the beginning, and continued decreasing with the breakdown of the initial passivation layer at the first hour (Fig. 13). As the corrosion evolved, Rct leveled off. The relatively stable corrosion rate kept at each flow condition. In this method, EIS and LPM as two different means can provide a straightforward Rpolar. The corrosion rate and corrosion current density of freely corroding metal in the absence of coverage effects is inversely proportional to polarization resistance (Rpolar) as described by the Stern–Geary relationship [53,54]. However, there is a limitation for the accurate corrosion rate determination. According to Stern–Geary Eq. (8) [53]:
| (8) |
where icorr is corrosion current density, βa and βc are the anodic and cathodic Tafel slopes [16,55]. Tafel curve acquired from potentiodynamic polarization test cannot provide a long-term and continuous data due to instantaneous destruction for the nature. Therefore, the real-time icorr and corrosion rate cannot be determined in the current electrochemical method. Future work should seek a straightforward or combined approach for the in-situ and real-time corrosion rate determination using electrochemical method.
Fig. 13.
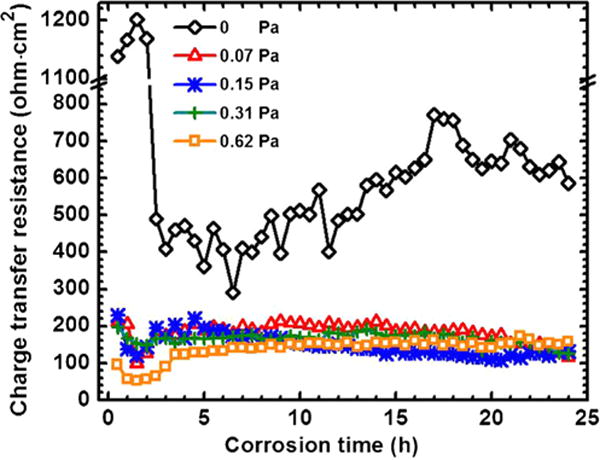
Charge transfer resistance as a function of time and FISS.
3.7. Flow-induced corrosion mechanism
Fluid flow accelerates mass transfer coefficient, ion diffusion and charge transfer to the interface between Mg and the corrosive medium [43,56,57]. This is the fundamental reason why corrosion rate increases with the increase of flow-induced shear stress. Furthermore, the dissolution of Mg is very pH dependent [2,58]. In the no flow condition, a local high pH microenvironment formed around the sample surface due to ion diffusion limitation at the static condition. As a result, the dissolution of Mg was inhibited, indicating a decrease in corrosion rate. Additionally, the Ca–P complex, as a passivation layer, can be deposited on the surface in a high pH microenvironment [42]. However, in the flow condition, the increase in pH was not dominant on the basis of electrolyte renewal. The flow can keep pH at around natural physiological values, resulting in the evolution of further corrosion. During the stable phase, i.e. the charge transfer reaching a dynamic equilibrium, the corrosion rates and Rpolar at all the dynamic conditions were approximately similar. An important comment related to data interpretation in the case of uniform and localized corrosion occurring simultaneously and in parallel is that the impedance modulus of the two processes [59]. It is a balanced consequence between the thickening corrosion product layer on the uniform corrosion regions and the removal of corrosion products on the localized corrosion regions, which in turn decelerates and accelerates corrosion, respectively [27]. In the processes presented in this paper, the impedance value is the sum of the contribution of the uniform corrosion resistance improvement of the corrosion product layer and the localized corrosion attacks that decrease the impedance values [60]. Therefore, fluid flow plays a significant role on the corrosion rate of Mg, especially for the initial stage. These reasonable results suggest that the established in-situ and real-time electrochemical monitoring method is valuable for studying active and sensitive corrosion behavior of Mg under flow condition.
One of the primary requirements of this study was to accurately detect the evolution of corrosion products. It is very important to note that a large size of corrosion products may peel off and then flow with the blood fluid, which could be catastrophic for the patient. We observed this issue always occurred on localized corrosion regions, especially for the galvanic corrosion areas. As FISS increased, the possibility of the removal of corrosion product got higher, due to the increased mass transfer effect and mechanical force [15]. Peel-off corrosion products occlude the capillary, which may lead to infarct. In addition, once the corrosion products removed from the localized corrosion areas, these regions were easier to become a source of stent fracture, which may lead to the lose of the mechanical support strength of the stent prematurely. If the localized corrosion and corrosion products are not accurately assessed, these deleterious effects can not be avoided. This is the reason why we statistically analyzed the localized corrosion ratio and the corrosion products removal ratio in this work.
4. Conclusions
The work herein presented a model for the in-situ and real-time electrochemical monitoring of Mg alloy corrosion in a simulated vascular flow environment. This simple approach provided an accurate, instantaneous and capable long-term determination ’of Mg corrosion for the application of vascular stents.
- To better understand the effect of hydrodynamics on corrosion kinetics, corrosion types, corrosion rate and corrosion products, the multiple-supporting methods and profiles provided the quantitative and straightforward data of the comprehensive corrosion behavior, based on the electrochemical assessment and interface morphology characterization:
- The FISS was found to accelerate electron transfer, leading to an increase in the comprehensive (uniform and localized) corrosion, especially for the initial stage.
- FISS thickened the uniform corrosion product layer, but reduced the resistance of this layer at 0.31 and 0.62 Pa, due to an increase in filiform corrosion on the surface.
- FISS increased the localized corrosion area and removed some loose corrosion products (almost all corrosion products peeled off at 0.62 Pa) owing to an increased mass transfer effect and mechanical force.
- With the increase of FISS, the localized corrosion dominated more and more of the entire corrosion, compared with the uniform corrosion.
EIS-estimated and LPM-measured polarization resistances showed a great consistency. Both had a good correlation with ’average corrosion rate calculated by micro-CT. Rpolar displayed a FISS dependence and also was associated with the acceleration of anodic dissolution.
Understanding the flow induced corrosion behavior of Mg alloys can provide knowledge for expanding the clinical applications of Mg-based stents in multifarious implanting positions. Furthermore, this in-situ and real-time electrochemical technique can be a useful tool to study active metals.
Supplementary Material
Acknowledgments
The authors would like to thank Dr. Boyce Collins for the valuable discussions and technical supporting for CT, as well as thank Dr. Leon White, Dr. Christopher Smith and Mr. Meiyun Chen for editing work. This study was supported by the Engineering Research Center for Revolutionizing Metallic Biomaterials (NSF-0812348) from the National Science Foundation, USA; NIH NIGMS SCORE Grant (1SC3GM113728-01); China Scholarship Council 201207000016; 2013 Cultivation Program for the Excellent Doctoral Dissertation of Southwest Jiaotong University; National Natural Science Foundation of China under Grant No. 81330031, No. 21473138 and No. 81401522; Sichuan Youth Science & Technology Foundation (No. 2012JQ0001) for Distinguished Young Scholars; and X-ray CT imaging was made possible through an USA-NSF Award No. 0959511
Appendix A. Supplementary data
Supplementary data associated with this article can be found, in the online version, at http://dx.doi.org/10.1016/j.corsci.2015.12.020.
Footnotes
- Juan Wang conducted all the tests, and prepared the manuscript.
- Yongseok Jang contributed to setup the in-situ and real-time electrochemical system in the vascular bioreactor.
- Guojiang Wan discussed actively on electrochemical results.
- Venkataraman Giridharan simulated flow-induced shear stress using COMSOL.
- Guang-Ling Song discussed corrosion mechanism and polished the entire manuscript.
- Zhigang Xu provided the Mg alloys.
- Youngmi Koo helped to design the vascular bioreactor.
- Pengkai Qi polished the figures.
- Jagannathan Sankar, who is the director of our research center, provided the funding for all the tests.
- Nan Huang is a corresponding author in this manuscript, and he is the first author’s advisor. In this works, he advised the design of the tests and the discussion.
- Yeoheung Yun is another corresponding author in this manuscript, and he is the first author’s co-advisor. In this works, he managed all the tests and co-authors as well as advised the structure and details of the manuscript.
References
- 1.Zheng YF, Gu XN, Witte F. Biodegradable metals. Mater Sci Eng R. 2014;77:1–34. [Google Scholar]
- 2.Hiromoto S, Yamamoto A, Maruyama N, Somekawa H, Mukai T. Influence of pH and flow on the polarisation behaviour of pure magnesium in borate buffer solutions. Corros Sci. 2008;50:3561–3568. [Google Scholar]
- 3.King AD, Birbilis N, Scully JR. Accurate electrochemical measurement of magnesium corrosion rates: a combined impedance, mass-loss and hydrogen collection study. Electrochim Acta. 2014;121:394–406. [Google Scholar]
- 4.Wang J, Smith CE, Sankar J, Yun Y, Huang N. Absorbable magnesium-based stent: physiological factors to consider for in vitro degradation assessments. Regener Biomater. 2015:1–11. doi: 10.1093/rb/rbu015. [DOI] [PMC free article] [PubMed] [Google Scholar]
- 5.Lim GB. Interventional cardiology: DREAMS of a bioabsorbable stent coming true. Nat Rev Cardiol. 2013;10:120. doi: 10.1038/nrcardio.2013.10. [DOI] [PubMed] [Google Scholar]
- 6.Haude M, Erbel R, Erne P, Verheye S, Degen H, Böse D, Vermeersch P, Wijnbergen I, Weissman N, Prati F, Waksman R, Koolen J. Safety and performance of the drug-eluting absorbable metal scaffold (DREAMS) in patients with de-novo coronary lesions: 12 month results of the prospective, multicentre, first-in-man BIOSOLVE-I trial. Lancet. 2013;381:836–844. doi: 10.1016/S0140-6736(12)61765-6. [DOI] [PubMed] [Google Scholar]
- 7.Yun Y, Dong Z, Lee N, Liu Y, Xue D, Guo X, Kuhlmann J, Doepke A, Halsall HB, Heineman W. Revolutionizing biodegradable metals. Mater Today. 2009;12:22–32. [Google Scholar]
- 8.Waksman R, Pakala R, Kuchulakanti PK, Baffour R, Hellinga D, Seabron R, Tio FO, Wittchow E, Hartwig S, Harder C. Safety and efficacy of bioabsorbable magnesium alloy stents in porcine coronary arteries, Catheter. Cardiovasc Interv. 2006;68:607–617. doi: 10.1002/ccd.20727. [DOI] [PubMed] [Google Scholar]
- 9.Levesque J, Hermawan H, Dube D, Mantovani D. Design of a pseudo-physiological test bench specific to the development of biodegradable metallic biomaterials. Acta Biomater. 2008;4:284–295. doi: 10.1016/j.actbio.2007.09.012. [DOI] [PubMed] [Google Scholar]
- 10.Efird K. Flow effects on corrosion, Uhlig’s Corrosion Handbook, Effects on Corrosion. Uhlig’s Corrosion Handbook. 2011;51:203–213. http://onlinelibrary.wiley.com/book/10.1002/9780470872864. [Google Scholar]
- 11.Witte F, Bobe K, Meier M. MRI based perfusion measurements in bone after implantation of biodegradable magnesium rods. Eur Cells Mater. 2013;26:53. [Google Scholar]
- 12.Li N, Guo C, Wu YH, Zheng YF, Ruan LQ. Comparative study on corrosion behaviour of pure Mg and WE43 alloy in static, stirring and flowing Hank’s solution. Corros Eng Sci Technol. 2012;47:346–351. [Google Scholar]
- 13.Chen Y, Zhang S, Li J, Song Y, Zhao C, Zhang X. Dynamic degradation behavior of MgZn alloy in circulating m-SBF. Mater Lett. 2010;64:1996–1999. [Google Scholar]
- 14.Jafarzadeh K, Shahrabi T, Oskouei AA. Novel approach using EIS to study flow accelerated pitting corrosion of AA5083-H321 aluminum–magnesium alloy in NaCl solution. J Appl Electrochem. 2009;39:1725–1731. [Google Scholar]
- 15.Paolinelli LD, Carr GE. Mechanical integrity of corrosion product films on rotating cylinder specimens. Corros Sci. 2015;92:155–161. [Google Scholar]
- 16.Song G, Atrens A, John DS, Wu X, Nairn J. The anodic dissolution of magnesium in chloride and sulphate solutions. Corros Sci. 1997;39:1981–2004. [Google Scholar]
- 17.Światowska J, Volovitch P, Ogle K. The anodic dissolution of Mg in NaCl and Na2SO4 electrolytes by atomic emission spectroelectrochemistry. Corros Sci. 2010;52:2372–2378. [Google Scholar]
- 18.Liang J, Srinivasan PB, Blawert C, Dietzel W. Influence of chloride ion concentration on the electrochemical corrosion behaviour of plasma electrolytic oxidation coated AM50 magnesium alloy. Electrochim Acta. 2010;55:6802–6811. [Google Scholar]
- 19.Song G, Atrens A. Recent insights into the mechanism of magnesium corrosion and research suggestions. Adv Eng Mater. 2007;9:177–183. [Google Scholar]
- 20.Ascencio M, Pekguleryuz M, Omanovic S. An investigation of the corrosion mechanisms of WE43 Mg alloy in a modified simulated body fluid solution: the effect of electrolyte renewal. Corros Sci. 2015;91:297–310. [Google Scholar]
- 21.Ascencio M, Pekguleryuz M, Omanovic S. An investigation of the corrosion mechanisms of WE43 Mg alloy in a modified simulated body fluid solution: the influence of immersion time. Corros Sci. 2014;87:489–503. [Google Scholar]
- 22.Kirkland NT, Birbilis N, Staiger MP. Assessing the corrosion of biodegradable magnesium implants: a critical review of current methodologies and their limitations. Acta Biomater. 2012;8:925–936. doi: 10.1016/j.actbio.2011.11.014. [DOI] [PubMed] [Google Scholar]
- 23.Doepke A, Kuhlmann J, Guo X, Voorhees RT, Heineman WR. A system for characterizing Mg corrosion in aqueous solutions using electrochemical sensors and impedance spectroscopy. Acta Biomater. 2013;9:9211–9219. doi: 10.1016/j.actbio.2013.07.011. [DOI] [PubMed] [Google Scholar]
- 24.Curioni M. The behaviour of magnesium during free corrosion and potentiodynamic polarization investigated by real-time hydrogen measurement and optical imaging. Electrochim Acta. 2014;120:284–292. [Google Scholar]
- 25.Lebouil S, Duboin A, Monti F, Tabeling P, Volovitch P, Ogle K. A novel approach to on-line measurement of gas evolution kinetics: application to the negative difference effect of Mg in chloride solution. Electrochim Acta. 2014;124:176–182. [Google Scholar]
- 26.Rossrucker L, Mayrhofer KJJ, Frankel GS, Birbilis N. Investigating the real time dissolution of Mg using online analysis by ICP-MS. J Electrochem Soc. 2014;161:C115–C119. [Google Scholar]
- 27.Wang J, Giridharan V, Shanov V, Xu Z, Collins B, White L, Jang Y, Sankar J, Huang N, Yun Y. Flow-induced corrosion behavior of absorbable magnesium-based stents. Acta Biomater. 2014;10:5213–5223. doi: 10.1016/j.actbio.2014.08.034. [DOI] [PubMed] [Google Scholar]
- 28.Mueller WD, Lucia Nascimento M, Lorenzo de Mele MF. Critical discussion of the results from different corrosion studies of Mg and Mg alloys for biomaterial applications. Acta Biomater. 2010;6:1749–1755. doi: 10.1016/j.actbio.2009.12.048. [DOI] [PubMed] [Google Scholar]
- 29.Smith CE, Xu Z, Waterman J, Sankar J. Cytocompatibility assessment of MgZnCa alloys. Emerg Mater Res. 2013;2:283–290. [Google Scholar]
- 30.Ferziger JH, Perić M. Computational Methods for Fluid Dynamics. Springer; Berlin: 1996. [Google Scholar]
- 31.Bacabac RG, Smit TH, Cowin SC, Van Loon JJWA, Nieuwstadt F, Heethaar R, Klein-Nulend J. Dynamic shear stress in parallel-plate flow chambers. J Biomech. 2005;38:159–167. doi: 10.1016/j.jbiomech.2004.03.020. [DOI] [PubMed] [Google Scholar]
- 32.Witte F, Fischer J, Nellesen J, Crostack HA, Kaese V, Pisch A, Beckmann F, Windhagen H. In vitro and in vivo corrosion measurements of magnesium alloys. Biomaterials. 2006;27:1013–1018. doi: 10.1016/j.biomaterials.2005.07.037. [DOI] [PubMed] [Google Scholar]
- 33.Zhang GA, Zeng Y, Guo XP, Jiang F, Shi DY, Chen ZY. Electrochemical corrosion behavior of carbon steel under dynamic high pressure H2S/CO2 environment. Corros Sci. 2012;65:37–47. [Google Scholar]
- 34.Cui X-j, Lin X-z, Liu C-h, Yang R-h, Zheng X-w, Gong M. Fabrication and corrosion resistance of a hydrophobic micro-arc oxidation coating on AZ31 Mg alloy. Corros Sci. 2015;90:402–412. [Google Scholar]
- 35.Jorcin J-B, Orazem ME, Pébère N, Tribollet B. CPE analysis by local electrochemical impedance spectroscopy. Electrochim Acta. 2006;51:1473–1479. [Google Scholar]
- 36.Baril Gv, Blanc C, Peíberè N. AC impedance spectroscopy in characterizing time-dependent corrosion of AZ91 and AM50 magnesium alloys characterization with respect to their microstructures. J Electrochem Soc. 2001;148:B489. [Google Scholar]
- 37.Song G, Atrens A, Wu X, Zhang B. Corrosion behaviour of AZ21, AZ501 and AZ91 in sodium chloride. Corros Sci. 1998;40:1769–1791. [Google Scholar]
- 38.Jang Y, Owuor D, Waterman JT, White L, Collins B, Sankar J, Gilbert TW, Yun Y. Effect of mucin and bicarbonate ion on corrosion behavior of AZ31 magnesium alloy for airway stents. Materials. 2014;7:5866–5882. doi: 10.3390/ma7085866. [DOI] [PMC free article] [PubMed] [Google Scholar]
- 39.Song G, Bowles AL, StJohn DH. Corrosion resistance of aged die cast magnesium alloy AZ91D. Mater Sci Eng: A. 2004;366:74–86. [Google Scholar]
- 40.Shkirskiy V, King AD, Gharbi O, Volovitch P, Scully JR, Ogle K, Birbilis N. Revisiting the electrochemical impedance spectroscopy of magnesium with online inductively coupled plasma atomic emission spectroscopy. ChemPhysChem. 2015;16:536–539. doi: 10.1002/cphc.201402666. [DOI] [PubMed] [Google Scholar]
- 41.Willumeit R, Fischer J, Feyerabend F, Hort N, Bismayer U, Heidrich S, Mihailova B. Chemical surface alteration of biodegradable magnesium exposed to corrosion media. Acta Biomater. 2011;7:2704–2715. doi: 10.1016/j.actbio.2011.03.004. [DOI] [PubMed] [Google Scholar]
- 42.Dorozhkin SV, Epple M. Biological and medical significance of calcium phosphates. Angew Chem Int Ed. 2002;41:3130–3146. doi: 10.1002/1521-3773(20020902)41:17<3130::AID-ANIE3130>3.0.CO;2-1. [DOI] [PubMed] [Google Scholar]
- 43.Ghali E, Dietzel W, Kainer KU. General and localized corrosion of magnesium alloys: a critical review. J Mater Eng Perform. 2004;13:7–23. [Google Scholar]
- 44.Ruggeri RT, Beck TR. An analysis of mass transfer in filiform corrosion. Corrosion. 1983;39:452–465. [Google Scholar]
- 45.Li Z, Song GL, Song S. Effect of bicarbonate on biodegradation behaviour of pure magnesium in a simulated body fluid. Electrochim Acta. 2014;115:56–65. [Google Scholar]
- 46.Lu F, Ma A, Jiang J, Guo Y, Yang D, Song D, Chen J. Significantly improved corrosion resistance of heat-treated Mg–Al–Gd alloy containing profuse needle-like precipitates within grains. Corros Sci. 2015;94:171–178. [Google Scholar]
- 47.Zhao MC, Liu M, Song GL, Atrens A. Influence of microstructure on corrosion of as-cast ZE41. Adv Eng Mater. 2008;10:104–111. [Google Scholar]
- 48.Wang SD, Xu DK, Chen XB, Han EH, Dong C. Effect of heat treatment on the corrosion resistance and mechanical properties of an as-forged Mg–Zn–Y–Zr alloy. Corros Sci. 2015;92:228–236. [Google Scholar]
- 49.Jiang X, Zheng YG, Ke W. Effect of flow velocity and entrained sand on inhibition performances of two inhibitors for CO2 corrosion of N80 steel in 3% NaCl solution. Corros Sci. 2005;47:2636–2658. [Google Scholar]
- 50.Shalaby H, Attari S, Riad W, Gouda V. Erosion–corrosion behavior of some cast alloys in seawater. Corrosion. 1992;48:206–217. [Google Scholar]
- 51.Gao Y, Yerokhin A, Parfenov E, Matthews A. Application of voltage pulse transient analysis during plasma electrolytic oxidation for assessment of characteristics and corrosion behaviour of Ca- and P-containing coatings on magnesium. Electrochim Acta. 2014;149:218–230. [Google Scholar]
- 52.Frankel G, Sridhar N. Understanding localized corrosion. Mater Today. 2008;11:38–44. [Google Scholar]
- 53.Astm G. Standard test method for conducting potentiodynamic polarization resistance measurements. 2009. [Google Scholar]
- 54.Shi Z, Cao F, Song GL, Atrens A. Low apparent valence of Mg during corrosion. Corros Sci. 2014;88:434–443. [Google Scholar]
- 55.Makar GL, Kruger J. Corrosion of magnesium. Int Mater Rev. 1993;38:138–153. [Google Scholar]
- 56.Zhou Q, Wang Y, Bierwagen GP. Influence of the composition of working fluids on flow-accelerated organic coating degradation: deionized water versus electrolyte solution. Corros Sci. 2012;55:97–106. [Google Scholar]
- 57.Jiang X, Zheng YG, Ke W. Effect of flow velocity and entrained sand on inhibition performances of two inhibitors for CO2 corrosion of N80 steel in 3% NaCl solution. Corros Sci. 2005;47:2636–2658. [Google Scholar]
- 58.Zhao MC, Liu M, Song GL, Atrens A. Influence of pH and chloride ion concentration on the corrosion of Mg alloy ZE41. Corros Sci. 2008;50:3168–3178. [Google Scholar]
- 59.Quach NC, Uggowitzer PJ, Schmutz P. Corrosion behaviour of an Mg–Y–RE alloy used in biomedical applications studied by electrochemical techniques. C R Chim. 2008;11:1043–1054. [Google Scholar]
- 60.Su C, Wu W, Li Z, Guo Y. Prediction of film performance by electrochemical impedance spectroscopy. Corros Sci. 2015;99:42–52. [Google Scholar]
Associated Data
This section collects any data citations, data availability statements, or supplementary materials included in this article.


