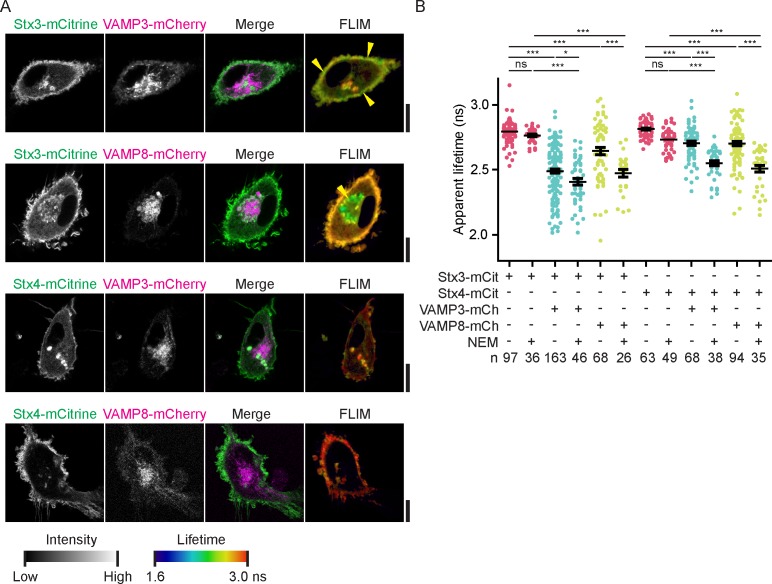
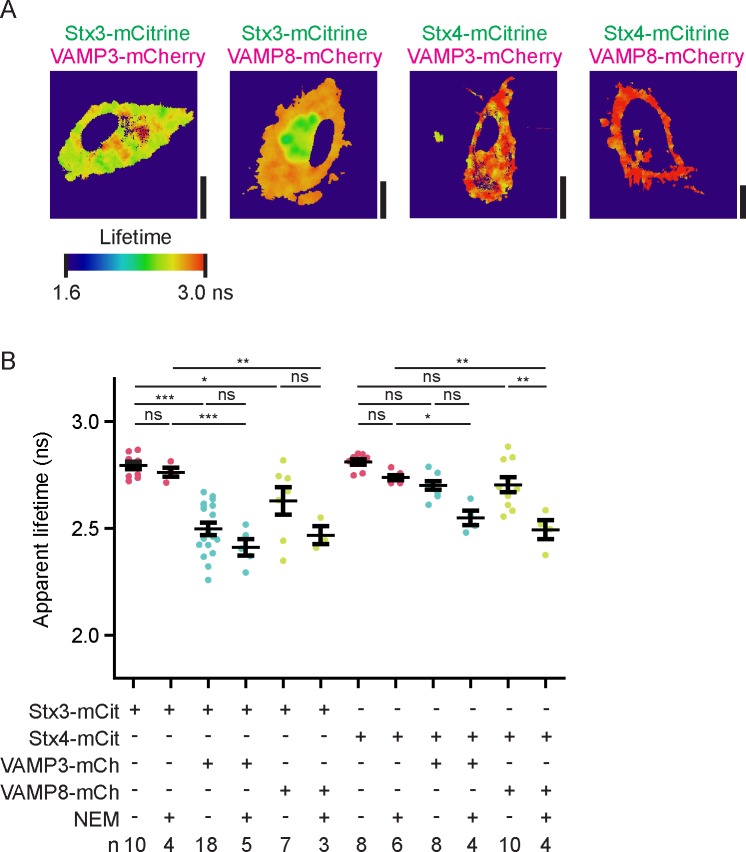
Figure 4. FRET-FLIM of Stx3 and Stx4 with VAMP3 and VAMP8.
(A) Representative confocal microscopy (left) and convoluted FLIM (right) images of dendritic cells expressing Stx3-mCitrine or Stx4-mCitrine (green in merge) with VAMP3-mCherry or VAMP8-mCherry (magenta). The apparent fluorescence lifetimes of Stx3-mCitrine with VAMP3-mCherry were lowest at the cell membrane, whereas the lifetimes with VAMP8-mCherry were lowest at intracellular compartments (yellow arrowheads). Scale bars, 10 µm. Lifetime images are in Figure 4—figure supplement 1A. (B) Whole-cell apparent fluorescence lifetimes for the conditions from panel A, both in presence or absence of NEM. Shown are individual cells pooled from at least 3 donors (mean ± SEM shown; one-way ANOVA with Bonferroni correction; n: number of cells; individual donors in Figure 4—figure supplement 1B).


