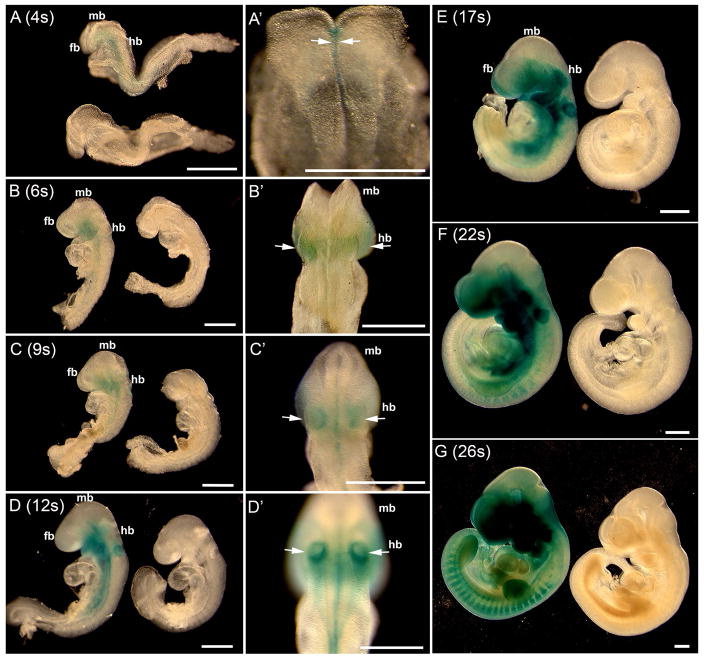
Fig. 2.
Whole mount X-Gal visualization of the lacZ gene product β-galactosidase in P0-Cre/R26-lacZ mouse embryos at different somite (s) stages (E8–E9, 4s–26s). The somite number is indicated in each panel. At the 4-somite stage, β-gal positive signals (blue) emerged (A top, A′, arrows) in the midline ventral to the neural tube. At later stages, signals (arrows) extended to the forebrain (fb), hindbrain (hb), and trunk regions of NC and NC derivatives. Signals were not obvious in the midbrain (mb) region. Cre negative control littermates (A, bottom; B–G, right) were devoid of β-gal signal. Scale bars: 500 μm.

