Fig. 9.
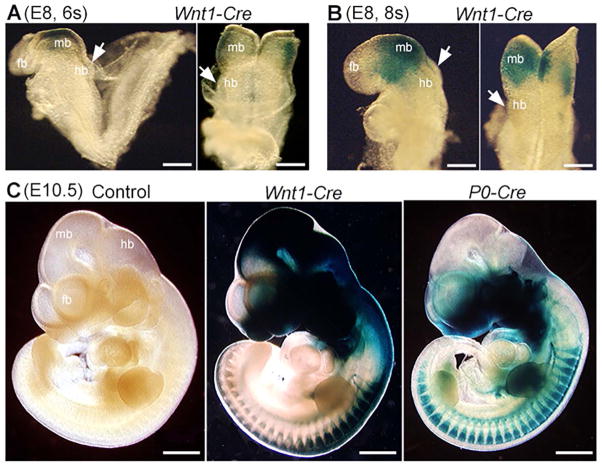
Whole mount X-Gal visualization of lacZ gene product β-galactosidase in Wnt1-Cre/R26-lacZ mouse embryos at different stages (E8–E10.5). β-gal positive signals (blue) were extensive in the midbrain (mb) at the 6s (A) and 8s (B) stages, but were sparse in the hindbrain. At later stages, signals extended to the forebrain (fb), midbrain (mb), hindbrain (hb) and trunk regions of NC and NC derivatives in Wnt1-Cre/R26-lacZ tissue at E10.5 (C). In E9 P0-Cre/R26-lacZ mouse embryos (C), β-gal positive signals (blue) were found in the forebrain (fb), hindbrain (hb) and trunk regions of NC and NC derivatives, but were not apparent in the midbrain (mb). Scar bars: 200 μm in A and B; 1 mm in C.

