

Abstract
Background
Colorectal carcinoma evolves through a multitude of molecular events including somatic mutations, epigenetic alterations, and aberrant protein expression, influenced by host immune reactions. One way to interrogate the complex carcinogenic process and interactions between aberrant events is to model a biomarker correlation network. Such a network analysis integrates multidimensional tumor biomarker data to identify key molecular events and pathways that are central to an underlying biological process. Due to embryological, physiological, and microbial differences, proximal and distal colorectal cancers have distinct sets of molecular pathological signatures. Given these differences, we hypothesized that a biomarker correlation network might vary by tumor location.
Results
We performed network analyses of 54 biomarkers, including major mutational events, microsatellite instability (MSI), epigenetic features, protein expression status, and immune reactions using data from 1380 colorectal cancer cases: 690 cases with proximal colon cancer and 690 cases with distal colorectal cancer matched by age and sex. Edges were defined by statistically significant correlations between biomarkers using Spearman correlation analyses. We found that the proximal colon cancer network formed a denser network (total number of edges, n = 173) than the distal colorectal cancer network (n = 95) (P < 0.0001 in permutation tests). The value of the average clustering coefficient was 0.50 in the proximal colon cancer network and 0.30 in the distal colorectal cancer network, indicating the greater clustering tendency of the proximal colon cancer network. In particular, MSI was a key hub, highly connected with other biomarkers in proximal colon cancer, but not in distal colorectal cancer. Among patients with non-MSI-high cancer, BRAF mutation status emerged as a distinct marker with higher connectivity in the network of proximal colon cancer, but not in distal colorectal cancer.
Conclusion
In proximal colon cancer, tumor biomarkers tended to be correlated with each other, and MSI and BRAF mutation functioned as key molecular characteristics during the carcinogenesis. Our findings highlight the importance of considering multiple correlated pathways for therapeutic targets especially in proximal colon cancer.
Electronic supplementary material
The online version of this article (doi:10.1186/s12859-017-1718-5) contains supplementary material, which is available to authorized users.
Background
Colorectal cancer evolves through a progressive accumulation of genetic and epigenetic alterations that are influenced by the environment and host immunity. The interplay of molecular alterations forms biological interaction networks in colorectal cancer [1]. For example, epigenetic changes are known to be associated with genetic changes, as exemplified by the well-established link between MLH1 promoter hypermethylation and microsatellite instability (MSI) [2, 3]. Additionally, microRNAs including MIR21 and MIR155 are reported to regulate gene expression [4–6], resulting in abnormal loss and overexpression of proteins [7]. In the tumor microenvironment, tumor-host interactions manifest as lymphocytic reactions directed at the tumor [8]. Given this multitude of molecular interactions, it is challenging to comprehensively understand the perturbations of the complex biological system and identify the key, underlying molecular events that drive colorectal carcinogenesis. Network analysis is recognized as an emerging approach to evaluating multidimensional tumor molecular data with the aim of revealing critical molecular events and pathways [9, 10].
Numerous lines of evidence indicate differences between proximal colon cancer, and distal colon and rectal cancer [11–13]. When compared with distal colon and rectal cancer, proximal colon cancer exhibits a higher prevalence of microsatellite instability (MSI) and high-level CpG island methylator phenotype (CIMP-high) [11]. The proximal colon and distal colorectum have different embryologic origins; the former is derived from the midgut with blood supply from superior mesenteric artery, while the latter is derived from the hindgut with inferior mesenteric artery. Moreover, epithelial cells in the proximal colon are exposed to different bowel contents, including microbiota, compared with the distal colon and rectum [13]. Based on these differences in molecular alterations and tumor-host interactions with the microenvironment, the underlying etiology may differ between proximal and distal colorectal cancer. Accordingly, the structure of the biomarker correlation network may differ by tumor location. A better understanding of the connectivity and correlation of molecular events in biomarker networks can provide new insights into colorectal cancer etiology and pathogenesis, potentially advancing prevention and treatment strategies. In cancer biological networks, highly connected molecular markers, called hubs, play essential roles in carcinogenesis [14, 15]. We hypothesized that correlation network structures and hub biomarkers might differ between proximal and distal colorectal cancer. Utilizing colorectal cancer databases of the Nurses’ Health Study (NHS) and the Health Professionals Follow-up Study (HPFS), we examined the status of key driver mutations, MSI, CIMP, expression of selected proteins in tumor cells, and immune reactions to colorectal cancer.
Results
Comparison of biomarker networks by tumor location
Within the NHS and the HPFS, we identified 1591 colorectal cancer patients with analyzed molecular features of colorectal tumors (Table 1). Biomarkers in this analysis included somatic oncogenic mutations, epigenetic features, protein expression levels, and host immune reactions in colorectal carcinoma. We conducted network analyses stratified by tumor location in a subset (n = 1380) of these patients. This subset included 690 patients with proximal colon cancer and 690 patients with distal colorectal cancer, matched by age and sex. Biomarker availability differed by tumor location only for the following three biomarkers: the intratumoral periglandular reaction (95.9% available in proximal colon, 91.6% in distal colorectum), peritumoral lymphocytic reaction (95.8% in proximal colon, 91.2% in distal colorectum), and tumor infiltrating lymphocytes (TIL) (95.9% in proximal colon, 91.6% in distal colorectum), with the significance level of P = 0.05 after the Bonferroni correction. The demographic characteristics of patients according to tumor location are described in Table 2. Patients with proximal colon cancer tended to have tumors with higher TNM stage and poor differentiation compared with patients with distal colorectal cancer.
Table 1.
Tumor molecular and pathological features in colorectal carcinomas
| Biomarker | Status measured | % or mean (SD) of the status in proximal colon (n = 690)a | % or mean (SD) of the status in distal colorectum (n = 690)a |
% availability in proximal colon (n = 690) | % availability in distal colorectum (n = 690) |
|---|---|---|---|---|---|
| Somatic oncogenic mutations | |||||
| BRAF | Mutation | 25.1% | 5.6% | 86.1% | 87.4% |
| KRAS | Mutation | 43.0% | 36.6% | 86.2% | 87.5% |
| PIK3CA | Mutation | 18.4% | 14.5% | 79.7% | 80.9% |
| Methylation status | |||||
| MLH1 | Methylation | 25.3% | 3.9% | 83.5% | 82.5% |
| CDKN2A | Methylation | 44.3% | 21.8% | 83.5% | 82.5% |
| CACNA1G | Methylation | 40.3% | 9.9% | 83.5% | 82.3% |
| CRABP1 | Methylation | 52.8% | 20.9% | 83.5% | 82.5% |
| IGF2 | Methylation | 44.3% | 12.1% | 83.5% | 82.5% |
| NEUROG1 | Methylation | 53.1% | 21.0% | 83.5% | 82.3% |
| RUNX3 | Methylation | 40.1% | 8.8% | 83.5% | 82.5% |
| SOCS1 | Methylation | 30.4% | 7.9% | 83.3% | 82.5% |
| LINE-1 | Degree of methylation (%) | 64.7 (SD, 9.7) | 62.6 (SD, 9.9) | 85.1% | 84.5% |
| IGF2 DMR0 | Methylation | 22.0% | 29.6% | 65.1% | 65.2% |
| Microsatellite instability (MSI) | |||||
| MSI | MSI-high | 28.2% | 4.9% | 85.9% | 85.7% |
| Protein expression | |||||
| CDH1 | Loss | 52.6% | 50.9% | 44.9% | 42.5% |
| CDKN1A | Loss | 72.3% | 89.2% | 52.8% | 55.2% |
| CDKN1B | Loss | 47.9% | 34.8% | 51.7% | 53.8% |
| CDKN2A | Loss | 35.3% | 17.9% | 46.8% | 47.8% |
| CDX2 | Loss | 36.6% | 17.2% | 43.2% | 39.7% |
| MGMT | Loss | 34.7% | 38.9% | 42.6% | 43.9% |
| AURKA | Overexpression | 22.2% | 14.3% | 32.6% | 28.4% |
| CCND1 | Overexpression | 82.6% | 73.5% | 64.9% | 65.5% |
| CD274 | Overexpression | 85.6% | 83.7% | 43.2% | 40.0% |
| CDK8 | Overexpression | 72.6% | 69.4% | 30.7% | 26.5% |
| CTNNB1 (nuclear) | Overexpression | 32.7% | 58.2% | 75.8% | 74.2% |
| CTSB | Overexpression | 82.7% | 82.9% | 45.2% | 42.3% |
| DNMT3B | Overexpression | 19.7% | 10.3% | 45.5% | 49.3% |
| EPAS1 | Overexpression | 47.0% | 44.5% | 46.2% | 42.0% |
| FASN | Overexpression | 61.1% | 60.0% | 64.8% | 65.9% |
| HGF | Overexpression | 45.8% | 47.9% | 39.6% | 37.2% |
| HIF1A | Overexpression | 17.0% | 20.1% | 47.7% | 42.6% |
| IGF2BP3 | Overexpression | 36.8% | 32.7% | 43.8% | 41.2% |
| IRS1 | Overexpression | 29.5% | 30.6% | 44.6% | 41.7% |
| IRS2 | Overexpression | 31.6% | 33.2% | 44.9% | 41.9% |
| PPARG | Overexpression | 24.1% | 19.2% | 33.6% | 29.4% |
| PTGER2 | Overexpression | 27.8% | 26.3% | 45.8% | 41.3% |
| PTGS2 | Overexpression | 53.5% | 69.7% | 81.7% | 79.9% |
| SIRT1 | Overexpression | 38.6% | 37.9% | 39.4% | 35.9% |
| STAT3 | Overexpression | 54.7% | 54.0% | 46.4% | 43.2% |
| TP53 | Overexpression | 33.0% | 53.2% | 66.7% | 67.2% |
| VDR | Overexpression | 37.0% | 38.2% | 47.4% | 42.5% |
| YAP1 (cytoplasmic) | Overexpression | 21.3% | 17.7% | 44.2% | 41.0% |
| JC Virus T-Antigen (JCVT) | Overexpression | 28.4% | 40.7% | 43.9% | 47.7% |
| Immune reactions | |||||
| Peritumoral lymphocytic reaction | Greater reaction | 19.4% | 12.9% | 95.8% | 91.2% |
| Intratumoral periglandular reaction | Greater reaction | 17.2% | 9.0% | 95.9% | 91.6% |
| Tumor infiltrating lymphocytes (TIL) | Greater reaction | 16.3% | 4.4% | 95.9% | 91.6% |
| Crohn’s-like reaction | Greater reaction | 9.9% | 5.0% | 80.4% | 73.2% |
| CD3+ in cancer area | Density (cells/mm2) | 716.6 (SD, 1501.8) | 696.5 (SD, 1560.7) | 47.1% | 42.9% |
| CD8+ in cancer area | Density (cells/mm2) | 814.7 (SD, 1741.0) | 700.9 (SD, 1582.1) | 46.7% | 41.7% |
| CD45RO+ in cancer area | Density (cells/mm2) | 711.4 (SD, 1113.4) | 634.4 (SD, 1244.7) | 48.1% | 43.6% |
| FOXP3+ in cancer area | Density (cells/mm2) | 40.0 (SD, 47.0) | 35.2 (SD, 37.9) | 45.2% | 41.9% |
| miRNA expression | |||||
| MIR21 | Normalized expression level | 8.3 (SD, 13.0) | 5.6 (SD, 4.0) | 53.2% | 48.6% |
| MIR155 | Normalized expression level | 0.01 (SD, 0.01) | 0.005 (SD, 0.006) | 53.2% | 48.6% |
| Microorganism | |||||
| Fusobacterium nucleatum | Presence | 16.0% | 9.1% | 71.7% | 67.1% |
aPercentage (%) indicates the proportion of the status measure for a binary biomarker, and the mean (SD) was calculated for a continuous biomarker
SD standard deviation
Table 2.
Demographic, clinical and pathologic features of colorectal cancers in the network analysis dataset by tumor location
| Total (n = 1380) | Proximal colon cancer (n = 690) | Distal colorectal cancer (n = 690) | P valuea | |
|---|---|---|---|---|
| Age, mean (SD) | 69.9 (8.6) | 70.0 (8.8) | 69.7 (8.5) | 0.56 |
| Sex | ||||
| Female | 758 (54.9%) | 379 (54.9%) | 379 (54.9%) | 0.99 |
| Male | 622 (45.1%) | 311 (45.1%) | 311 (45.1%) | |
| Tumor location | ||||
| Cecum | 253 (18.3%) | 253 (36.7%) | 0 (0%) | <0.0001 |
| Ascending colon | 303 (22.0%) | 303 (43.9%) | 0 (0%) | |
| Hepatic flexure | 45 (3.3%) | 45 (6.5%) | 0 (0%) | |
| Transverse colon | 89 (6.4%) | 89 (12.9%) | 0 (0%) | |
| Splenic flexure | 31 (2.2%) | 0 (0%) | 31 (4.5%) | |
| Descending colon | 66 (4.8%) | 0 (0%) | 66 (9.6%) | |
| Sigmoid colon | 296 (21.4%) | 0 (0%) | 296 (42.9%) | |
| Rectosigmoid junction | 100 (7.2%) | 0 (0%) | 100 (14.5%) | |
| Rectum | 197 (14.3%) | 0 (0%) | 197 (28.6%) | |
| TNM Stage | ||||
| I | 324 (26.2%) | 146 (22.9%) | 178 (29.7%) | 0.002 |
| II | 404 (32.7%) | 232 (36.4%) | 172 (28.7%) | |
| III | 332 (26.8%) | 159 (24.9%) | 173 (28.9%) | |
| IV | 177 (14.3%) | 101 (15.8%) | 76 (12.7%) | |
| Tumor differentiation | ||||
| Well to moderate | 1231 (89.2%) | 577 (83.6%) | 654 (94.8%) | <0.0001 |
| Poor | 149 (10.8%) | 113 (16.4%) | 36 (5.2%) | |
| Family history of colorectal cancer in first-degree relative(s) | ||||
| No | 1074 (78.4%) | 532 (77.9%) | 542 (78.9%) | 0.65 |
| Yes | 296 (21.6%) | 151 (22.1%) | 145 (21.1%) | |
The % numbers indicate the fraction of cases with a given feature among total cases, proximal colon cancer cases, or distal colorectal cancer cases
a P value was calculated using a t-test for age and chi-squared tests for categorical variables
In the correlation network analysis, a node represented a tumor tissue biomarker, and an edge was defined as a correlation between two nodes based on Spearman correlation analysis. Compared with the distal colorectal cancer network, the proximal colon cancer network had more edges and greater median degree (Table 3, Fig. 1). Nodes in the proximal colon cancer network tended to have a higher degree than those in the distal colorectal cancer network (P = 0.043 based on a K-S test, Fig. 2). The median degree value was 3.0 in the proximal colon cancer network and 2.0 in the distal colorectal cancer network. The total number of edges was significantly greater in the proximal colon cancer network (n = 173) than in the distal colorectal cancer network (n = 95) in a permutation test where tumor location variable was permuted among 1380 patients (P < 0.0001). Also, we observed significant difference in the total number of edges in another permutation test where values of each biomarker were permuted within proximal colon cancer patients and distal colorectal cancer patients separately (P < 0.0001). In addition, the value of the average clustering coefficient indicated that the nodes in the proximal colon cancer network tended to cluster together more than those in the distal colorectal cancer network (Table 3). We defined hubs as nodes with a high degree centrality (high connectivity with other nodes) based on the overall colorectal cancer network that pooled both proximal colon and distal colorectal cancer. Nodes with degree centrality greater than the 80th percentile were considered as hubs. We found hubs in the proximal colon cancer network, including MSI and MLH1 methylation, but not in the distal colorectal cancer network (Table 3). For these biomarkers, degree centrality was computed as the fraction of nodes to which a node was connected. The values of degree centrality in the proximal colon cancer network and the distal colorectal cancer network were 0.39 and 0.17 for MSI, 0.36 and 0.21 for MLH1 methylation. Within the distal colorectal cancer network, most of the nodes have a small number of connections. Methylation-related markers tended to have high degree centrality, although these markers were not hubs. The degree centrality values were 0.21 for MLH1 methylation, 0.19 for methylations in CACNA1G, NEUROG1, RUNX3, and SOCS1and 0.19 for BRAF mutation, and 0.19 for TIL.
Table 3.
Network characteristics by tumor location
| Total (N = 1380) | Proximal colon cancer (N = 690) | Distal colorectal cancer (N = 690) | |
|---|---|---|---|
| Correlation network based on original variables | |||
| Number of nodes | 54 | 54 | 54 |
| Number of edges | 268 | 173 | 95 |
| Median degree | 8.0 | 3.0 | 2.0 |
| Average clustering coefficient | 0.52 | 0.50 | 0.30 |
| Hubsa (degree centrality) |
RUNX3 (0.47) CACNA1G (0.45) MSI (0.45) MLH1 (0.43) TIL (0.43) BRAF (0.40) NEUROG1 (0.40) CRABP1 (0.38) IGF2 (0.38) SOCS1 (0.38) CDKN2A b (0.36) MIR155 (0.36) |
MSI (0.39) MLH1 (0.36) |
- |
| Correlation network in non-MSI-high cancer | |||
| Number of nodes | 53 | 53 | 53 |
| Median degree | 4.0 | 1.0 | 1.0 |
| Number of edges | 120 | 64 | 56 |
| Average clustering coefficient | 0.33 | 0.23 | 0.26 |
| Hubsa (degree centrality) |
RUNX3 (0.15) NEUROG1 (0.15) |
BRAF (0.19) CDKN2A b (0.17) IGF2 (0.17) RUNX3 (0.17) CACNA1G (0.15) CRABP1 (0.15) NEUROG1 (0.15) |
RUNX3 (0.15) NEUROG1 (0.15) |
| Correlation network based on the same number of edges | |||
| Number of nodes | 54 | 54 | 54 |
| Median degree | 1.5 | 4.0 | 1.0 |
| Number of edges | 100 | 100 | 100 |
| Average clustering coefficient | 0.27 | 0.29 | 0.27 |
| Hubsa (degree centrality) |
CACNA1G (0.26) IGF2 (0.26) RUNX3 (0.25) BRAF (0.23) MLH1 (0.23) MSI (0.23) CRABP1 (0.21) TIL (0.21) CDKN2A b (0.19) NEUROG1 (0.19) SOCS1 (0.19) |
CACNA1G (0.28) MLH1 (0.26) MSI (0.26) IGF2 (0.25) RUNX3 (0.25) BRAF (0.23) CRABP1 (0.23) CDKN2A b (0.21) TIL (0.21) NEUROG1 (0.19) SOCS1 (0.17) |
RUNX3 (0.19) IGF2 (0.17) NEUROG1 (0.17) |
aMarkers with degree centrality at or above the 80th percentile in the colorectal cancer network
b CDKN2A promoter hypermethylation
MSI microsatellite instability, TIL Tumor infiltrating lymphocytes
Fig. 1.
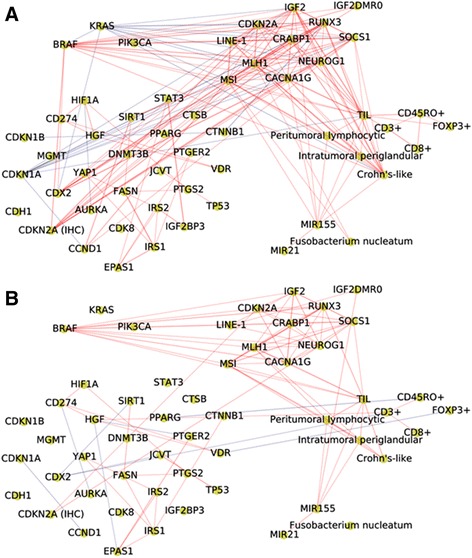
Biomarker networks by tumor location; proximal colon cancer network (a), and distal colorectal cancer network (b). A node represents a molecular feature, and an edge specifies a statistically significant Spearman correlation between two markers (nodes) with a significance level of 3.5 × 10⁻⁵ (0.05/1431, based on the Bonferroni correction). The red line indicates a positive correlation, and the blue line indicates a negative correlation; line width is proportional to correlation coefficient. CDKN2A (IHC), protein expression of CDKN2A; CDKN2A, methylation level of CDKN2A; LINE-1, methylation level of long interspersed nucleotide element 1; MSI, microsatellite instability; TIL, lymphocytes on top of neoplastic epithelial cells
Fig. 2.
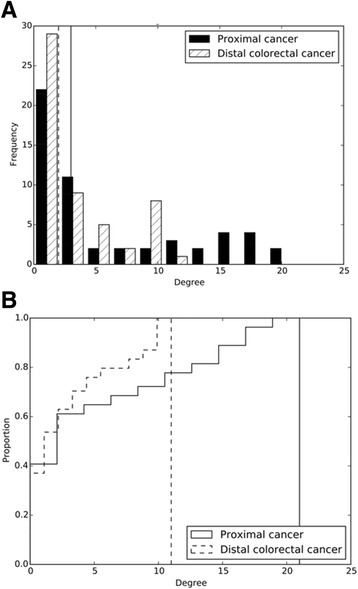
a Degree distribution in biomarker networks by tumor location. b Cumulative degree distribution in biomarker networks by tumor location. The solid (the distal colorectal cancer network) and dashed lines (the proximal colon cancer network) indicate the median degree values
To identify biomarkers that had higher connectivity particularly in the proximal colon cancer network compared with the distal colorectal cancer network, we calculated Cook’s distance (see Methods) for each highly-connected marker (those at or above the 80th percentile of the degree distribution in the overall colorectal cancer network) (Additional file 1: Figure S1). In Table 4, MSI showed the largest Cook’s distance (0.12) and was highly connected with other markers in the proximal colon cancer network (degree = 21), but not in the distal colorectal cancer network (degree = 9). In the proximal colon cancer network, MSI was positively correlated with MLH1 methylation (correlation coefficient [ρ] = 0.77), CACNA1G methylation (ρ = 0.55), RUNX3 methylation (ρ = 0.50), SOCS1 methylation (ρ = 0.49), IGF2 methylation (ρ = 0.46), CRABP1 methylation (ρ = 0.45), BRAF mutation (ρ = 0.44), TIL (ρ = 0.41), NEUROG1 methylation (ρ = 0.37), Crohn’s-like reaction (ρ = 0.37), CDKN2A methylation (ρ = 0.33), abundance of Fusobacterium nucleatum (ρ = 0.33), SIRT1 overexpression (ρ = 0.25), loss of CDX2 expression (ρ = 0.25), CCND1 overexpression (ρ = 0.25), LINE-1 methylation (ρ = 0.24), peritumoral lymphocytic reaction (ρ = 0.24), MIR155 expression (ρ = 0.22), and intratumoral periglandular reaction (ρ = 0.22). MSI was negatively correlated with KRAS mutation (ρ = −0.39) and loss of CDKN1A expression (ρ = −0.36), suggesting that these molecular events tended to be mutually exclusive with MSI-high. In the distal colorectal cancer network, MSI was also positively correlated with MLH1 methylation (ρ = 0.35), TIL (ρ = 0.29), RUNX3 methylation (ρ = 0.26), Crohn’s-like reaction (ρ = 0.24), CACNA1G methylation (ρ = 0.23), SOCS1 methylation (ρ = 0.22), intratumoral periglandular reaction (ρ = 0.22), BRAF mutation (ρ = 0.21), and peritumoral lymphocytic reaction (ρ = 0.19). These were the subset of biomarkers positively correlated with MSI in the proximal colon cancer network, implying a partly shared mechanism by which MSI promotes perturbation of cellular and molecular functions. Moreover, the methylation markers of MLH1, IGF2, and CACNA1G had a higher degree in the proximal colon cancer network compared with the distal colorectal cancer network. As shown in Fig. 1, negative correlations were observed between KRAS mutation and other biomarkers in the proximal colon cancer network, but not in the distal colorectal cancer network. In the proximal colon cancer network, KRAS mutation was negatively correlated with BRAF mutation (ρ = −0.47), MLH1 methylation (ρ = −0.40), MSI-high (ρ = −0.39), RUNX3 methylation (ρ = −0.34), CACNA1G methylation (ρ = −0.32), CRABP1 methylation (ρ = −0.31), IGF2 methylation (ρ = −0.30), loss of CDX2 expression (ρ = −0.29), SOCS1 methylation (ρ = −0.27), CDKN2A methylation (ρ = −0.23), NEUROG1 methylation (ρ = −0.22), and Crohn’s-like reaction (ρ = −0.20).
Table 4.
Markers with differential connectivity by tumor location based on Cook’s distance among highly-connected markersa
| Highly-connected markersa | Degree centrality | Degree in proximal colon cancer | Degree in distal colorectal cancer | Cook’s distance |
|---|---|---|---|---|
| MSI | 0.45 | 21 | 9 | 0.12 |
| IGF2 | 0.38 | 18 | 9 | 0.028 |
| CRABP1 | 0.38 | 16 | 8 | 0.015 |
| CACNA1G | 0.45 | 18 | 10 | 0.0071 |
| TIL | 0.43 | 18 | 10 | 0.0071 |
aHighly-connected markers which were at or above the 80th percentile of the degree distribution in the colorectal cancer network. The table shows markers with Cook’s distance higher than 0.005
MSI microsatellite instability, TIL tumor infiltrating lymphocytes
Biomarker networks constructed in non-MSI-high colorectal cancer
The higher frequency of MSI-high in the proximal colon cancer network compared with the distal colorectal cancer network could potentially result in the higher connectivity of the former. Therefore, as a secondary analysis, we restricted our analysis to patients with non-MSI-high cancer, and constructed networks by tumor location. After matching by age and sex, there were 246 patients with non-MSI-high proximal colon cancer and 246 patients with non-MSI-high distal colorectal cancer (Additional file 2: Figure S2). Compared with the distal colorectal cancer network, we observed a slightly higher connectivity and more hubs in the proximal colon cancer network. The total numbers of edges was 64 in the proximal colon cancer network and 56 in the distal colorectal cancer network (Table 3). Highly connected biomarkers (with degree centrality) were BRAF mutation (0.19) and methylation-related markers including CDKN2A (0.17), IGF2 (0.17), RUNX3 (0.17), CACNA1G (0.15), CRABP1 (0.15), and NEUROG1 (0.15) in the proximal colon cancer network. In the distal colorectal cancer network, two biomarkers were hubs including NEUROG1 methylation (degree centrality = 0.15) and RUNX3 methylation (degree centrality = 0.15). Among non-MSI-high cases, BRAF mutation was the most distinct marker that was strongly correlated with other markers in the proximal cancer network (degree = 10), but not in the distal cancer network (degree = 3) (Cook’s distance = 0.17). In the proximal colon cancer network, KRAS mutation tended to be mutually exclusive only with BRAF mutation, indicating that the observed negative correlations of KRAS mutation with methylation-related markers and other biomarkers might be confounded by MSI-high in our earlier analysis.
Biomarker networks with equal edge counts
To examine whether the difference in the number of edges across the two networks affected hub identification (designation of nodes as hubs), we modified each network by retaining 100 of the largest Spearman correlation coefficients in absolute values regardless of their P-values, resulting in two networks with 100 edges (Additional file 3: Figure S3). The median degree was 4.0 in the proximal colon cancer network and 1.0 in the distal colorectal cancer network, indicating that edges were confined to particular biomarkers in the proximal colon cancer network. When defined as markers with degree centrality at or above the 80th percentile in the colorectal cancer network, there were 11 hubs including methylation-related markers, MSI, BRAF mutation, and TIL in the proximal colon cancer network (Table 3). In contrast, only three methylation-related markers were identified as hubs in the distal colorectal cancer network. This finding supports the characteristics of the proximal colon cancer network observed in the original network analysis, where MSI and methylation-related markers were associated with perturbation of other molecular events.
Sensitivity analyses
Across different significance levels in the Spearman correlation analyses, the total number of edges in the proximal colon cancer network was consistently greater than in the distal colorectal cancer network, supporting a more highly correlated biomarker network in proximal colon cancer (Fig. 3). In addition, we constructed biomarker networks based on the Spearman correlation analyses using binary variables for all markers and still found that the proximal colon cancer network was denser than the distal colorectal cancer network (Additional file 4: Table S1). Moreover, the proximal colon cancer remained denser when the analysis included only biomarkers with missing data in less than 20% of the patients (Additional file 4: Table S1).
Fig. 3.
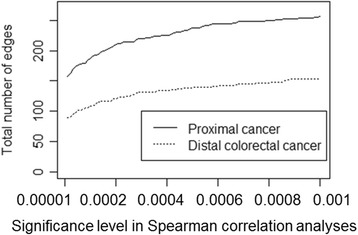
Total number of edges in biomarker networks as a function of the significance levels in Spearman correlation analyses
Discussion
Within a tumor molecular dataset including major mutational events, MSI, epigenetic features, protein expression status, and host immune reactions in 1380 colorectal cancer patients, we conducted a network analysis to evaluate biomarker network structure in proximal colon cancer and distal colorectal cancer. We found that in proximal colon cancer there were many highly correlated biomarkers, leading to an overall denser network as compared with distal colorectal cancer. In the distal colorectal cancer network, biomarkers had fewer connections and were less clustered, resulting in fewer hubs. This finding indicates that carcinogenic events in distal colorectal cancer tended to occur independently from each other. In the proximal colon cancer network, MSI was a hub and had differential connectivity with other biomarkers compared with the distal colorectal cancer network. In both the proximal colon and distal colorectal cancer networks, we observed common biomarkers that positively correlated with MSI including methylation-related markers, BRAF mutation, and immune reactions, while overexpression or loss of protein expression associated with MSI were further found only in the proximal colon cancer network. In addition to MSI, CpG island methylation in MLH1, IGF2, and CACNA1G genes were highly connected to other biomarkers mainly in proximal colon cancer. Among non-MSI-high patients, BRAF mutation status was the most distinct marker that was strongly associated with other molecular events in the proximal colon cancer network, but not in the distal colorectal cancer network. The sensitivity analyses consistently showed a denser network in proximal colon cancer when compared with the distal colorectal cancer network. Our results indicate that many molecular events occur in relation to MSI in proximal colon cancer, and that MSI and BRAF mutation played important roles in the carcinogenic process of proximal colon cancer.
In colorectal cancer and other types of cancer, previous biomarker network studies have shown the importance of interdependence of mutation, methylation, and protein expression [16, 17]. In a biological network, hubs (highly connected nodes) are considered to be drivers playing an essential role during tumorigenesis [14, 15]. Previous studies showed that MLH1 promoter methylation causes mismatch repair deficiency and MSI [2, 3]. In sporadic cancer, it is not well known whether MSI causes mutations in oncogenes and tumor-suppressor genes, and aberrant protein expressions. Earlier studies reported that genomic instability conferred by somatic mutational alterations further generates mutations in oncogenes or anti-oncogenes [18, 19]. Our results suggest that the role of MSI differ by tumor anatomic location; in proximal colon cancer, MSI might lead to perturbations of many molecular events, and in distal colorectal cancer molecular events are more likely independent from MSI. Consistent with our findings, MSI and CIMP-high were highly correlated and occurred more frequently in proximal colon cancer than in distal colorectal cancer [11]. Methylation signatures measured in our study were CIMP-specific markers which were correlated with each other. Thus, higher frequencies of MSI and CIMP-high might contribute to the higher connectivity of the proximal colon cancer network. However, even when we excluded MSI cancer patients from the analyses, the higher connectivity persisted in the proximal colon cancer network. In addition, when we modified the two networks such that each had 100 edges, corresponding to the 100 most positive or negative correlation coefficients, the proximal colon cancer network remained to have more hubs and greater median degree than the distal colorectal cancer network. Our findings provide new insights into the carcinogenesis of proximal colon cancer, which possibly exhibits highly interactive biological mechanisms.
BRAF oncogenic mutations are observed in 10% to 20% of colorectal cancer patients and are associated with MSI-high and CIMP-high phenotypes [19, 20]. The serine/threonine-protein kinase BRAF is involved in the mitogen-activated protein kinase (MAPK) pathway, which is associated with proliferation, cell growth, and differentiation [20]. In our study, CIMP-high was associated with BRAF mutation in both proximal colon and distal colorectal cancer. Previous studies observed CIMP-high and BRAF mutations in an early-stage colorectal neoplasm, and acquisition of BRAF mutation was considered to be mediated by DNA hypermethylation of several genes, including IGFBP7 and BMP3 [18]. The close relationship between CIMP and BRAF mutation may drive carcinogenesis regardless of tumor location.
A large body of literature demonstrated that colorectal cancer patients with non-MSI-high and mutant BRAF were associated with the highest mortality, whereas patients with MSI-high/BRAF-wild-type showed the lowest mortality when both MSI and BRAF mutation status were considered [21–24]. Among proximal colon cancer patients, the non-MSI-high/BRAF-mutant subtype was associated with a worse prognosis [25]. Together with these previous studies, our findings suggest the critical role of BRAF mutation in the absence of MSI-high especially in the proximal colon carcinogenesis.
Our results showed the strong negative correlation between BRAF and KRAS mutations specifically in proximal colon cancer. Both BRAF and KRAS oncogenes encode proteins involved in the MAPK pathway, and BRAF mutation has been reported to be mutually exclusive with KRAS mutation in colorectal cancer [26, 27]. BRAF is more frequently mutated in the proximal colon than distal colorectum, while the frequency of KRAS mutation is more similar throughout the colorectum except for the cecum [11]. The biological correlation pattern between BRAF and KRAS might depend on tumor location.
The distal colorectal cancer network was less densely connected than the proximal colon cancer network. Although we did not find biomarkers with high degree centrality, the promoter methylations, BRAF mutation, and TIL tended to be correlated with other molecular events. Distal carcinoma was previously reported to be more responsive to drug regimens, including 5-fluorouracil-based chemotherapeutics and single-agent anti-epidermal growth factor receptor (EGFR) antibodies, while proximal carcinoma tended to show more resistance to those treatments [12, 26]. Our results from the network analysis found that oncogenic processes are relatively independent from one another in distal colorectal cancer. Taken together, our data support a biological difference between colorectal carcinoma by tumor location.
We recognize that there are several limitations to our study. Although we chose widely recognized pathological biomarkers in colorectal cancer, our data did not cover all molecular pathological markers that have been reported in the literature, such as the mutation status of SMAD4 and PTEN [28, 29]. Our selection of the biomarkers might have resulted in a greater connectivity of the biomarker network in the proximal colon. Measurement errors could have existed in protein expression analyses using immunohistochemistry (IHC). Nonetheless, based on reviews by two independent pathologists, most of the IHC markers showed agreement levels generally considered to be reasonable in pathology research (kappa coefficient > 0.6). We conducted network analyses focusing on the proximal colon and distal colorectum, but not on more detailed segments (the cecum, ascending colon, hepatic flexure, transverse colon, splenic flexure, descending colon, sigmoid colon, rectosigmoid junction, and rectum). The importance of examining these segments warrants further investigations with even larger sample sizes. These results contribute to our understanding of colorectal carcinogenesis, suggesting a different mechanism by tumor location. Although our findings were corroborated by sensitivity analyses, future validation studies with independent data sets are necessary to confirm these findings.
Despite the limitations, our study has several strengths that distinguish it from previous studies. First, we measured different kinds of tumor biomarkers including somatic mutations, methylation levels, MSI status, immune reactions, and protein expressions. These measurements provided a reasonably comprehensive view of molecular interplay in the networks and enabled the identification of important carcinogenic pathways. Second, our overall sample size with 1380 cases enabled us to conduct robust network analyses using multiple biomarkers. Third, we collected colorectal tumors from hospitals and pathology laboratories across the U.S. (rather than one or a few hospitals), which increases generalizability of our findings.
Conclusions
Biomarkers in proximal colon cancer possessed higher connectivity while those in distal colorectal cancer tended to be independent from each other. In proximal colon cancer, MSI-high and BRAF mutation occurred in relation to many other tumor features, indicating their important roles during carcinogenesis. Our findings highlight the necessity of a systems therapeutic approach that can target both specific and multiple pathways of the proximal colon cancer network.
Methods
Study population and design
Initiated in 1976, the NHS enrolled 121,701 female nurses aged 30–55 years. Established in 1986, the HPFS enrolled 51,529 male health professionals including dentists, optometrists, osteopaths, pharmacists, podiatrists, and veterinarians aged 40–75 years. Within these two cohorts, colorectal cancer patients were ascertained by biennial questionnaires, the National Death Index (for unreported lethal cases), and reviews of medical records. Study physicians reviewed medical and pathological records to retrieve detailed information on colorectal tumors including TNM stage, differentiation, and bowel subsites. For bowel subsite sections, the proximal colon included the cecum, ascending colon, hepatic flexure, and transverse colon; the distal colorectum included the splenic flexure, descending colon, sigmoid colon, rectosigmoid junction, and rectum.
We collected formalin-fixed paraffin-embedded (FFPE) archival tumor tissue blocks from pathology laboratories in U.S. hospitals where patients underwent tumor resection. A centralized pathological review of hematoxylin and eosin-stained tissue sections was conducted by a single pathologist (S.O.) for all colorectal carcinoma cases. Tumor differentiation was categorized into well to moderate or poor, based on the extent of glandular areas. Based on the availability of tumor tissue blocks, 1591 cases were selected for the molecular and pathological analyses. Patients with proximal colon cancer were matched by age and sex to patients with distal colorectal cancer by randomly selecting a patient diagnosed with proximal colon cancer from the same sex and age category (<50, 50–59, 60–69, or ≥70 years). Subsequently, out of the 1591 patients in the original dataset, 1380 patients (690 patients with proximal colon cancer and 690 patients with distal colorectal cancer) were included in the network analysis dataset. For each marker, patients were excluded from an analysis when data on that marker were not available. Percentages of patients with available biomarkers are shown in Table 1.
Molecular pathological analysis
In the NHS and the HPFS, we utilized a colorectal cancer database which contained biomarker data on molecular alterations reported to play important roles in carcinogenic pathways in colorectal cancer. Tumor molecular and pathological markers in the database included mutational events, epigenetic features, protein expression levels, and host immune reactions in colorectal carcinoma. The analyses were performed as previously described. In FFPE tissues, DNA extraction and pyrosequencing were conducted for BRAF (codon 600), KRAS (codons 12, 13, 61, or 146), and PIK3CA (exons 9 and 20) [30–32]. The analysis of MSI was performed using 10 microsatellite markers (D2S123, D5S346, D17S250, BAT25, BAT26, BAT40, D18S55, D18S56, D18S67, and D18S487) [24]. We defined MSI-high as instability in ≥30% of the markers and MSI-low/microsatellite stability (MSS) as instability in <30% of the markers [24]. To quantify the amount of Fusobacterium nucleatum DNA, quantitative polymerase chain reaction (PCR) assay was performed using the TaqMan primer/probe sets (Applied Biosystems) for the nusG gene of Fusobacterium nucleatum and for SLCO2A1 as a reference human gene [33]. Amplification and detection of DNA was performed with the StepOnePlus Real-Time PCR Systems (Applied Biosystems).
DNA methylation was quantified using validated bisulfite DNA treatment and real-time PCR (MethyLight) for eight CpG island specific promoters including CACNA1G, CDKN2A (p16), CRABP1, IGF2, MLH1, NEUROG1, RUNX3, and SOCS1 [34]. The relative methylation level of long interspersed nucleotide element 1 (LINE-1) and IGF2 differentially methylated region 0 (DMR0) were quantified by pyrosequencing [35, 36].
Immunohistochemistry (IHC) analyses were conducted for the following protein markers: AURKA [37], CCND1 [38], CD274 (PD-L1) [39], CDH1 [40], CDK8 [41], CDKN1A [42], CDKN1B [42], CDKN2A [43], CDX2 [44], nuclear CTNNB1 [45], CTSB [46], DNMT3B [47], EPAS1 [48], FASN [49], HGF [50], HIF1A [48], IGF2BP3 [51], IRS1 [52], IRS2 [53], MGMT [54], PPARG [55], PTGER2 [56], PTGS2 [6], SIRT1 [57], STAT3 [58], TP53 [59], VDR [60], cytoplasmic YAP1 [61], and JC virus T-antigen (JCVT) [62]. For T cells in tumor tissue, we conducted IHC and image analysis on tissue microarray to measure densities of CD3+, CD8+, CD45RO+, and FOXP3+ cells (cells/mm2) [63]. Lymphocytic reactions were examined by the pathologist (S.O.) for tumor-infiltrating lymphocytes (i.e., lymphocytes on top of neoplastic epithelial cells, TIL), peritumoral lymphocytic reaction, intratumoral periglandular reaction, and Crohn’s-like reaction [64].
RNA was extracted from the colorectal tumor tissue and adjacent non-tumor tissue within FFPE samples, and cDNA was synthesized as previously described [4]. The expression levels of MIR21 and MIR155 were quantified using miScript PCR System (Qiagen, Valencia, CA) with the StepOnePlus Real-Time PCR Systems (Applied Biosystems, San Diego, CA) [65].
Statistical and network analysis
To compare demographic characteristics of proximal colon cancer patients with distal colorectal cancer patients, a chi-squared test was used to compare two or more categorical variables by location, and a t-test was conducted to compare age by location.
In the correlation network analysis [66], a node represented a tumor tissue biomarker. The structure of correlations was captured by placing an edge between any two nodes whose associated biomarkers exhibited statistically significant Spearman correlation, where the significance level for correlations was chosen to be 3.5 × 10⁻⁵ (= 0.05/1431, based on the Bonferroni correction). The pairwise correlation analysis was conducted as a complete case analysis in which patients without either biomarker information were excluded from the analysis. In the correlation analyses, we used continuous (for MSI and markers measuring levels of methylation, T-cell densities, miRNA expression, and Fusobacterium nucleatum), ordinal (for markers measuring tumor protein expression levels), and binary (for markers assessing mutation status) variables. The degree of a node was defined as the number of edges adjacent to the given node. We used a Kolmogorov-Smirnov (K-S) test to evaluate the distance between the cumulative degree distributions of the proximal colon cancer network and the distal colorectal cancer network. For each marker, degree centrality was computed as the fraction of nodes to which a node was connected (i.e., degree of a node divided by the number of all nodes in the network). A network node (marker) showing a high degree of connectedness, often referred to as a hub, is more likely to play an essential role in the disease network [14]. In the current study, hubs were defined as nodes with degree centrality greater than the 80th percentile based on overall colorectal cancer network that pooled both proximal colon and distal colorectal cancer. In each network, average clustering coefficient quantifies the overall clustering of nodes, indicating the tendency of markers to clustering together in the network [67]. For each node, a clustering coefficient was computed as the proportion of directly connected neighbors, and then an average of clustering coefficients was calculated in the network. To identify the markers that show distinct correlation patterns in proximal colon cancer versus distal colorectal cancer, we computed Cook’s distance based on linear regression analysis [68]. In this analysis, the degree of each node in the distal colorectal cancer networks was regressed on the degree of each node in the proximal colon cancer networks.
To assess the robustness of our results from the network analysis, we conducted permutation tests and sensitivity analyses. First, to evaluate the null hypothesis of no difference in network edge counts by tumor location, we permutated the dataset 10,000 times by randomly assigning tumor location in 1380 patients. Each time, networks were constructed by tumor location, and the difference in the total number of edges was computed. The two-sided P value was obtained as the proportion of random permutations that resulted in a difference in edge counts that was greater than or equal to the observed difference. Similarly, another permutation test was conducted by permuting values of each biomarker in 690 patients with proximal colon cancer and in 690 patients with distal colorectal cancer separately. In this process, we broke the linkage between each pair of biomarkers but retained imbalanced data (e.g., difference in mutation frequency) between tumor location. Second, across different significance levels of the Spearman correlation, we compared the number of edges in the proximal colon cancer network with that in the distal colorectal cancer network. Third, we used binary variables for all markers in the Spearman correlation analysis, and we constructed network models by tumor location. Fourth, we conducted a sensitivity analysis to include only selected markers that were available for more than 80% of the patients (BRAF, KRAS, PIK3CA, MLH1 methylation, CDKN2A methylation, CACNA1G methylation, CRABP1 methylation, IGF2 methylation, NEUROG1 methylation, RUNX3 methylation, SOCS1 methylation, MSI, LINE-1 methylation level, PTGS2, peritumoral lymphocytic reaction, intratumoral periglandular reaction, and TILs).
All the statistical analyses were carried out with SAS software (version 9.4, SAS Institute, Cary, NC). Network analysis was carried out with Python (version 2.7). All P values were two-sided.
Additional files
The biomarker network in colorectal cancer. A node represents a molecular feature, and an edge specifies the Spearman correlation between two markers with a significance level of 3.5 × 10⁻⁵ (0.05/1431, based on the Bonferroni correction). The red line indicates a positive correlation, and the blue line indicates a negative correlation. The line width is proportional to a correlation coefficient. CDKN2A (IHC), protein expression of CDKN2A; CDKN2A, methylation level of CDKN2A; LINE-1, methylation level of long interspersed nucleotide element 1; MSI, microsatellite instability; TIL, lymphocytes on top of neoplastic epithelial cells. (TIFF 344 KB)
The biomarker networks in non-MSI-high colorectal cancer; proximal colon cancer network (A), and distal colorectal cancer network (B). (TIFF 325 KB)
The biomarker networks with the same number of edges; proximal colon cancer network (A), and distal colorectal cancer network (B). (TIFF 311 KB)
Network characteristics by tumor location. (DOCX 16.4 KB)
Acknowledgements
We would like to thank the participants and staff of the Nurses’ Health Study and the Health Professionals Follow-up Study for their valuable contributions as well as the following state cancer registries for their help: AL, AZ, AR, CA, CO, CT, DE, FL, GA, ID, IL, IN, IA, KY, LA, ME, MD, MA, MI, NE, NH, NJ, NY, NC, ND, OH, OK, OR, PA, RI, SC, TN, TX, VA, WA, WY. The authors assume full responsibility for analyses and interpretation of these data.
Funding
This work was supported by U.S. National Institutes of Health (NIH) grants [P01 CA87969 to M.J. Stampfer; UM1 CA186107 to M.J. Stampfer; P01 CA55075 to W.C. Willett; UM1 CA167552 to W.C. Willett; P50 CA127003 to C.S.F.; K24 DK098311 and R01 CA137178 to A.T.C.; R01 CA151993 to S.O.; R35 CA197735 to S.O.; and K07 CA190673 to R.N.]; Nodal Award (to S.O.) from the Dana-Farber Harvard Cancer Center; and by grants from the Project P Fund, The Friends of the Dana-Farber Cancer Institute, Bennett Family Fund, and the Entertainment Industry Foundation through National Colorectal Cancer Research Alliance. K.M. was supported by a grant from Program for Advancing Strategic International Networks to Accelerate the Circulation of Talented Researchers from Japanese Society for the Promotion of Science. T.H. was supported by a fellowship grant from the Uehara Memorial Foundation and by a grant from the Mochida Memorial Foundation for Medical and Pharmaceutical Research. The content is solely the responsibility of the authors and does not necessarily represent the official views of NIH. The funders had no role in study design, data collection and analysis, decision to publish, or preparation of the manuscript.
Availability of data and materials
Data are available from the Harvard Cohorts Data Access Committee for researchers who meet the criteria for access to confidential data.
Authors’ contributions
RN, SO, PK, JQ, and JPO contributed to the concept and design of the study. RN, KM, TH, JAN, and ZRQ preformed data collection and cleaning. RN and JPO conducted data analyses. RN, SO, and JPO drafted the manuscript. RN, KG, KM, TH, JAN, ZRQ, PK, ELG, CSF, ATC, JQ, SO, and JPO provided interpretation of data and critical revision of the manuscript. PK, ELG, CSF, ATC, and JQ provided supervision. All authors read and approved the final manuscript.
Competing interests
Dr. Chan was previously a consultant of Bayer Healthcare, Millennium Pharmaceuticals, and Pfizer Inc. This study was not funded by Bayer Healthcare, Millennium Pharmaceuticals, or Pfizer Inc. No other conflict of interest exists.
Consent for publication
Not applicable.
Ethics approval and consent to participate
Written informed consent was obtained from all participants. Deaths were ascertained through the National Death Index, postal authorities, and next of kin from whom permission was granted to review medical records. This study was approved by the Human Subjects Committees of Harvard T.H. Chan School of Public Health and Brigham and Women’s Hospital.
Publisher’s Note
Springer Nature remains neutral with regard to jurisdictional claims in published maps and institutional affiliations.
Abbreviations
- CIMP
CpG island methylator phenotype
- FFPE
Formalin-fixed paraffin-embedded
- HPFS
Health Professionals Follow-up Study
- IGF2 DMR0
IGF2 differentially methylated region 0
- IHC
Immunohistochemistry
- JCVT
JC Virus T-Antigen
- K-S test
Kolmogorov-Smirnov test
- MAPK
Mitogen-activated protein kinase
- MSI
Microsatellite instability
- MSS
Microsatellite instability-low/microsatellite stability
- NHS
Nurses’ Health Study
- PCR
Quantitative polymerase chain reaction
- SD
Standard deviation
- TIL
Tumor infiltrating lymphocytes
Footnotes
Electronic supplementary material
The online version of this article (doi:10.1186/s12859-017-1718-5) contains supplementary material, which is available to authorized users.
Contributor Information
Reiko Nishihara, Email: rnishiha@hsph.harvard.edu.
Shuji Ogino, Email: shuji_ogino@dfci.harvard.edu.
Jukka-Pekka Onnela, Email: onnela@hsph.harvard.edu.
References
- 1.Emmert-Streib F, de Matos SR, Glazko G, McDade S, Haibe-Kains B, Holzinger A, Dehmer M, Campbell F. Functional and genetic analysis of the colon cancer network. BMC Bioinformatics. 2014;15(Suppl 6):S6. doi: 10.1186/1471-2105-15-S6-S6. [DOI] [PMC free article] [PubMed] [Google Scholar]
- 2.Vilar E, Gruber SB. Microsatellite instability in colorectal cancer-the stable evidence. Nat Rev Clin Oncol. 2010;7(3):153–162. doi: 10.1038/nrclinonc.2009.237. [DOI] [PMC free article] [PubMed] [Google Scholar]
- 3.Weisenberger DJ, Levine AJ, Long TI, Buchanan DD, Walters R, Clendenning M, Rosty C, Joshi AD, Stern MC, Le Marchand L, et al. Association of the colorectal CpG island methylator phenotype with molecular features, risk factors, and family history. Cancer Epidemiol Biomark Prev. 2015;24(3):512–519. doi: 10.1158/1055-9965.EPI-14-1161. [DOI] [PMC free article] [PubMed] [Google Scholar]
- 4.Mima K, Nishihara R, Nowak JA, Kim SA, Song M, Inamura K, Sukawa Y, Masuda A, Yang J, Dou R, et al. MicroRNA MIR21 and T cells in colorectal cancer. Cancer Immunol Res. 2016;4(1):33–40. doi: 10.1158/2326-6066.CIR-15-0084. [DOI] [PMC free article] [PubMed] [Google Scholar]
- 5.Zhang GJ, Xiao HX, Tian HP, Liu ZL, Xia SS, Zhou T. Upregulation of microRNA-155 promotes the migration and invasion of colorectal cancer cells through the regulation of claudin-1 expression. Int J Mol Med. 2013;31(6):1375–1380. doi: 10.3892/ijmm.2013.1348. [DOI] [PubMed] [Google Scholar]
- 6.Mima K, Nishihara R, Yang J, Dou R, Masugi Y, Shi Y, da Silva A, Cao Y, Song M, Nowak J, et al. MicroRNA MIR21 (miR-21) and PTGS2 expression in colorectal cancer and patient survival. Clin Cancer Res. 2016;22(15):3841–3848. doi: 10.1158/1078-0432.CCR-15-2173. [DOI] [PMC free article] [PubMed] [Google Scholar]
- 7.Pritchard CC, Grady WM. Colorectal cancer molecular biology moves into clinical practice. Gut. 2011;60(1):116–129. doi: 10.1136/gut.2009.206250. [DOI] [PMC free article] [PubMed] [Google Scholar]
- 8.Rozek LS, Schmit SL, Greenson JK, Tomsho LP, Rennert HS, Rennert G, Gruber SB. Tumor-Infiltrating Lymphocytes, Crohn’s-Like Lymphoid Reaction, and Survival From Colorectal Cancer. J Natl Cancer Inst. 2016;108(8):djw027. doi:10.1093/jnci/djw027. [DOI] [PMC free article] [PubMed]
- 9.Hofree M, Shen JP, Carter H, Gross A, Ideker T. Network-based stratification of tumor mutations. Nat Methods. 2013;10(11):1108–1115. doi: 10.1038/nmeth.2651. [DOI] [PMC free article] [PubMed] [Google Scholar]
- 10.Mutation Consequences and Pathway Analysis working group of the International Cancer Genome Consortium Pathway and network analysis of cancer genomes. Nat Methods. 2015;12(7):615–621. doi: 10.1038/nmeth.3440. [DOI] [PMC free article] [PubMed] [Google Scholar]
- 11.Yamauchi M, Morikawa T, Kuchiba A, Imamura Y, Qian ZR, Nishihara R, Liao X, Waldron L, Hoshida Y, Huttenhower C, et al. Assessment of colorectal cancer molecular features along bowel subsites challenges the conception of distinct dichotomy of proximal versus distal colorectum. Gut. 2012;61(6):847–854. doi: 10.1136/gutjnl-2011-300865. [DOI] [PMC free article] [PubMed] [Google Scholar]
- 12.Missiaglia E, Jacobs B, D'Ario G, Di Narzo AF, Soneson C, Budinska E, Popovici V, Vecchione L, Gerster S, Yan P, et al. Distal and proximal colon cancers differ in terms of molecular, pathological, and clinical features. Ann Oncol. 2014;25(10):1995–2001. doi: 10.1093/annonc/mdu275. [DOI] [PubMed] [Google Scholar]
- 13.Drewes JL, Housseau F, Sears CL. Sporadic colorectal cancer: microbial contributors to disease prevention, development and therapy. Br J Cancer. 2016;115(3):273–280. doi: 10.1038/bjc.2016.189. [DOI] [PMC free article] [PubMed] [Google Scholar]
- 14.Goh KI, Cusick ME, Valle D, Childs B, Vidal M, Barabasi AL. The human disease network. Proc Natl Acad Sci U S A. 2007;104(21):8685–8690. doi: 10.1073/pnas.0701361104. [DOI] [PMC free article] [PubMed] [Google Scholar]
- 15.Yang Y, Han L, Yuan Y, Li J, Hei N, Liang H. Gene co-expression network analysis reveals common system-level properties of prognostic genes across cancer types. Nat Commun. 2014;5:3231. doi: 10.1038/ncomms4231. [DOI] [PMC free article] [PubMed] [Google Scholar]
- 16.The Cancer Genome Atlas Network Comprehensive molecular characterization of human colon and rectal cancer. Nature. 2012;487(7407):330–337. doi: 10.1038/nature11252. [DOI] [PMC free article] [PubMed] [Google Scholar]
- 17.Sadanandam A, Lyssiotis CA, Homicsko K, Collisson EA, Gibb WJ, Wullschleger S, Ostos LC, Lannon WA, Grotzinger C, Del Rio M, et al. A colorectal cancer classification system that associates cellular phenotype and responses to therapy. Nat Med. 2013;19(5):619–625. doi: 10.1038/nm.3175. [DOI] [PMC free article] [PubMed] [Google Scholar]
- 18.Cahill DP, Kinzler KW, Vogelstein B, Lengauer C. Genetic instability and darwinian selection in tumours. Trends Cell Biol. 1999;9(12):M57–M60. doi: 10.1016/S0962-8924(99)01661-X. [DOI] [PubMed] [Google Scholar]
- 19.Negrini S, Gorgoulis VG, Halazonetis TD. Genomic instability--an evolving hallmark of cancer. Nat Rev Mol Cell Biol. 2010;11(3):220–228. doi: 10.1038/nrm2858. [DOI] [PubMed] [Google Scholar]
- 20.Barras D. BRAF mutation in colorectal cancer: an update. Biomark Cancer. 2015;7(Suppl 1):9–12. doi: 10.4137/BIC.S25248. [DOI] [PMC free article] [PubMed] [Google Scholar]
- 21.Phipps AI, Buchanan DD, Makar KW, Burnett-Hartman AN, Coghill AE, Passarelli MN, Baron JA, Ahnen DJ, Win AK, Potter JD, et al. BRAF mutation status and survival after colorectal cancer diagnosis according to patient and tumor characteristics. Cancer Epidemiol Biomark Prev. 2012;21(10):1792–1798. doi: 10.1158/1055-9965.EPI-12-0674. [DOI] [PMC free article] [PubMed] [Google Scholar]
- 22.Zlobec I, Bihl M, Foerster A, Rufle A, Lugli A. Comprehensive analysis of CpG Island Methylator phenotype (CIMP)-high, −low, and -negative colorectal cancers based on protein marker expression and molecular features. J Pathol. 2011;225(3):336–343. doi: 10.1002/path.2879. [DOI] [PubMed] [Google Scholar]
- 23.Gavin P, Colangelo LH, Fumagalli D, Tanaka N, Remillard MY, Yothers G, Kim C, Taniyama Y, Kim SI, Choi HJ, et al. Mutation profiling and microsatellite instability in stage II and III Colon cancer: an assessment of their prognostic and Oxaliplatin predictive value. Clin Cancer Res. 2012;18(23):6531–6541. doi: 10.1158/1078-0432.CCR-12-0605. [DOI] [PMC free article] [PubMed] [Google Scholar]
- 24.Lochhead P, Kuchiba A, Imamura Y, Liao X, Yamauchi M, Nishihara R, Qian ZR, Morikawa T, Shen J, Meyerhardt JA, et al. Microsatellite instability and BRAF mutation testing in colorectal cancer prognostication. J Natl Cancer Inst. 2013;105(15):1151–1156. doi: 10.1093/jnci/djt173. [DOI] [PMC free article] [PubMed] [Google Scholar]
- 25.Pai RK, Jayachandran P, Koong AC, Chang DT, Kwok S, Ma L, Arber DA, Balise RR, Tubbs RR, Shadrach B. BRAF-mutated, microsatellite-stable adenocarcinoma of the proximal colon: an aggressive adenocarcinoma with poor survival, mucinous differentiation, and adverse morphologic features. Am J Surg Pathol. 2012;36(5):744–752. doi: 10.1097/PAS.0b013e31824430d7. [DOI] [PMC free article] [PubMed] [Google Scholar]
- 26.Imamura Y, Morikawa T, Liao X, Lochhead P, Kuchiba A, Yamauchi M, Qian ZR, Nishihara R, Meyerhardt JA, Haigis KM, et al. Specific mutations in KRAS codons 12 and 13, and patient prognosis in 1075 BRAF wild-type colorectal cancers. Clin Cancer Res. 2012;18(17):4753–4763. doi: 10.1158/1078-0432.CCR-11-3210. [DOI] [PMC free article] [PubMed] [Google Scholar]
- 27.Morkel M, Riemer P, Blaker H, Sers C. Similar but different: distinct roles for KRAS and BRAF oncogenes in colorectal cancer development and therapy resistance. Oncotarget. 2015;6(25):20785–20800. doi: 10.18632/oncotarget.4750. [DOI] [PMC free article] [PubMed] [Google Scholar]
- 28.Dallol A, Buhmeida A, Al-Ahwal MS, Al-Maghrabi J, Bajouh O, Al-Khayyat S, Alam R, Abusanad A, Turki R, Elaimi A, et al. Clinical significance of frequent somatic mutations detected by high-throughput targeted sequencing in archived colorectal cancer samples. J Transl Med. 2016;14(1):118. doi: 10.1186/s12967-016-0878-9. [DOI] [PMC free article] [PubMed] [Google Scholar]
- 29.Pinheiro M, Pinto C, Peixoto A, Veiga I, Lopes P, Henrique R, Baldaia H, Carneiro F, Seruca R, Tomlinson I, et al. Target gene mutational pattern in lynch syndrome colorectal carcinomas according to tumour location and germline mutation. Br J Cancer. 2015;113(4):686–692. doi: 10.1038/bjc.2015.281. [DOI] [PMC free article] [PubMed] [Google Scholar]
- 30.Nishihara R, Lochhead P, Kuchiba A, Jung S, Yamauchi M, Liao X, Imamura Y, Qian ZR, Morikawa T, Wang M, et al. Aspirin use and risk of colorectal cancer according to BRAF mutation status. JAMA. 2013;309(24):2563–2571. doi: 10.1001/jama.2013.6599. [DOI] [PMC free article] [PubMed] [Google Scholar]
- 31.Imamura Y, Lochhead P, Yamauchi M, Kuchiba A, Qian ZR, Liao X, Nishihara R, Jung S, Wu K, Nosho K, et al. Analyses of clinicopathological, molecular, and prognostic associations of KRAS codon 61 and codon 146 mutations in colorectal cancer: cohort study and literature review. Mol Cancer. 2014;13:135. doi: 10.1186/1476-4598-13-135. [DOI] [PMC free article] [PubMed] [Google Scholar]
- 32.Liao X, Morikawa T, Lochhead P, Imamura Y, Kuchiba A, Yamauchi M, Nosho K, Qian ZR, Nishihara R, Meyerhardt JA, et al. Prognostic role of PIK3CA mutation in colorectal cancer: cohort study and literature review. Clin Cancer Res. 2012;18(8):2257–2268. doi: 10.1158/1078-0432.CCR-11-2410. [DOI] [PMC free article] [PubMed] [Google Scholar]
- 33.Mima K, Nishihara R, Qian ZR, Cao Y, Sukawa Y, Nowak JA, Yang J, Dou R, Masugi Y, Song M, et al. Fusobacterium nucleatum in colorectal carcinoma tissue and patient prognosis. Gut. 2016;65:1973–80. [DOI] [PMC free article] [PubMed]
- 34.Ogino S, Kawasaki T, Kirkner GJ, Kraft P, Loda M, Fuchs CS. Evaluation of markers for CpG island methylator phenotype (CIMP) in colorectal cancer by a large population-based sample. J Mol Diagn. 2007;9(3):305–314. doi: 10.2353/jmoldx.2007.060170. [DOI] [PMC free article] [PubMed] [Google Scholar]
- 35.Irahara N, Nosho K, Baba Y, Shima K, Lindeman NI, Hazra A, Schernhammer ES, Hunter DJ, Fuchs CS, Ogino S. Precision of pyrosequencing assay to measure LINE-1 methylation in colon cancer, normal colonic mucosa, and peripheral blood cells. J Mol Diagn. 2010;12(2):177–183. doi: 10.2353/jmoldx.2010.090106. [DOI] [PMC free article] [PubMed] [Google Scholar]
- 36.Baba Y, Nosho K, Shima K, Huttenhower C, Tanaka N, Hazra A, Giovannucci EL, Fuchs CS, Ogino S. Hypomethylation of the IGF2 DMR in colorectal tumors, detected by bisulfite pyrosequencing, is associated with poor prognosis. Gastroenterology. 2010;139(6):1855–1864. doi: 10.1053/j.gastro.2010.07.050. [DOI] [PMC free article] [PubMed] [Google Scholar]
- 37.Baba Y, Nosho K, Shima K, Irahara N, Kure S, Toyoda S, Kirkner GJ, Goel A, Fuchs CS, Ogino S. Aurora-a expression is independently associated with chromosomal instability in colorectal cancer. Neoplasia. 2009;11(5):418–425. doi: 10.1593/neo.09154. [DOI] [PMC free article] [PubMed] [Google Scholar]
- 38.Ogino S, Nosho K, Irahara N, Kure S, Shima K, Baba Y, Toyoda S, Chen L, Giovannucci EL, Meyerhardt JA, et al. A cohort study of cyclin D1 expression and prognosis in 602 colon cancer cases. Clin Cancer Res. 2009;15(13):4431–4438. doi: 10.1158/1078-0432.CCR-08-3330. [DOI] [PMC free article] [PubMed] [Google Scholar]
- 39.Masugi Y, Nishihara R, Yang J, Mima K, da Silva A, Shi Y, Inamura K, Cao Y, Song M, Nowak JA, et al. Tumour CD274 (PD-L1) expression and T cells in colorectal cancer. Gut. 2016. doi:10.1136/gutjnl-2016-311421. [DOI] [PMC free article] [PubMed]
- 40.Kim SA, Inamura K, Yamauchi M, Nishihara R, Mima K, Sukawa Y, Li T, Yasunari M, Morikawa T, Fitzgerald KC, et al. Loss of CDH1 (E-cadherin) expression is associated with infiltrative tumour growth and lymph node metastasis. Br J Cancer. 2016;114(2):199–206. doi: 10.1038/bjc.2015.347. [DOI] [PMC free article] [PubMed] [Google Scholar]
- 41.Firestein R, Shima K, Nosho K, Irahara N, Baba Y, Bojarski E, Giovannucci EL, Hahn WC, Fuchs CS, Ogino S. CDK8 expression in 470 colorectal cancers in relation to beta-catenin activation, other molecular alterations and patient survival. Int J Cancer. 2010;126(12):2863–2873. doi: 10.1002/ijc.24908. [DOI] [PMC free article] [PubMed] [Google Scholar]
- 42.Ogino S, Nosho K, Shima K, Baba Y, Irahara N, Kirkner GJ, Hazra A, De Vivo I, Giovannucci EL, Meyerhardt JA, et al. p21 expression in colon cancer and modifying effects of patient age and body mass index on prognosis. Cancer Epidemiol Biomark Prev. 2009;18(9):2513–2521. doi: 10.1158/1055-9965.EPI-09-0451. [DOI] [PMC free article] [PubMed] [Google Scholar]
- 43.Shima K, Nosho K, Baba Y, Cantor M, Meyerhardt JA, Giovannucci EL, Fuchs CS, Ogino S. Prognostic significance of CDKN2A (p16) promoter methylation and loss of expression in 902 colorectal cancers: cohort study and literature review. Int J Cancer. 2011;128(5):1080–1094. doi: 10.1002/ijc.25432. [DOI] [PMC free article] [PubMed] [Google Scholar]
- 44.Baba Y, Nosho K, Shima K, Freed E, Irahara N, Philips J, Meyerhardt JA, Hornick JL, Shivdasani RA, Fuchs CS, et al. Relationship of CDX2 loss with molecular features and prognosis in colorectal cancer. Clin Cancer Res. 2009;15(14):4665–4673. doi: 10.1158/1078-0432.CCR-09-0401. [DOI] [PMC free article] [PubMed] [Google Scholar]
- 45.Nan H, Morikawa T, Suuriniemi M, Imamura Y, Werner L, Kuchiba A, Yamauchi M, Hunter DJ, Kraft P, Giovannucci EL, et al. Aspirin use, 8q24 single nucleotide polymorphism rs6983267, and colorectal cancer according to CTNNB1 alterations. J Natl Cancer Inst. 2013;105(24):1852–1861. doi: 10.1093/jnci/djt331. [DOI] [PMC free article] [PubMed] [Google Scholar]
- 46.Chan AT, Baba Y, Shima K, Nosho K, Chung DC, Hung KE, Mahmood U, Madden K, Poss K, Ranieri A, et al. Cathepsin B expression and survival in colon cancer: implications for molecular detection of neoplasia. Cancer Epidemiol Biomark Prev. 2010;19(11):2777–2785. doi: 10.1158/1055-9965.EPI-10-0529. [DOI] [PMC free article] [PubMed] [Google Scholar]
- 47.Nosho K, Shima K, Irahara N, Kure S, Baba Y, Kirkner GJ, Chen L, Gokhale S, Hazra A, Spiegelman D, et al. DNMT3B expression might contribute to CpG island methylator phenotype in colorectal cancer. Clin Cancer Res. 2009;15(11):3663–3671. doi: 10.1158/1078-0432.CCR-08-2383. [DOI] [PMC free article] [PubMed] [Google Scholar]
- 48.Baba Y, Nosho K, Shima K, Irahara N, Chan AT, Meyerhardt JA, Chung DC, Giovannucci EL, Fuchs CS, Ogino S. HIF1A overexpression is associated with poor prognosis in a cohort of 731 colorectal cancers. Am J Pathol. 2010;176(5):2292–2301. doi: 10.2353/ajpath.2010.090972. [DOI] [PMC free article] [PubMed] [Google Scholar]
- 49.Ogino S, Nosho K, Meyerhardt JA, Kirkner GJ, Chan AT, Kawasaki T, Giovannucci EL, Loda M, Fuchs CS. Cohort study of fatty acid synthase expression and patient survival in colon cancer. J Clin Oncol. 2008;26(35):5713–5720. doi: 10.1200/JCO.2008.18.2675. [DOI] [PMC free article] [PubMed] [Google Scholar]
- 50.Seneviratne D, Ma J, Tan X, Kwon YK, Muhammad E, Melhem M, DeFrances MC, Zarnegar R. Genomic instability causes HGF gene activation in colon cancer cells, promoting their resistance to necroptosis. Gastroenterology. 2015;148(1):181–191. doi: 10.1053/j.gastro.2014.09.019. [DOI] [PMC free article] [PubMed] [Google Scholar]
- 51.Lochhead P, Imamura Y, Morikawa T, Kuchiba A, Yamauchi M, Liao X, Qian ZR, Nishihara R, Wu K, Meyerhardt JA, et al. Insulin-like growth factor 2 messenger RNA binding protein 3 (IGF2BP3) is a marker of unfavourable prognosis in colorectal cancer. Eur J Cancer. 2012;48(18):3405–3413. doi: 10.1016/j.ejca.2012.06.021. [DOI] [PMC free article] [PubMed] [Google Scholar]
- 52.Hanyuda A, Kim SA, Martinez-Fernandez A, Qian ZR, Yamauchi M, Nishihara R, Morikawa T, Liao X, Inamura K, Mima K, et al. Survival benefit of exercise differs by tumor IRS1 expression status in colorectal cancer. Ann Surg Oncol. 2016;23(3):908–917. doi: 10.1245/s10434-015-4967-4. [DOI] [PMC free article] [PubMed] [Google Scholar]
- 53.Day E, Poulogiannis G, McCaughan F, Mulholland S, Arends MJ, Ibrahim AE, Dear PH. IRS2 is a candidate driver oncogene on 13q34 in colorectal cancer. Int J Exp Pathol. 2013;94(3):203–211. doi: 10.1111/iep.12021. [DOI] [PMC free article] [PubMed] [Google Scholar]
- 54.Shima K, Morikawa T, Baba Y, Nosho K, Suzuki M, Yamauchi M, Hayashi M, Giovannucci E, Fuchs CS, Ogino S. MGMT promoter methylation, loss of expression and prognosis in 855 colorectal cancers. Cancer Causes Control. 2011;22(2):301–309. doi: 10.1007/s10552-010-9698-z. [DOI] [PMC free article] [PubMed] [Google Scholar]
- 55.Ogino S, Shima K, Baba Y, Nosho K, Irahara N, Kure S, Chen L, Toyoda S, Kirkner GJ, Wang YL, et al. Colorectal cancer expression of peroxisome proliferator-activated receptor gamma (PPARG, PPARgamma) is associated with good prognosis. Gastroenterology. 2009;136(4):1242–1250. doi: 10.1053/j.gastro.2008.12.048. [DOI] [PMC free article] [PubMed] [Google Scholar]
- 56.Baba Y, Nosho K, Shima K, Goessling W, Chan AT, Ng K, Chan JA, Giovannucci EL, Fuchs CS, Ogino S. PTGER2 overexpression in colorectal cancer is associated with microsatellite instability, independent of CpG island methylator phenotype. Cancer Epidemiol Biomark Prev. 2010;19(3):822–831. doi: 10.1158/1055-9965.EPI-09-1154. [DOI] [PMC free article] [PubMed] [Google Scholar]
- 57.Nosho K, Shima K, Irahara N, Kure S, Firestein R, Baba Y, Toyoda S, Chen L, Hazra A, Giovannucci EL, et al. SIRT1 histone deacetylase expression is associated with microsatellite instability and CpG island methylator phenotype in colorectal cancer. Mod Pathol. 2009;22(7):922–932. doi: 10.1038/modpathol.2009.49. [DOI] [PMC free article] [PubMed] [Google Scholar]
- 58.Morikawa T, Baba Y, Yamauchi M, Kuchiba A, Nosho K, Shima K, Tanaka N, Huttenhower C, Frank DA, Fuchs CS, et al. STAT3 expression, molecular features, inflammation patterns, and prognosis in a database of 724 colorectal cancers. Clin Cancer Res. 2011;17(6):1452–1462. doi: 10.1158/1078-0432.CCR-10-2694. [DOI] [PMC free article] [PubMed] [Google Scholar]
- 59.Morikawa T, Kuchiba A, Liao X, Imamura Y, Yamauchi M, Qian ZR, Nishihara R, Sato K, Meyerhardt JA, Fuchs CS, et al. Tumor TP53 expression status, body mass index and prognosis in colorectal cancer. Int J Cancer. 2011;131(5):1169–1178. doi: 10.1002/ijc.26495. [DOI] [PMC free article] [PubMed] [Google Scholar]
- 60.Kure S, Nosho K, Baba Y, Irahara N, Shima K, Ng K, Meyerhardt JA, Giovannucci EL, Fuchs CS, Ogino S. Vitamin D receptor expression is associated with PIK3CA and KRAS mutations in colorectal cancer. Cancer Epidemiol Biomark Prev. 2009;18(10):2765–2772. doi: 10.1158/1055-9965.EPI-09-0490. [DOI] [PMC free article] [PubMed] [Google Scholar]
- 61.Barry ER, Morikawa T, Butler BL, Shrestha K, de la Rosa R, Yan KS, Fuchs CS, Magness ST, Smits R, Ogino S, et al. Restriction of intestinal stem cell expansion and the regenerative response by YAP. Nature. 2013;493(7430):106–110. doi: 10.1038/nature11693. [DOI] [PMC free article] [PubMed] [Google Scholar]
- 62.Nosho K, Shima K, Kure S, Irahara N, Baba Y, Chen L, Kirkner GJ, Fuchs CS, Ogino S. JC virus T-antigen in colorectal cancer is associated with p53 expression and chromosomal instability, independent of CpG island methylator phenotype. Neoplasia. 2009;11(1):87–95. doi: 10.1593/neo.81188. [DOI] [PMC free article] [PubMed] [Google Scholar]
- 63.Nosho K, Baba Y, Tanaka N, Shima K, Hayashi M, Meyerhardt JA, Giovannucci E, Dranoff G, Fuchs CS, Ogino S. Tumour-infiltrating T-cell subsets, molecular changes in colorectal cancer, and prognosis: cohort study and literature review. J Pathol. 2010;222(4):350–366. doi: 10.1002/path.2774. [DOI] [PMC free article] [PubMed] [Google Scholar]
- 64.Ogino S, Nosho K, Irahara N, Meyerhardt JA, Baba Y, Shima K, Glickman JN, Ferrone CR, Mino-Kenudson M, Tanaka N, et al. Lymphocytic reaction to colorectal cancer is associated with longer survival, independent of lymph node count, microsatellite instability, and CpG island methylator phenotype. Clin Cancer Res. 2009;15(20):6412–6420. doi: 10.1158/1078-0432.CCR-09-1438. [DOI] [PMC free article] [PubMed] [Google Scholar]
- 65.Mima K, Nishihara R, Yang J, Dou R, Masugi Y, Shi Y, da Silva A, Cao Y, Song M, Nowak J et al. MicroRNA <i>MIR21</i> (miR-21) and PTGS2 expression in colorectal cancer and patient survival. Clin Cancer Res. 2016;22(15):3841–48. [DOI] [PMC free article] [PubMed]
- 66.Barnett I, Onnela JP. Change point detection in correlation networks. Sci Rep. 2016;6:18893. doi: 10.1038/srep18893. [DOI] [PMC free article] [PubMed] [Google Scholar]
- 67.Watts DJ, Strogatz SH. Collective dynamics of ‘small-world’ networks. Nature. 1998;393(6684):440–442. doi: 10.1038/30918. [DOI] [PubMed] [Google Scholar]
- 68.Cook DR. Influential observations in linear regression. J Am Stat Assoc. 1979;74(365):169–174. doi: 10.1080/01621459.1979.10481634. [DOI] [Google Scholar]
Associated Data
This section collects any data citations, data availability statements, or supplementary materials included in this article.
Supplementary Materials
The biomarker network in colorectal cancer. A node represents a molecular feature, and an edge specifies the Spearman correlation between two markers with a significance level of 3.5 × 10⁻⁵ (0.05/1431, based on the Bonferroni correction). The red line indicates a positive correlation, and the blue line indicates a negative correlation. The line width is proportional to a correlation coefficient. CDKN2A (IHC), protein expression of CDKN2A; CDKN2A, methylation level of CDKN2A; LINE-1, methylation level of long interspersed nucleotide element 1; MSI, microsatellite instability; TIL, lymphocytes on top of neoplastic epithelial cells. (TIFF 344 KB)
The biomarker networks in non-MSI-high colorectal cancer; proximal colon cancer network (A), and distal colorectal cancer network (B). (TIFF 325 KB)
The biomarker networks with the same number of edges; proximal colon cancer network (A), and distal colorectal cancer network (B). (TIFF 311 KB)
Network characteristics by tumor location. (DOCX 16.4 KB)
Data Availability Statement
Data are available from the Harvard Cohorts Data Access Committee for researchers who meet the criteria for access to confidential data.