Abstract
Despite its simplicity and noninvasiveness, the use of the electrogastrogram (EGG) remains limited in clinical practice for assessing gastric disorders. Recent studies have characterized the occurrence of spatial gastric myoelectric abnormalities that are ignored by typical approaches relying on time-frequency analysis of single channels. In this paper we present the high-resolution (HR) EGG, which utilizes an array of electrodes to estimate the direction and speed of gastric slow-waves. The approach was verified on a forward electrophysiology model of the stomach, demonstrating that an accurate assessment of slow-wave propagation can be made. Furthermore, we tested the methodology on eight healthy adults and calculated propagation directions (181 ± 29 degrees) and speeds (3.7 ± 0.5 mm/s) that are consistent with serosal recordings of slow-waves described in the literature. By overcoming the limitations of current methods, HR-EGG is a fully automated tool that may unveil new classes of gastric abnormalities. This could lead to a better diagnosis of diseases and inspire novel drugs and therapies, ultimately improving clinical outcomes.
Index Terms: EGG, electrophysiology, gastric myoelectric activity, medical signal processing, multi-channel, slow-waves, smooth muscle, stomach, wave propagation
I. Introduction
Electrogastrography (EGG) is a noninvasive technique for recording the gastric myoelectric activity using electrodes placed cutaneously on the abdominal surface overlaying the stomach. The simplicity and safety of EGG make it attractive for diagnosing abnormalities in gastric motility. Spectral analysis of individual EGG channels have previously been used to quantify anomalies. Normal EGG readings have traditionally been defined as demonstrating a 2–4 cycles/minute frequency for at least 70% of the recording [1]. Moreover, the amplitude of the signal increases after meal ingestion for normal subjects, reflecting a postprandial increase in the electromechanical activity of the stomach [1]. EGG irregularities, including bradygastria, tachygastria, and concurrent loss of signal amplitude increase with meal ingestion, have been reported in patients with nausea and vomiting [2], dyspepsia [3], [4], gastroparesis [5], and motion sickness [6].
There have been contradictory reports in the literature about the correlation between EGG parameters and abnormalities in gastric emptying. Some investigations have reported no relation [7], while others have reported a strong positive correlation [8]. Overall, normal EGG does not assure normal gastric emptying (sensitivity < 50%), but an abnormal EGG may predict delayed gastric emptying (specificity 78%–92%) [9]. In other words, while subjects with an abnormal EGG typically have delayed gastric emptying, there are patients with a normal EGG who can still have slow emptying. This limitation is an important reason why EGG has not been widely adopted clinically.
High-resolution electrical mapping during surgery has recently been carried out to understand normal gastric slow-wave activity [10]. This technique involves positioning a spatially dense electrode array directly on the surface of the stomach to allow for the recording and reconstruction of patterns of electrical activation [11]. The finding for normal subjects, in brief, was that the gastric slow-waves originate in the pacemaker region of the corpus, quickly form circumferential bands around the stomach, propagate slowly in the axial direction, and eventually terminate in the pylorus. Due to the slow speed of propagation, multiple wavefronts typically exist on the stomach surface at any given time.
Using the same technique, the researchers also evaluated the gastric slow-waves in subjects with gastroparesis [12] and chronic unexplained nausea and vomiting [13] in order to define, quantify, and classify abnormalities with spatiotemporal detail. They observed aberrant initiation and conduction of the slow-waves, which occasionally led to premature termination and colliding wavefronts. The crucial finding was that half of the subjects exhibited spatial abnormalities that occurred at the normal 3 cpm frequency. This suggests that single channel EGG recordings are unable to detect such abnormalities. Results from a recent study [14] further emphasize this point by modeling both normal slow-wave propagation and a conduction block resulting in colliding wavefronts. It revealed that a single channel EGG recording on the abdominal surface would be unable to detect the irregularity.
There have been attempts at extracting EGG spatial information from multiple surface electrodes in the past [15], [16]. By placing four electrodes along the axis of the stomach, the amount of frequency coupling between channels can be evaluated, with the notion that coupling between channels reflects normal wave propagation. This method, however, does not measure true wave propagation and therefore does not accurately estimate propagation velocity. Moreover, this approach is dependent on the placement of electrodes, particularly the reference. If the reference electrode is positioned in a region with strong gastric signal, phase shifts will not be observed. Given the amount of inter-subject variability in stomach anatomy, standardizing electrode placement becomes challenging [17], [18].
In addition to the potentials recorded by surface electrodes in the EGG, the gastric electrical currents also produce a magnetic field that can be measured with a magnetometer, known as the magnetogastrogram (MGG). The relationship between the EGG and MGG is analogous to that of the electroencephalogram (EEG) and magnetoencephalogram (MEG) utilized for studying the activity of the brain. The MGG has been used to detect gastric slow-wave frequency and propagation with promising results [19], [20]. A key feasibility distinction between the two modalities is that the MGG requires measuring the signal with large, expensive equipment in a controlled environment, while the EGG has the potential for ambulatory monitoring [21].
Herein, we address the spatial limitations of the EGG by presenting the high-resolution electrogastrogram (HR-EGG), a method for determining gastric slow-wave propagation direction and speed from an array of skin-mounted electrodes.
II. Methodology
A. Spatial Sampling
In order to accurately map the potentials on the abdominal surface, the layout and size of the electrodes need to be considered. The abdominal surface potential is a continuous field that is discretely sampled at each electrode location. The recorded potentials are a smeared version of the current sources generated by the interstitial cells of Cajal on the stomach surface. This is due to the conduction of the signal through the tissue (i.e. fat, muscle, and skin) separating the electrodes and the source. While volume conduction limits the spatial resolution of HR-EGG compared to serosal recordings, it makes it feasible to discretely sample the abdominal potentials. The separating tissue acts as a natural anti-aliasing spatial filter, enabling accurate sampling of the potentials with a reasonable number of electrodes [22].
The discrete sampling of continuous time-series data has been well-characterized [23]. The key concept is the Nyquist criterion, which states that for lossless digitization, the sampling rate should be at least twice the maximum frequency (i.e. fs > 2fmax, where fs is the sampling rate and fmax is the maximum frequency of the signal). Once a time series has been aliased, there is no signal processing technique that can recover the lost information.
The Nyquist criterion for temporal sampling also applies to spatial sampling. The density and measurement area of the electrodes dictate the highest spatial frequency that can be detected without spatial aliasing. The electrode is an analog filter that eliminates spatial frequencies with wavelengths shorter than its measurement diameter [22]. This is due to fact that the electrode averages the potentials within the region that is in contact with the gel or measurement area. Consider an array of electrodes that have uniform center-to-center spacing d and electrode diameter D. Applying the Nyquist criterion to the edge-to-edge distance between neighboring electrodes results in the following constraint:
| (1) |
where λmin is the shortest spatial wavelength of the signal [22].
The electrode spacing and measurement area is determined by a lower bound for the spatial wavelength of the cutaneous wave, which can be estimated by considering its slowest speed and highest frequency (λ = speed/freq). We assume that the slowest physiological serosal and cutaneous speeds are equivalent. After applying the appropriate values from the literature for healthy subjects (1.5 mm/s, 0.06 Hz) [10], the minimum spatial wavelength (λmin) of the cutaneous wave is calculated to be 25 mm. Therefore, to ensure that no spatial aliasing occurs, the edge-to-edge distance between electrodes should be less than 12.5 mm (λmin/2). We chose an electrode diameter D of 11 mm with a center-to-center spacing d of 20 mm, which results in an edge-to-edge distance of 9 mm to satisfy this condition.
B. Surface Laplacian
Typically, biopotentials are recorded with a differential amplifier, where the desired signal appears as a voltage between two input terminals. Differential amplifiers are able to reject the common mode signal from various sources of interference, yielding improved signal quality. A consequence of this recording scheme is that the local potentials are not accurately depicted. The surface Laplacian can provide a more realistic representation of local source distributions compared to conventional bipolar recordings by removing the effects of the reference electrode and eliminating volume conducted signals from distant regions [24]. The surface Laplacian has previously been applied for ECG mapping to provide better spatial resolution and resolve depolarizations in different regions of the heart [25]. The surface Laplacian has also been shown to be more robust to ECG and respiratory interference when recording small intestine electrical activity [26].
The surface Laplacian is the second spatial derivative of the surface potential estimated on the surface of a geometry that passes through the electrode locations. For a voltage Φ on a planar surface, it is defined by the expression:
| (2) |
A simple nearest-neighbor method of estimating the surface Laplacian of EEG data was first published in 1975 by Hjorth [27]. This approach used a finite-difference approximation for the second spatial derivative of the scalp potential by averaging potential differences between a central and four surrounding electrode locations. Although there have been many advances since the first paper, the finite-difference approximation is practical and easy to implement.
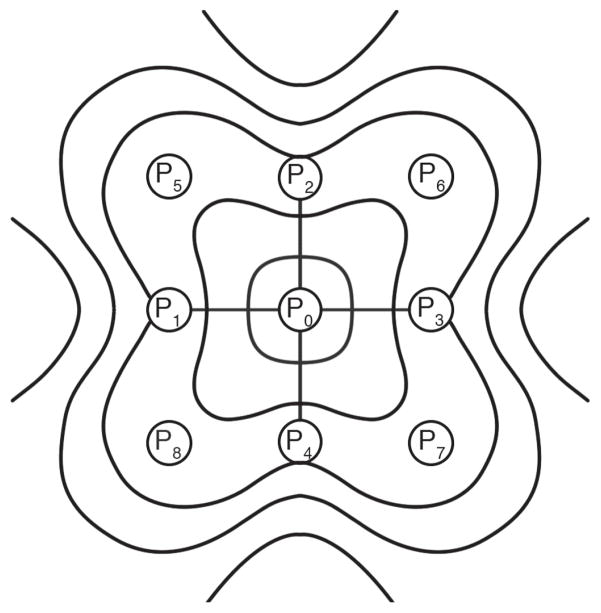
The original method was improved by including eight electrodes positioned radially with respect to the central electrode position [28]. Involving a larger number of electrodes improves the possibility of obtaining a good approximation. Before averaging, the potential difference is divided by the corresponding electrode distance in order to represent the gradient. This is calculated using the following equation:
| (3) |
where, P0 is the potential measured at the central electrode, and P1 to P8 are the potentials measured at the radially neighboring electrodes, as seen in Fig. 1. The weighting coefficient for each of the surrounding electrodes is proportional to the reciprocal of its distance to the center electrode. The method described by (3) was used as a pre-processing step before the estimation of wave propagation.
Fig. 1.
Schematic used to illustrate the eight neighboring electrodes that are used to calculate the finite-difference surface Laplacian. The source activity is within a measurement area centered at electrode P0.
C. Wave Estimation
Motivated by a realistic, multi-scale model of EGG [29], we expected coherent spatial propagation of the surface potential in healthy subjects. We implemented a technique originally developed to compute the 2D component velocity from image sequences [30] to estimate features of stomach wave propagation on the abdominal surface. By using a data-driven approach that evaluates the temporal evolution of constant phase spatial contours, strong underlying assumptions are not made of the spatial properties of the cutaneous potentials.
Here, we provide the framework which forms the basis of the algorithm. The Hilbert transform is first applied to the surface Laplacian estimate at each electrode location (x, y), resulting in a characterization of instantaneous amplitude a (x, y, t) and phase φ (x, y, t):
| (4) |
In biological signals, contours of constant phase provide a better approximation to the motion field compared to those of constant amplitude, since the amplitude of the signal is proportional to the distance of the recording electrode to the source. Surfaces of constant phase satisfy the equation:
| (5) |
By assuming that the constant phase surfaces move along the motion field, we can differentiate the phase with respect to time using the total derivative:
| (6) |
where ∇φ is the spatial gradient of the instantaneous phase, is the wave velocity, and “·” represents the dot product operator. Since the phase gradient is parallel to the velocity direction, the speed can be calculated as:
| (7) |
where for any z ∈ ℝn, ||z|| represents the 2-norm and z̄ indicates the spatial average (i.e. across all electrodes) at a given time. The wave direction is then computed by:
| (8) |
where ang(·) is the element-wise arc tangent, choosing the quadrant correctly.
A quantity called phase gradient directionality, PGD (t), is defined as a measure of how well the phase gradients align across the array [31]:
| (9) |
PGD can take on values between 0 and 1, where 0 represents phase gradients that are randomly distributed and a value of 1 signifies perfect spatial alignment.
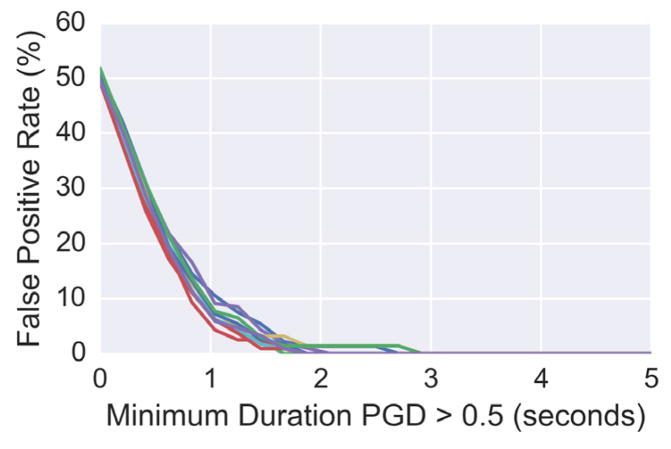
Estimates at time points when the PGD is less than 0.5 are typically ignored, since velocity is only well-defined when phase gradients are coherent across the array [31]. With a small number of sensors, it is possible that the PGD can be greater than 0.5 by chance, even when a spatial wave does not exist. We generated independent, identically distributed (i.i.d.) white Gaussian noise on a 3 by 3 sensor array across time (i.e. no spatial wave present) and evaluated the false positive rate of the PGD being greater than 0.5 by coincidence. Without an additional minimum duration constraint, up to a 50% of the samples would be considered to be a wave (see Fig. 2). By further imposing criteria that the PGD must be above 0.5 for a certain duration of time, the likelihood of false positives can be drastically reduced. We defined a sustained wave as one having a PGD greater than 0.5 for at least 2 seconds, since the false positive rate for noise with this specification is near zero (see Fig. 2). Values of wave propagation direction and speed in this paper are reported for instances that meet these criteria.
Fig. 2.
The false positive rate of white Gaussian noise being classified with PGD greater than 0.5 as a function of minimum sustained wave duration. The different lines indicate independent simulations.
III. Experimental Methods
A. Model
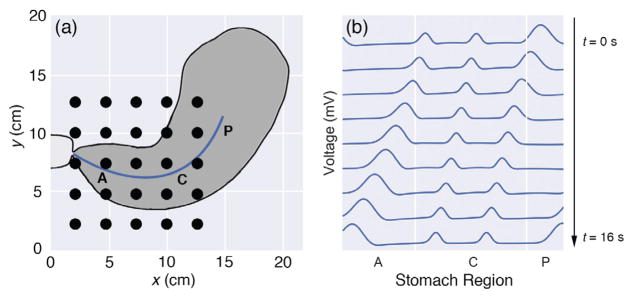
A forward electrophysiology model of stomach was used to validate the wave estimation methodology. For simplicity, we ignored circumferential propagation of the serosal slow-wave and solved the following 1D wave equation using a finite difference approach:
| (10) |
where c(x) is the wave speed that depends on the location on the stomach surface. Gaussian pulses with a width of 35 mm were generated every 20 seconds (0.05 Hz) in the pacemaker region of the stomach, as illustrated in Fig. 3. The pulse width, in addition to the modulations of its speed and amplitude along the organoaxial direction of the stomach, were chosen to be consistent with the most recent description in the literature for healthy subjects [10]. Both the speed and amplitude were highest in the pacemaker region (6.0 mm/s, 0.57 mV), followed by a reduction in the corpus (3.0 mm/s, 0.25 mV), and finally increased in the antrum (5.9 mm/s, 0.52 mV). Mur’s boundary condition was used to ensure the pulses were absorbed into the pylorus rather than being reflected back into the stomach. The Courant-Friedrichs-Lewy condition dictated the temporal step-size to guarantee a converged finite-difference solution. We expanded the 1D serosal solution onto a 2D mesh to match a realistic geometry of the stomach, using anatomical and physiological parameters described previously (see Fig. 3) [32].
Fig. 3.
(a) Plot of stomach anatomy and electrode configuration used for the forward model. The black circles represent electrodes (5 by 5 array). The blue line corresponds to the location of the 1D serosal solution that is expanded to a 2D mesh to match the stomach geometry. The pacemaker (P), corpus (C), and antrum (A) regions of the stomach are labeled. (b) Time snapshots over a 16 second period for the 1D serosal solution are shown. The pulses are generated in the pacemaker (P) region, have a decreased speed and amplitude in the corpus (C) followed by an increase of both in the antrum (A), and eventually terminate in the pylorus.
The cutaneous potentials are essentially a weighted summation of the serosal slow-wave at every time point. Due to the electrical properties of physiological systems, a quasi-static assumption can be made even though the sources are time-varying [33]. By further assuming a volume that is linear, homogenous, and isotropic, the potential φ at a field point (x′, y′, z′) due to a volume current source density Iv (x, y, z) is given by [34]:
| (11) |
where, σ̃ is the conductivity and r is the Euclidean distance between the source point and the field point. The primed variables refer to the points on the abdominal skin while the unprimed variables correspond to those on the stomach surface. We chose a conductivity of 0.125 S/m, which is halfway between the mean conductivities of fat and the human trunk [33], the two primary constituents separating the stomach and skin. The distance r depends on the stomach size and abdominal thickness, which was chosen to be 4 cm. The simulated cutaneous potentials were computed at locations that matched our experimental electrode layout (5 by 5 grid, 2 cm center-to-center electrode distance, 95 mm2 electrode measurement area). Fig. 3 depicts the stomach anatomy and its relation to the electrode configuration used in the forward model.
B. Experimental Protocol
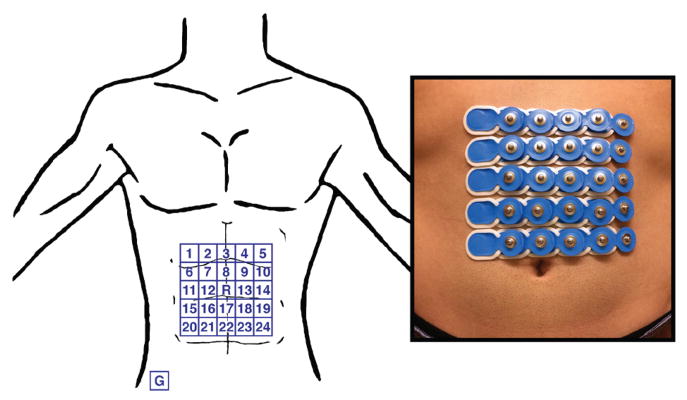
Ethical approval for this work was obtained from the institutional review board at the University of California, San Diego. Eight healthy subjects (5 male, 3 female, age = 26 ± 4 years, BMI = 22 ± 3) without gastrointestinal symptoms or discomfort participated in the study. Subjects were asked to fast overnight prior to the recording. Any excess abdominal hair was removed and the skin was prepped with NuPrep® to reduce electrode contact impedance. Conventional pre-gelled Ag-AgCl electrodes with a 95 mm2 measurement area were placed on the abdominal surface using anatomical landmarks for consistency between subjects. The array was horizontally centered on the subject’s midline and the top row was positioned 5 cm below the xiphoid. The electrodes were arranged in a 5 by 5 square grid with a 2 cm center-to-center electrode distance, as seen in Fig. 4. The middle electrode of the array was assigned as the reference and the ground electrode was placed on the right hip bone. The BrainProducts BrainAmp 32ch EEG amplifier was used to acquire the signals at a sampling rate of 250 Hz. The test meal was a 250 kcal nutrient bar (CLIF Bar®: 5g fat, 45g carbohydrate, 10g protein, 7g fiber) along with 8 ounces of room temperature water. The duration of the recording was 30 minutes pre-prandial and 60 minutes post-prandial. The subjects sat in a comfortable recliner angled at 45 degrees and were asked to limit talking and bodily movement throughout the recording.
Fig. 4.
Depiction of electrode configuration on the abdominal surface. Electrodes are disposable pre-gelled Ag-AgCl electrodes with 95 mm2 measurement area and 2 cm center-to-center spacing. The middle of the array is selected as the reference and the ground electrode is placed on the right hip bone.
C. Data Preprocessing
Prior to wave estimation, the signals recorded from each electrode were down-sampled to 5 Hz and then bidirectionally filtered to avoid phase distortion using a finite impulse response band-pass filter with pass-band frequencies between 0.015 and 0.15 Hz. The surface Laplacian was then calculated at each interior electrode location using (3).
IV. Results
A. Simulated Data
To determine if the surface Laplacian method alters the estimates of direction and speed, we generated signals using a forward model with known parameters, as described in Section III. The signals were subtracted from the center electrode to replicate the use of a reference electrode in the experimental recording. The surface Laplacian was then calculated and the output was used to verify that the wave-estimation algorithm can estimate the correct direction and speed.
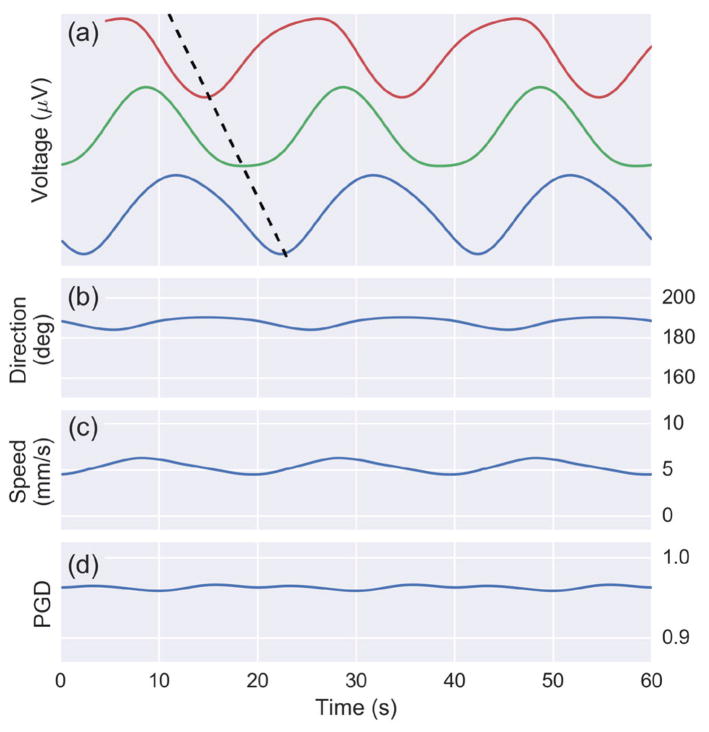
The simulation results are shown in Fig. 5. The voltages from three select simulated electrode sites from the horizontal axis illustrate the wave propagation across the array. The wave estimation algorithm outputs direction, speed, and PGD for every time point in the simulation, which is also displayed in Fig. 5. The average estimated direction (187 degrees) and speed (5.3 mm/s) match the model parameters. PGD is greater than 0.9 for all the time points, indicating phase gradients with near perfect spatial alignment.
Fig. 5.
Results from a 60 second simulation of cutaneous potentials from the forward model on a 5 by 5 array. (a) The voltage from three channels with a dotted black line illustrating wave propagation. (b) Estimate of wave direction (mean: 187 degrees) and (c) speed (mean: 5.3 mm/s). (d) The PGD is above 0.9 throughout the simulation.
B. Experimental Data
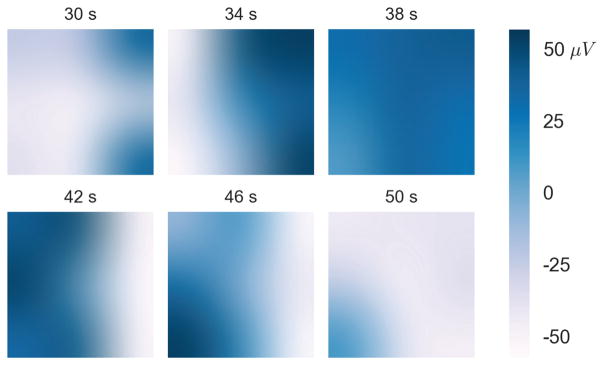
By generating a series of time snapshots, a sample wave can be visualized (Fig. 6). In the time window shown, the wave originated on the right side of the array and propagated slowly to the left at a speed of approximately 4 mm/s. The snapshots display local potentials as calculated by the surface Laplacian, which are spatially interpolated for better visualization. The amplitude of the signal was about 100 μV, as indicated by the color bar.
Fig. 6.
Individual time snapshots of the voltages for a 20 second segment from Subject 1. Voltage is presented in white-blue color (blue representing positive voltage) and time (in seconds) is labeled above each plot. The snapshots are interpolated for visualization purposes. This particular wave took approximately 20 seconds to propagate across the array at about 180 degrees relative to the positive x-axis.
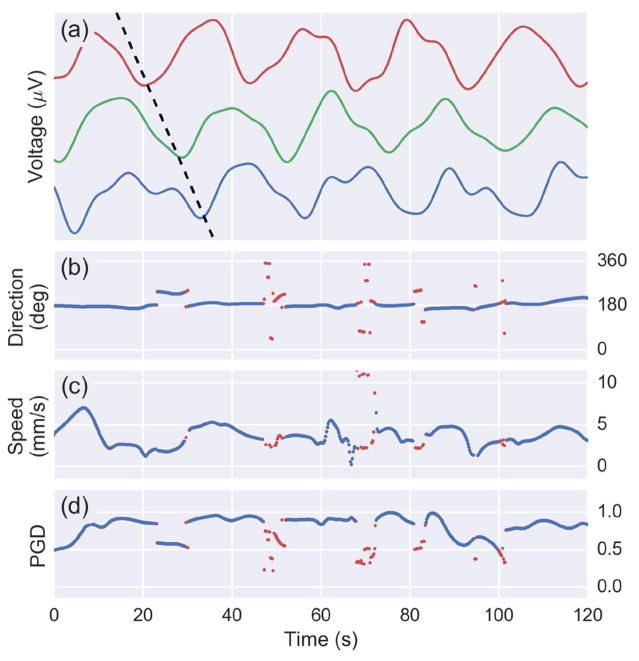
A two-minute segment of the surface Laplacian time series from three electrodes parallel to the wave propagation direction is displayed in Fig. 7. A phase delay between the electrodes that is characteristic of wave propagation indicated by a black dotted line. The output of the wave estimation algorithm is also displayed with a shared time axis. The instantaneous wave direction and speed estimates for sustained waves are displayed in blue, while time points not meeting the sustained wave criteria are red. Sustained waves are defined as having a PGD greater than 0.5 for least 2 consecutive seconds. The waves in this two-minute window have a bearing of 180 degrees relative to the positive x-axis at a speed of about 4 mm/s. Time-points between subsequent slow-waves typically had lower PGD values did not meet the sustained wave criteria, indicated by the dots approximately every 20 seconds in Fig. 7. The data used to visualize the wave propagation in Fig. 6 corresponds the data from the 30–50 second interval in Fig. 7. Note the start and end of a representative slow-wave is observed about 30 and 50 seconds, respectively.
Fig. 7.
(a) Voltages of three channels from a 120 second segment of from Subject 1 data. Wave propagation observed by the phase delay between the channels is depicted by the black diagonal dotted line. A plot is shown the (b) direction, (c) speed, and (d) PGD as computed by the wave estimation algorithm at every time point. A PGD threshold is used to detect sustained waves (above 0.5 for at least 2 seconds). Blue indicates a sustained wave while red is used for points that do not meet the criteria.
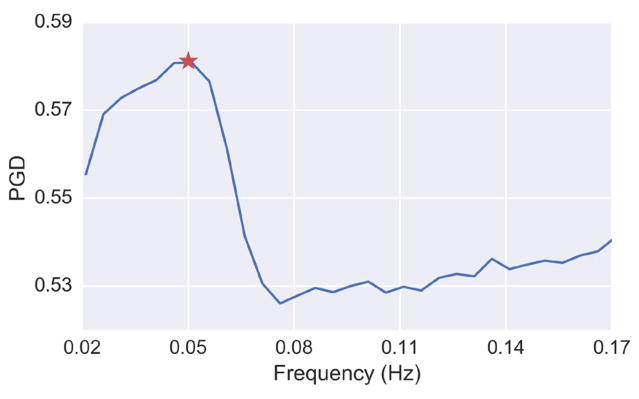
To quantitatively confirm that the gastric electrophysiology was the source for the coordinated spatial activity, we computed the mean PGD as a function of frequency, as shown Fig. 8. The plot was constructed by calculating the average PGD for the dataset after applying various band-pass filters (bandwidth = 0.04 Hz) that swept through a frequency range from 0.02 to 0.17 Hz. The peak PGD value in this case occurred at 0.05 Hz, which corresponds to the normal stomach slow-wave frequency [1].
Fig. 8.
PGD as a function of frequency for the band-pass filtered data (bandwidth 0.04 Hz) from Subject 1. The star indicates the maximum PGD, which is at 0.05 Hz
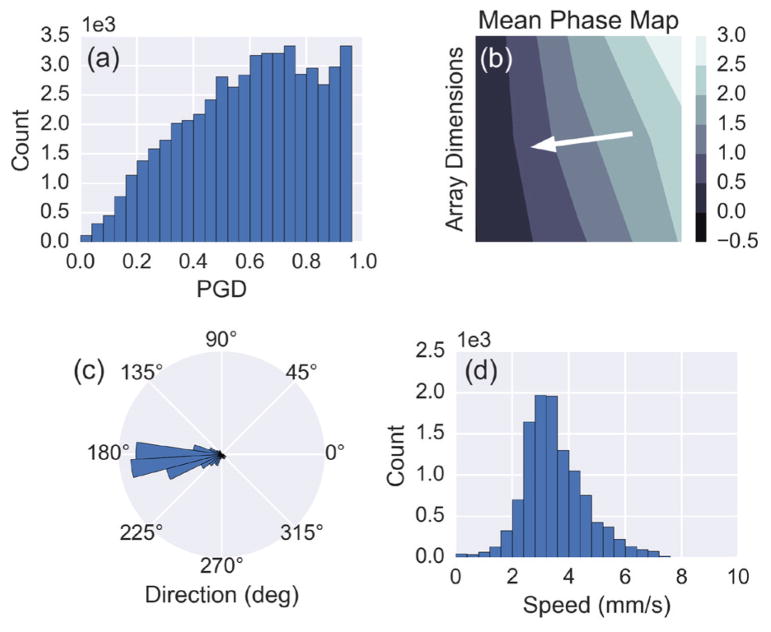
Histograms of wave direction, speed, and PGD reveal overall distributions of the wave propagation parameters for the entire recording (Fig. 9). Only time points of direction and speed during sustained waves were used to generate the histograms. For this particular subject, the waves propagated at 186 ± 27 degrees (subject’s left to right) and 3.2 ± 0.9 mm/s throughout the recording. An average phase map was also computed for sustained waves by spatially unwrapping the phase at each time point and then subtracting the phase value of a reference electrode at that time prior to averaging (Fig. 9b). The white arrow shows the direction of propagation, which is along the negative phase gradient. Fig. 9c and Fig. 9d capture the variability in the wave parameters throughout the recording.
Fig. 9.
(a) A histogram of the PGD values from every time point throughout the recording for Subject 1. (b) The mean phase map, computed using the instantaneous phase for time points meeting the sustained wave criteria. The white arrow indicates the propagation direction of the waves based on the direction of the negative phase gradient. (c) Polar histogram showing the estimated direction of propagation for sustained waves. (d) Histogram of the estimated speed for sustained waves.
Wave propagation was observed in all eight of the subjects. Summary statistics for the various wave parameters are shown in Table I. The mean wave direction and speed for all the subjects were 181 ± 29 degrees and 3.7 ± 0.5 mm/s, respectively. On average, 41% of the time points met the sustained wave criteria. There were no statistically significant differences in slow-wave propagation between male and female subjects. To quantify that the observed wave phenomna were not be generated by noise, we designed the test statistic as the fraction of time that the PGD is greater than 0.5 for 2 seconds or longer. With generation of i.i.d. white Gaussian noise, we used a non-parametric bootstrapping method to develop the distribution of the test statistic under the null hypothesis. Examples of the false positive rate of i.i.d. white Gaussian noise are shown in Fig. 2. With this, we calculated a p-value using the histogram from the bootstrap, which was less than 10−4 for all subjects.
TABLE I.
Wave propagation and EGG parameters across subjects
| Subject | Wave Direction (degrees) | Wave Speed (mm/s) | Sustained Waves (%) | % 2–4 cpm |
|---|---|---|---|---|
| 1 - M | 186 ± 27 | 3.2 ± 0.9 | 53* | 99.4 |
| 2 - F | 156 ± 29 | 4.8 ± 1.6 | 57* | 100 |
| 3 - F | 185 ± 40 | 3.4 ± 1.3 | 43* | 98.9 |
| 4 - M | 173 ± 35 | 3.6 ± 1.4 | 32* | 98.9 |
| 5 - M | 182 ± 48 | 3.8 ± 1.6 | 34* | 96.6 |
| 6 - F | 131 ± 48 | 3.2 ± 1.3 | 33* | 96.6 |
| 7 - M | 224 ± 44 | 4.0 ± 1.3 | 36* | 98.9 |
| 8 - M | 211 ± 35 | 3.9 ± 1.4 | 36* | 100 |
| Average | 181 ± 29 | 3.7 ± 0.5 | 41 ± 10 | 98.7 ± 1.4 |
p-value < 10−4
A commonly reported EGG metric, the percent of 2–4 cycles/minute activity, is also shown in Table I. This value was calculated by generating a spectrogram (4 minute windows, 75% overlap) using the short-time Fourier transform of a single bipolar channel with the strongest gastric signal for each subject, and evaluating the percentage of time the dominant frequency was within the 2–4 cpm range. A value over 70% is indicative of a normal EGG, and all the subjects were above 95%.
V. Discussion
The optimal number and layout of the electrodes remains an open question that deserves further attention. We note that strict application of the Nyquist criterion requires a priori knowledge of the spatial spectra along with the source distributions. Such information is not generally available, in part because knowledge of an adequate number of electrodes for the gastric signal would first require oversampling of the potential distribution to determine the highest spatial frequencies present in the data.
There may be concern that propagation of the potential from the source to the electrode may lead to phase delays that distort the estimated wave parameters. It has been shown that a quasi-static assumption can be made to describe the potential field in the human body [33]. Since the capacitive component of the tissue impedance is negligible in the frequency range of internal bioelectric events, electromagnetic propagation effects can be neglected. This allows us to make true gastric slow-wave speed estimates.
The surface Laplacian is critical in resolving the reference issue and yielding local potentials that can be used to estimate wave propagation. The signal recorded at an electrode position is a spatial average of the active current sources within the volume. The signal depends on several factors, including the volume geometry and conduction properties, as well as the location of the reference electrode. Each current source contributes to the signal based on its orientation, strength and electrical distance to the electrode. Two nearby electrodes record similar signals since they record the average activity in overlapping volumes of tissue. The surface Laplacian effectively reduces the volume that each electrode averages, culminating in improved spatial resolution [24]. The surface Laplacian emphasizes superficial localized sources, while suppressing deep sources along with shallow sources that are widespread and coherent. This property allows us to detect accurate gastric slow-wave propagation from the abdominal surface.
In this paper, we calculated the surface Laplacian using a finite-difference approach. Other surface Laplacian estimation methods have been developed for the brain that fit surface potential maps to spline functions [35] and incorporate more realistic scalp surfaces using MRI [36]. We investigated the use of more sophisticated surface spline Laplacian derivations, but did not observe any significant differences in the wave estimation parameters. Unlike the scalp, our electrode configuration for the stomach is fairly planar and therefore the finite-difference method was chosen for its simplicity.
Although our forward model had simulation parameters such as propagation speed and electrode location chosen to mimic the physiology and experimental recordings, it had several simplifying assumptions. In particular, we applied a 2D approximation of the stomach geometry and did not incorporate the ionic components of smooth muscle cells and the interstitial cells of Cajal. Nonetheless, our findings verify that the wave speed and direction can be accurately estimated, and that the surface Laplacian does not distort the estimation of wave parameters.
It is well established that the normal gastric slow-wave frequency in humans is between 0.04 and 0.06 Hz [1]. Selectively band-pass filtering the signal to narrow 0.04 Hz bands and sweeping across frequencies enabled us to confirm that the peak wave detection occurred at 0.05 Hz. The average PGD was used as a metric to identify when waves were present, since a higher PGD indicates the presence of waves. The peak of the PGD spectrum occurred near 0.05 Hz for all subjects, confirming that the stomach was the source of the detected wave propagation described in this manuscript.
Gastric contractions are initiated and coordinated by slow-wave activity, and the results from this study generally agree with existing descriptions of human gastric motility. MRI studies of contraction wave propagation in healthy stomachs have demonstrated a contractile displacement rate between 1.8–2.7 mm/s [37], [38], [39]. Using invasive serosal electrical measurements, O’Grady et al. observed a mean slow-wave propagation speed of 8.0 mm/s in the pacemaker region, a drop to 3.0 mm/s in the corpus, followed by an increase to 5.7 mm/s in the antrum for normal subjects [10]. The average speed recorded in our study was 3.7 ± 0.5 mm/s. The variability for each subject can be seen Table I, with the distribution for a representative recording shown in Fig. 9d. These results suggest that the HR-EGG reflects slow-wave activity in both the corpus and antrum, which is where most spatial abnormalities have been detected during invasive recordings [12], [13]. Higher gastric slow-wave speeds of 7.4 mm/s were reported in a recent MGG study for normal subjects [20]. Further investigations are required to resolve the differences between these modalities.
An important consideration is that the stomach is a three-dimensional organ, and its angle of elevation relative to the plane of the electrode array may skew the results. Also, no obese (BMI > 30) subjects participated in this study. It is possible that a significant amount of fat tissue separating the stomach and electrodes will present a challenge in detecting wave propagation. A future study that includes imaging and/or modeling is required to determine how an individual’s stomach and torso anatomy affects the speed estimated from electrodes placed on the abdominal surface.
The slow-wave direction estimates in our study were consistent with the expected stomach orientation. Although there is a considerable amount of inter-subject variability, the stomach typically lies in the left superior quadrant, terminates across the median line and can descend below the plane of the umbilicus [40]. The average gastric slow-wave direction for our subjects was 181 ± 29 degrees, consistent with the aforementioned anatomical description. Nonetheless, a study with stomach localization relative to the electrodes can more quantitatively confirm that our direction estimates align with the principal stomach axis in normal subjects.
The slow-wave propagation was detected in both the fasting and post-prandial states for all the subjects in our study. There were no significant differences in the speed and direction of the waves in the two states. We chose a 250 kcal nutrient bar along with eight ounces of water since that is similar to the standardized meal given with tests of gastric motor function. Further investigation is necessary to determine the consequence of test meals with different volume and composition on wave propagation parameters.
Traditional EGG spectral analysis relies on using large windows of the recording (typically 4 minutes), due to the slow nature of the signal. This can be limiting, since gastric electrophysiological abnormalities may occur at a shorter time scale. Estimating the wave properties at every time sample, as shown in Fig. 7, allows for the detection of instantaneous episodes of abnormalities. Moreover, the methodology described in this manuscript is fully automated and not susceptible to human bias. The summary statistics for wave direction, wave speed and PGD in Table I demonstrate that the HR-EGG can be used to estimate the gastric slow-waves properties for normal subjects. Statistical signal processing, including state space models, can be used in the future to describe the dynamics of wave propagation across time.
There appears to be a trend towards portable, noninvasive systems that quantify gastrointestinal function, such as technology to extract gastric motility information from finger photoplethysmographic signals [41] and ingestible wireless motility capsules that measures whole gut transit times [42]. Synergistic with this theme, there have been recent developments in demonstrating thin, flexible, and stretchable skin-mounted electronics that can measure a multitude of electrophysiological signals [43], as well as developments in improving reliability, latency, and cost associated with the microfabrication procedures needed to build such systems at scale [44]. The maturation of these technologies, in parallel with developments in analytical methods such as the HR-EGG, will enable improved unobtrusive quantification of the state of the gastrointestinal system in health and disease.
VI. Conclusion
In this manuscript, we outline a methodology for noninvasive estimation of gastric slow-wave propagation called the HR-EGG. This approach builds on recent findings demonstrating that gastric slow-wave spatial abnormalities can go undetected by traditional single channel recordings. Our proposed technique does not depend on the placement of the reference electrode and is fully automated. For the first time, to our knowledge, we are able to generate estimates of slow-wave propagation direction and speed at each time point using surface electrodes. Improved spatially detailed analysis of propagating gastric myoelectrical events will facilitate better understanding of the pathophysiology of gastric dysrhythmias among patients with motility disorders. This in turn will create opportunity for interventions to reduce gastric dysrhythmic activity and improve symptoms.
Acknowledgments
This work was supported by the Ruth L. Kirschstein National Research Service Award NIH/NHLBI T32 HL 105373.
Contributor Information
Armen A. Gharibans, Department of Bioengineering, University of San Diego, La Jolla, California.
Sanggyun Kim, Department of Bioengineering, University of San Diego, La Jolla, California.
David C. Kunkel, Department of Medicine, University of California, San Diego, La Jolla, California
Todd P. Coleman, Department of Bioengineering, University of San Diego, La Jolla, California.
References
- 1.Parkman HP, et al. Electrogastrography: a document prepared by the gastric section of the American motility society clinical GI motility testing task force. Neurogastroenterology & Motility. 2003;15(2):89–102. doi: 10.1046/j.1365-2982.2003.00396.x. [DOI] [PubMed] [Google Scholar]
- 2.Geldof H, et al. Electrogastrographic study of gastric myoelectrical activity in patients with unexplained nausea and vomiting. Gut. 1986;27(7):799–808. doi: 10.1136/gut.27.7.799. [DOI] [PMC free article] [PubMed] [Google Scholar]
- 3.Pfaffenbach B, et al. Gastric dysrhythmias and delayed gastric emptying in patients with functional dyspepsia. Digestive Diseases and Sciences. 1997;42(10):2094–2099. doi: 10.1023/a:1018826719628. [DOI] [PubMed] [Google Scholar]
- 4.Riezzo G, et al. Gastric electrical activity and gastrointestinal hormones in dyspeptic patients. Digestion. 2001;63(1):20–29. doi: 10.1159/000051868. [DOI] [PubMed] [Google Scholar]
- 5.Brzana RJ, et al. Gastric myoelectrical activity in patients with gastric outlet obstruction and idiopathic gastroparesis. The American Journal of Gastroenterology. 1998;93(10):1803–1809. doi: 10.1111/j.1572-0241.1998.00524.x. [DOI] [PubMed] [Google Scholar]
- 6.Hu S, et al. Motion sickness severity and physiological correlates during repeated exposures to a rotating optokinetic drum. Aviation, Space, and Environmental Medicine. 1991 [PubMed] [Google Scholar]
- 7.Koch KL, et al. Gastric emptying and gastric myoelectrical activity in patients with diabetic gastroparesis: effect of long-term domperidone treatment. The American Journal of Gastroenterology. 1989;84(9):1069–1075. [PubMed] [Google Scholar]
- 8.Abell T, et al. Gastric electromechanical function and gastric emptying in diabetic gastroparesis. European Journal of Gastroenterology and Hepatology. 1991;3(2):163–167. [Google Scholar]
- 9.Verhagen M, et al. Pitfalls in the analysis of electrogastrographic recordings. Gastroenterology. 1999;117(2):453–460. doi: 10.1053/gast.1999.0029900453. [DOI] [PubMed] [Google Scholar]
- 10.O’Grady G, et al. Origin and propagation of human gastric slow-wave activity defined by high-resolution mapping. American Journal of Physiology-Gastrointestinal and Liver Physiology. 2010;299(3):G585–G592. doi: 10.1152/ajpgi.00125.2010. [DOI] [PMC free article] [PubMed] [Google Scholar]
- 11.Du P, et al. High-resolution mapping of in vivo gastrointestinal slow wave activity using flexible printed circuit board electrodes: Methodology and validation. Annals of Biomedical Engineering. 2009;37(4):839–846. doi: 10.1007/s10439-009-9654-9. [DOI] [PMC free article] [PubMed] [Google Scholar]
- 12.O’Grady G, et al. Abnormal initiation and conduction of slow-wave activity in gastroparesis, defined by high-resolution electrical mapping. Gastroenterology. 2012;143(3):589–598. doi: 10.1053/j.gastro.2012.05.036. [DOI] [PMC free article] [PubMed] [Google Scholar]
- 13.Angeli TR, et al. Loss of interstitial cells of cajal and patterns of gastric dysrhythmia in patients with chronic unexplained nausea and vomiting. Gastroenterology. 2015 doi: 10.1053/j.gastro.2015.04.003. [DOI] [PMC free article] [PubMed] [Google Scholar]
- 14.Buist M, et al. Multiscale modelling of human gastric electric activity: can the electrogastrogram detect functional electrical uncoupling? Experimental Physiology. 2006;91(2):383–390. doi: 10.1113/expphysiol.2005.031021. [DOI] [PubMed] [Google Scholar]
- 15.Chen JDZ, et al. Detection of gastric slow wave propagation from the cutaneous electrogastrogram. American Journal of Physiology-Gastrointestinal and Liver Physiology. 1999;277(2):G424–G430. doi: 10.1152/ajpgi.1999.277.2.G424. [DOI] [PubMed] [Google Scholar]
- 16.Wang ZS, et al. Detection of gastric slow wave uncoupling from multi-channel electrogastrogram: validations and applications. Neurogastroenterology & Motility. 2003;15(5):457–465. doi: 10.1046/j.1365-2982.2003.00430.x. [DOI] [PubMed] [Google Scholar]
- 17.Burdan F, et al. Anatomical classification of the shape and topography of the stomach. Surgical and Radiologic Anatomy. 2012;34(2):171–178. doi: 10.1007/s00276-011-0893-8. [DOI] [PMC free article] [PubMed] [Google Scholar]
- 18.Cheng LK, et al. Anatomically realistic multiscale models of normal and abnormal gastrointestinal electrical activity. World Journal of Gastroenterology. 2007;13(9):1378. doi: 10.3748/wjg.v13.i9.1378. [DOI] [PMC free article] [PubMed] [Google Scholar]
- 19.Bradshaw LA, et al. Surface current density mapping for identification of gastric slow wave propagation. IEEE Transaction on Biomedical Engineering. 2009;56(8):2131–2139. doi: 10.1109/TBME.2009.2021576. [DOI] [PMC free article] [PubMed] [Google Scholar]
- 20.Bradshaw LA, et al. Diabetic gastroparesis alters the biomagnetic signature of the gastric slow wave. Neurogastroenterology & Motility. 2016 doi: 10.1111/nmo.12780. [DOI] [PMC free article] [PubMed] [Google Scholar]
- 21.Lindberg G, et al. 24-hour ambulatory electrogastrography in healthy volunteers. Scandinavian Journal of Gastroenterology. 1996;31(7):658–664. doi: 10.3109/00365529609009146. [DOI] [PubMed] [Google Scholar]
- 22.Nunez PL, Srinivasan R. Electric Fields of the Brain: The Neurophysics of EEG. Oxford University Press; USA: 2006. [Google Scholar]
- 23.Bendat JS, Piersol AG. Random Data: Analysis and Measurement Procedures. John Wiley & Sons; 2011. p. 729. [Google Scholar]
- 24.Nunez PL, Pilgreen KL. The spline-Laplacian in clinical neurophysiology: a method to improve EEG spatial resolution. Journal of Clinical Neurophysiology. 1991;8(4):397–413. [PubMed] [Google Scholar]
- 25.He B, Cohen RJ. Body surface Laplacian ECG mapping. IEEE Transaction on Biomedical Engineering. 1992;39(11):1179–1191. doi: 10.1109/10.168684. [DOI] [PubMed] [Google Scholar]
- 26.Garcia-Casado J, et al. Enhancement of non-invasive recording of electroenterogram by means of a flexible array of concentric ring electrodes. Annals of Biomedical Engineering. 2013;42(3):651–660. doi: 10.1007/s10439-013-0935-y. [DOI] [PubMed] [Google Scholar]
- 27.Hjorth B. An on-line transformation of EEG scalp potentials into orthogonal source derivations. Electroencephalography and Clinical Neurophysiology. 1975;39(5):526–530. doi: 10.1016/0013-4694(75)90056-5. [DOI] [PubMed] [Google Scholar]
- 28.Hjorth B. Source derivation simplifies topographical EEG interpretation. American Journal of EEG Technology. 1980;20(3):121–132. [Google Scholar]
- 29.Du P, et al. A multiscale model of the electrophysiological basis of the human electrogastrogram. Biophysical Journal. 2010;99(9):2784–2792. doi: 10.1016/j.bpj.2010.08.067. [DOI] [PMC free article] [PubMed] [Google Scholar]
- 30.Fleet DJ, Jepson AD. Computation of component image velocity from local phase information. International Journal of Computer Vision. 1990;5(1):77–104. [Google Scholar]
- 31.Rubino D, et al. Propagating waves mediate information transfer in the motor cortex. Nature Neuroscience. 2006;9(12):1549–1557. doi: 10.1038/nn1802. [DOI] [PubMed] [Google Scholar]
- 32.Pal A, et al. Gastric flow and mixing studied using computer simulation. Proceedings of the Royal Society of London B: Biological Sciences. 2004;271(1557):2587–2594. doi: 10.1098/rspb.2004.2886. [DOI] [PMC free article] [PubMed] [Google Scholar]
- 33.Plonsey R. Bioelectric Phenomena. Wiley Online Library; 1969. [Google Scholar]
- 34.Liang JIE, Chen JDZ. What can be measured from surface electrogastrography (computer simulations) Digestive Diseases and Sciences. 1997;42(7):1331–1343. doi: 10.1023/a:1018869300296. [DOI] [PubMed] [Google Scholar]
- 35.Perrin F, et al. Scalp current density mapping: value and estimation from potential data. IEEE Transaction on Biomedical Engineering. 1987;4:283–288. doi: 10.1109/tbme.1987.326089. [DOI] [PubMed] [Google Scholar]
- 36.Babiloni F, et al. Spline Laplacian estimate of EEG potentials over a realistic magnetic resonance-constructed scalp surface model. Electroencephalography and Clinical Neurophysiology. 1996;98(4):363–373. doi: 10.1016/0013-4694(96)00284-2. [DOI] [PubMed] [Google Scholar]
- 37.Kwiatek MA, et al. Quantification of distal antral contractile motility in healthy human stomach with magnetic resonance imaging. Journal of Magnetic Resonance Imaging. 2006;24(5):1101–1109. doi: 10.1002/jmri.20738. [DOI] [PubMed] [Google Scholar]
- 38.Schulze K. Imaging and modelling of digestion in the stomach and the duodenum. Neurogastroenterology & Motility. 2006;18(3):172–183. doi: 10.1111/j.1365-2982.2006.00759.x. [DOI] [PubMed] [Google Scholar]
- 39.Marciani L. Assessment of gastrointestinal motor functions by MRI: a comprehensive review. Neurogastroenterology & Motility. 2011;23(5):399–407. doi: 10.1111/j.1365-2982.2011.01670.x. [DOI] [PubMed] [Google Scholar]
- 40.Netter FH. Atlas of Human Anatomy. Elsevier Health Sciences; 2010. [Google Scholar]
- 41.Yacin SM, et al. On non-invasive measurement of gastric motility from finger photoplethysmographic signal. Annals of Biomedical Engineering. 2010;38(12):3744–3755. doi: 10.1007/s10439-010-0113-4. [DOI] [PubMed] [Google Scholar]
- 42.Kuo B, et al. Comparison of gastric emptying of a nondigestible capsule to a radio-labelled meal in healthy and gastroparetic subjects. Alimentary Pharmacology & Therapeutics. 2008;27(2):186–196. doi: 10.1111/j.1365-2036.2007.03564.x. [DOI] [PubMed] [Google Scholar]
- 43.Kim D, et al. Epidermal electronics. Science. 2011;333(6044):838–843. doi: 10.1126/science.1206157. [DOI] [PubMed] [Google Scholar]
- 44.Kang DY, et al. Scalable microfabrication procedures for adhesive-integrated flexible and stretchable electronic sensors. Sensors. 2015;15(9):23 459–23 476. doi: 10.3390/s150923459. [DOI] [PMC free article] [PubMed] [Google Scholar]


