Abstract
While cancer immunotherapy can produce dramatic responses, only a minority of patients respond to treatment. Reliable response biomarkers are needed to identify responders and conventional imaging modalities have not proved adequate. Here we provide a preclinical proof of concept for the use of granzyme B, a downstream effector of tumoral cytotoxic T cells, as a early biomarker for tumors responding to immunotherapy. We designed novel PET imaging probes for the murine and human granzyme B isoforms that specifically and quantitatively bind granzyme B. Immunotherapy-treated mice were imaged prior to therapy-induced tumor volume reduction. Imaging distinguished treated responders from non-responders with excellent predictive ability. To assess the clinical value of a granzyme B imaging paradigm, biopsy specimens from melanoma patients on checkpoint inhibitor therapy were analyzed. A marked differential in granzyme B expression was observed between treated responders and non-responders. Additionally, our human probe was able to specifically detect granzyme B expression in human samples, providing a clear candidate for clinical applcation. Overall, our results suggest granzyme B PET imaging can serve as a quantitatively useful predictive biomarker for efficacious responses to cancer immunotherapy.
Keywords: Granzyme B, PET, Cancer Immunotherapy, Predictive Biomarker
Introduction
Cancer immunotherapy, and PD-1 blockade in particular, has represented a significant advance in cancer therapy. While responses to anti-PD-1 monotherapy and combination regimens, including anti-PD-1 paired with anti-CTLA-4, have generated well-warranted enthusiasm for the future of cancer immunotherapy, several limitations have yet to be addressed. Of particular importance is predicting which patients will benefit from this novel approach. Efficacies vary widely across tumor and treatment type, with objective response rates ranging between 5–60%(1,2). Immunotherapy is also often associated with severe immune-related adverse events, including hepatitis, colitis, and even death, with grade III/IV adverse events occurring in up to 50% of patients on PD-1/CTLA-4 inhibitor combination regimens(3,4). Early differentiation of treated responders from non-responders would help to triage non-responding patients away from ineffective therapies, reducing unnecessary side effects and allowing the opportunity for alternative therapeutic strategies.
Despite the clear benefit of early identification, it remains highly difficult to differentiate treatment responders from non-responders using standard imaging techniques(5). PET-CT with 18F-fluorodeoxyglucose (18F-FDG), an imaging method widely used to assess response to traditional therapy, is unfortunately limited in cancer immunotherapy. This is due in part to a metabolically active tumoral immune cell infiltrate, which can cause expansion in tumor volume, increased glucose uptake, and even the development of new detectable lesions, features indistinguishable from tumor progression(6,7). In addition to imaging, emphasis has been placed on identifying non-imaging biomarkers for both pre-treatment stratification and response assessment. Several of these strategies enrich for responding patients, but are insufficient for individual response prediction. For example, tumors with greater than 50% positive staining for PD-L1 have a 30% response rate, compared to an 18% response rate in patients with >1% positive staining, in advanced non-small cell lung cancer treated with pembrolizumab(8). These biopsy-dependent measures face several limitations, as biopsy is typically obtained only once prior to therapy, and the collected tissue from an 18-gauge percutaneous biopsy (.011 cm3) represents only approximately 0.1% of a typical lesion (10 cm3). The small sampling size is unlikely to accurately represent the markedly heterogeneous tumoral immune infiltrate within a single tumor focus or across metastatic sites. Because of the potential limitations of biopsy, alternative imaging approaches monitoring CD8+ and CD3+ T cell infiltration and PD-1/PD-L1 expression have been explored pre-clinically, with mixed efficacy based on tumor model and therapy utilized(9–11). Factors that may hinder the successful correlation of cytotoxic T cell infiltration with therapeutic efficacy include a tolerogenic tumor microenvironment that inhibits the activity of cytotoxic T cells, as well as phenomena such as T cell exhaustion or anergy that induce immunotolerance(12,13). In these cases, T cells are present within the tumor, yet remain inactive, allowing for continued tumor progression.
By focusing on active rather than total tumor immune infiltrate, an imaging biomarker of cytotoxic T cell activity may be more valuable for predicting response to cancer immunotherapy. Granzyme B is a serine-protease released by CD8+ T cells and natural killer cells during the cellular immune response, and represents one of the two dominant mechanisms by which T cells mediate cancer cell death(14,15). We set out to design a PET imaging agent capable of detecting the release of this enzyme by actively engaged immune cells. Such an imaging agent would allow for repeated noninvasive and systemic interrogation of the tumoral response to cancer immunotherapy and provide insight into a major biochemical mechanism responsible for immune-mediated cell death. We began with development granzyme B specific PET imaging agent (GZP) designed from the optimal cleavage sequence for murine granzyme B with further modifications to induce irreversible binding and allow for labeling with a suitable PET-detectible radiometal(16). We demonstrated that GZP has high affinity and specificity for granzyme B, and showed in a CT26 syngeneic cancer model that GZP uptake correlates closely with tumoral granzyme B expression. We then sought to demonstrate the utility of GZP as a predictive imaging biomarker for successful immunotherapy. PET imaging was able to differentiate with excellent accuracy between treated responders and treated non-responders prior to tumor volume divergence. We extended our findings into humans by developing a human-specific granzyme B agent and interrogated it in a cohort of biopsy specimens obtained from patients on checkpoint inhibitor therapy. Granzyme B expression from these on-treatment specimens was markedly different between treated responders and treated non-responders, and our humanized probe was able to detect these changes in expression with high correlation to anti-granzyme B antibody staining in the same samples. These results suggest that granzyme B PET imaging represents a biomarker of active cytotoxic immune response, with valuable predictive capability in immune-oncology.
Materials and Methods
Syngeneic Colon Cancer Model of Immunotherapy
Mice were housed and maintained by the Center for Comparative Medicine following animal protocols approved by the Massachusetts General Hospital Institutional Animal Care and Use Committee. CT26 murine colon carcinoma cells were acquired from ATCC (Manassas, VA) and cultured in RPMI. Monthly mycoplasma testing was performed by PCR screening and cells were discarded after 15 passages. All cell-based experiments were done with cells acquired within 6 months from ATCC during 2016 in order to ensure fidelity of the cell line identity. 1 × 10⁶ CT26 cells were prepared in a 1:1 (v:v) ratio in Matrigel (Corning, Tewksbury, MA) and injected subcutaneously into the right shoulder of Balb/C mice. Anti-mouse PD-1 (clone RMP1–14) and anti-mouse CTLA-4 (clone 9D9) were obtained from Bio X Cell (West Lebanon, NH). All mice were treated by intraperitoneal injection of saline (vehicle), 200 μg anti-PD1 (monotherapy), or both 200 μg anti-PD1 and 100 μg anti-CTLA-4 (combination therapy) on days 3, 6, and 9 following CT26 tumor inoculation(17).
Ex vivo Tumor Biochemical Analysis
For ex vivo analysis, mice were sacrificed on the specified day and the entire tumor excised and either lysed for Western blot analysis or fixed in 10% formalin and paraffin embedded for immunohistochemical or immunofluorescence staining. For Western blot analyses, anti-CD8 (Ab108292, Abcam, Cambridge, MA), anti-CD3 (sc-20047, Santa Cruz Biotechnology, Dallas, TX, anti-CD4 (sc-19643, Santa Cruz), anti-FoxP3 (12653s, Cell Signaling Technologies, Danvers, MA), anti-pSTAT (700349, ThermoFisher, Waltham, MA), anti-Granzyme B (4275s, Cell Signaling Technologies) and anti-β-actin (Cell Signaling Technologies 4970S) were used at the manufacturer’s recommended concentration. For immunohistochemistry analysis, granzyme B (Ab4059, Abcam) and CD3 (Ab56090, Abcam) antibodies were detected using biotinylated goat-anti-rabbit antibodies with the Signal Stain Boost IHC Detection Reagent (Abcam). For immunofluorescence staining, granzyme B was detected with Ab4059 and AlexaFluor 488 goat anti-rabbit secondary (Life Technologies); CD3 was detected with anti-CD3 clone PC3/188A (Santa Cruz) and AlexaFluor 594 goat anti-mouse secondary (Life Technologies).
NOTA-GZP Synthesis and 68Ga Radiolabelling
NOTA–β-Ala–Gly–Gly–Ile–Glu–Phe–Asp–CHO (NOTA-GZP) and biotin–β-Ala–Gly–Gly–Ile–Glu–Pro–Asp–CHO (hGZP) were synthesized using standard FMOC chemistry(18). Chemical purity was analyzed by HPLC and mass spectroscopy. 68Ga was obtained from a 68Ge/68Ga generator (iThemba Labs, South Africa) eluted with 0.6N HCl. Radiolabeling proceeded as previously described with minor modifications(19). Briefly, the eluent was equilibrated to pH 3.5–4.0 with 2M HEPES followed by addition of 100 μg NOTA-GZP. The labeling reaction proceeded at room temperature for 10 minutes. The reaction product was loaded on a reverse-phase C18 Sep-Pak mini cartridge and eluted with 200 μl of 70% ethanol. The final formulation was adjusted to 10% ethanol in saline. The chemical and radiochemical purity of 68Ga-NOTA-GZP was measured through radio thin-layer chromatography.
NOTA-GZP Affinity and Specificity Determination
Pro-granzyme B (R&D Systems) was activated to granzyme B using cathepsin B (R&D systems) following the manufacturer’s protocol. Enzyme activity was assessed by cleavage of BOC-Ala-Ala-Asp-SBZL (Sigma) and reaction with DTNB (Sigma) with absorbance measurements at 405 nm (NanoDrop 2000 Spectrophotometer, Thermo Scientific). Serial dilutions of non-radioactive gallium-labeled NOTA-GZP were used to inhibit granzyme B by incubation at 37°C for 30 min prior to addition of substrate. Additionally, 68Ga-NOTA-GZP was incubated with the activated forms of granzyme B, granzyme A (R&D Systems), granzyme H (R&D Systems), granzyme K (Enzo Life Sciences) and pro-granzyme B to assess the specificity of the peptide. After a 30 min incubation at 37°C, enzymes were purified by size exclusion chromatography and bound radioactivity assessed by gamma counter (Wizard 2480, Perkin Elmer).
In vivo PET imaging and tumor growth curve analyses
For all imaging studies Balb/C mice were injected with CT26 cells and treated as described previously. On either day 12 or 14, mice were injected intravenously with ~37 MBq of 68Ga-NOTA-GZP and imaged one hour following injection. Images were acquired on a rodent Triumph PET/CT (GE Healthcare, Wilmington, MA). PET images were obtained for 15 minutes in a single bed position, followed by CT acquisition. Images were constructed using 3D-MLEM (4 iterations, 20 subsets) and corrected for scatter and randoms. The mean standard uptake value (SUVmean) for each tumor was calculated in a 3D region of interest manually drawn around the tumor using CT-anatomic correlation. A region of interest was also drawn around the left ventricle of the heart to calculate blood pool activity as a measure of non-specific signal. Images were post-processed using VivoQuant software (InviCRO, Boston, MA). Dynamic PET Imaging data was acquired over a 2 h period, and time activity curves were generated using the same region of interest method as for static image acquisition. A non-compartmental PATLAK analysis was performed based on the assumed non-reversible binding of the peptide to granzyme B. For ex vivo correlation studies, mice were sacrificed immediately following imaging. For survival and response prediction, mice were returned to normal housing following radioactive decay. Tumor volumes were measured by caliper every 2 days beginning on day 10 until the end of the study or when volumes reached a size greater than 1500 mm3.
Immunohistochemical analyses of human melanoma specimens
All specimens were acquired from patients following informed consent and according to a Massachusetts General Hospital institutional review board-approved clinical protocol. Immunohistochemistry was performed on formalin-fixed paraffin embedded sections following standard antigen retrieval in citrate buffer. Granzyme B expression was detected with either an anti-Granzyme B antibody (ab5049, Abcam) or a biotinylated and humanized version of GZP (Biotin-βAla-GGG-IEPD-CHO) (hGZP). Bound antibody was detected with either HRP-conjugated goat anti-rabbit antibody and reacted with DAB substrate for IHC staining or AlexaFluor 488 goat anti-rabbit or AlexaFluor 594 goat anti-rabbit antibodies (Life Technologies) for immunofluorescent visualization. Bound peptide was detected with either HRP-conjugated streptavidin (Abcam) followed by reaction with DAB substrate or Oregon green conjugated-neutravidin (Life Technologies). Patient samples were grouped as either immunotherapy treated or non-treated, and treated specimens were further distinguished as responders or non-responders using modified RECIST criteria. Fluorescence quantification was performed using imageJ software (National Institutes of Health, Bethesda, MD).
Statistical Analysis
Statistical analysis was performed using GraphPad Prism Version 6 software. For all comparisons between treated and untreated samples, an unpaired Student’s t test was utilized. A non-linear regression was used for competitive binding analysis. One-way ANOVA was utilized to assess the specificity of the probe for various granzyme enzymes and to compare mean tumor to blood ratio of the monotherapy, combination therapy and vehicle treatment arms, and tumor volumes of the three groups of mice on days 12 and 18. Pearson’s correlation test was performed to correlate total tumoral granzyme B expression determined by Western blot to tumoral TBR.
Results
Western Blot Analysis of Immune Response in Murine Cancer Immunotherapy Model
To evaluate candidate biomarkers of cancer immunotherapy response, we utilized CT26 syngeneic tumors in immunocompetent Balb/C mice, a model characterized by its moderate response to anti-PD-1 and anti-CTLA-4 therapies(17). Mice were treated with anti-PD-1 and anti-CTLA-4 therapy or vehicle and tumors excised and evaluated by Western blot on days 10, 12 or 14 post tumor-inoculation. Neither CD8 nor CD3 expression levels differed significantly between treated and untreated mice at any time point analyzed (Fig. 1A–C, P = 0.07–0.64 CD8, P = 0.17–1 CD3). In contrast, there was a marked divergence between treated and untreated granzyme B expression levels. While granzyme B levels in treated and untreated mice were equally low on day 10, they sharply increased in treated tumors across days 12 and 14, with significantly higher level of granzyme B in treated tumors (granzyme B:β-actin = 20.4±4.1) in comparison to untreated tumors (4.7±1.6)(P = 0.01) on day 14 (Fig 1D). This was in stark contrast to CD8, where the day 10 expression ratio between treated and untreated tumors was 0.52±0.3, with no significant change occurring over subsequent time points (Fig. 1E). Individual tumor granzyme B expression analysis among treated tumors revealed separation into two distinct groups: one group demonstrated low-level expression similar to untreated tumors, the other group had higher expression than both the low-level treated and vehicle treated tumors (Fig 1C). Furthermore, granzyme B expression among treated tumors was independent of CD8 expression, as demonstrated by the dichotomous split among individual treated mice analyzed for granzyme B versus CD8 expression (Fig 1F).
Figure 1. Ex vivo Immunoblot Analysis of Immunotherapy Treated Tumors.
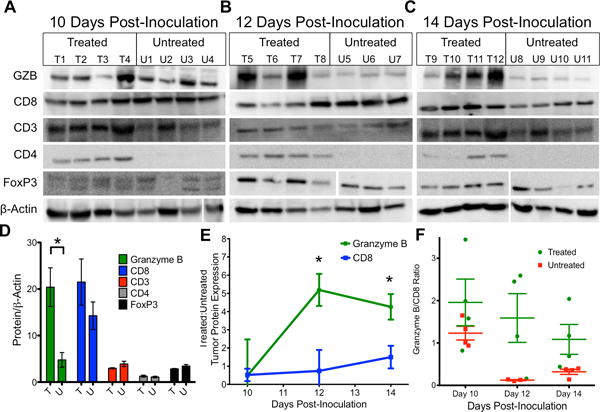
Western blot analysis of combination therapy and vehicle treated tumors on A) 10, B) 12 and C) 14 days post-inoculation. D) Quantification of protein expression on day 14 in treated (T) and untreated tumors (U). Bars represent the mean of 4 replicates ± SEM E) Ratio of treated to untreated expression of granzyme B and CD8 over time. Each point represents the mean of 3 or 4 mice with error bars representing SEM. * P < 0.05 by unpaired t test, significance is relative to expression. F) Ratio of granzyme B to CD8 for mice, each square represents a ratio for an individual mouse, with the mean ± SEM represented by bars.
As intra-treatment biopsy is used occasionally in clinical trials to assess change in protein expression, we questioned whether focused tumor sampling would be adequate to assess granzyme B expression. To visualize the spatial heterogeneity of granzyme B expression, a treated tumor was divided by a single longitudinal and two axial excisions into six equal mass portions. The portions were lysed and subjected to Western blot, which revealed significantly different levels of granzyme B expression indicating a high level of heterogeneity (Supp. Fig S1). Taken together with the time course analysis of tumor infiltrate protein expression, it was hypothesized that granzyme B represented an attractive target for imaging agent development.
Immunofluorescent and Immunohistochemical Staining to Assess Granzyme B Localization in Tumors Following Immunotherapy
Prior to T cell activation, granzyme B is contained within cytotoxic granules, and following activation is secreted into the immune synapse. A fraction of exocytosed granzyme B enters the target cell, with the remainder being released into the extracellular space(20). Although Western blot confirmed that granzyme B expression increased in treated tumors, it remained unclear if the increase in tumoral granzyme B reflected an increase within cytotoxic granules only, an increase in released granzyme B, or both. We sought a more detailed examination of granzyme B spatial localization with immunofluorescence to better inform imaging agent development. Tumor samples from treated and untreated mice were analyzed by immunofluorescence for granzyme B and CD3 to assess whether granzyme B was sequestered within T cells or secreted. Visualization revealed two distinct patterns of granzyme B accumulation. In the first pattern, seen primarily within untreated tumors, a low intensity and small surface area granzyme B staining co-localized in regions of CD3 staining within both treated and untreated tumors, suggestive of basal granzyme B contained within granulocytes (Fig 2A–B). A second pattern of granzyme B staining, seen mostly in treated tumors, resulted in much larger and more intense areas of staining that often did not co-localize with CD3, suggestive of intense granzyme B production and release into the extracellular space (Fig. 2C). We similarly demonstrated these distinct spatial patterns with immunohistochemistry in an independent tumor set (Supp. Fig 2). The larger intense granzyme B positive regions were present at a significantly higher frequency (P < 0.001) in treated tumors than in untreated tumors (Fig. 2D, Supp. Fig. 3). These results strongly suggested that higher granzyme B expression in treated tumors was due to its release from activated cytotoxic T cells and a significant fraction of the enzyme was extracellular, and thus accessible to binding by an imaging agent.
Figure 2. Immunohistochemical Analysis of Granzyme B Localization.
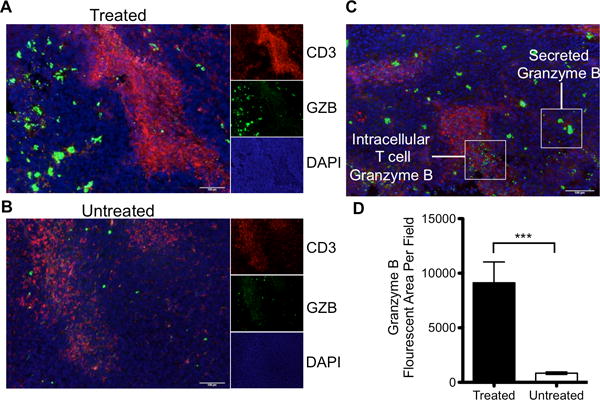
Immunofluorescent staining of CD3, granzyme B and DAPI merged to show spatial relationship and differential staining of granzyme B in A) treated and B) untreated tumors. Small windows represent the individual channels, with the large window a composite overlay of all three. C) Representative image demonstrating differential staining of granzyme B found in T cells versus secreted enzyme D) Quantification of granzyme B fluorescence in treated and untreated tumors (p<0.0001)
Synthesis and In Vitro Characterization of a Novel Granzyme B PET Imaging Probe
In order to assess the feasibility of imaging granzyme B to predict immunotherapy response, we developed a granzyme B specific imaging agent. The tetrapeptide Ile-Glu-Phe-Asp has been well characterized as the preferred murine granzyme B substrate, and previous evidence has shown that modification of the C-terminus aspartate residue with an aldehyde creates an electrophilic trap, potently inhibiting granzyme B with a Ki of 80 nM(21,22). Previous structural analysis demonstrated the inhibitor forms a covalent bond between the aldehyde carbon and the enzyme active-site serine residue. To generate a PET imaging construct, a small, flexible linker (Gly-Gly-Gly) was used to bridge the peptide and the radiometal chelator 2-[4,7-bis(carboxymethyl)-1,4,7-triazonan-1-yl]acetic acid (NOTA) (Fig. 3A). An in vitro enzyme inhibition assay following conjugation confirmed retained inhibitory potency with a Ki of 47±54 nM (Fig. 3B). The peptide (NOTA-GZP) was labeled with 68Ga (68Ga-NOTA-GZP), a radiometal with a 68-minute half-life that matches the rapid pharmacokinetics of small peptides. The radiolabeling occurred with high yield (67±11%) and radiochemical purity of >95% (Peptide Rf = 0.9–1.0, free gallium Rf = 0.0–0.1) and resulted in an average calculated specific activity of 5190±1100 MBq/mg. Together, these characteristics demonstrated a highly suitable radioligand for in vivo imaging. We then analyzed the radiolabeled peptide for selectivity relative to other granzyme family members and found it to have 5–11 fold specificity over all other enzymes assayed (Fig. 3C). As such, the 68Ga-NOTA-GZP peptide represented a novel, high affinity, and specific peptide suitable for in vivo assessment.
Figure 3. In Vitro Characterization of Novel Granzyme B Peptide.
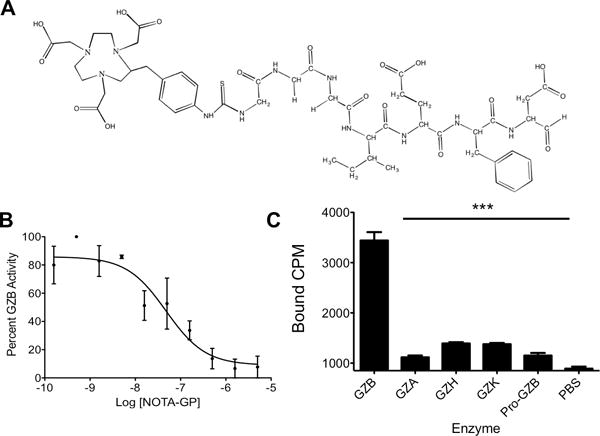
A) Chemical structure of NOTA-GZP. B) A representative plot of enzyme activity at increasing concentrations of NOTA-GZP. Each point represents the mean of 6 replicates ± SEM. A non-linear regression was fit to the points using GraphPad Prism. C) Enzyme specificity plot for radiolabeled 68Ga-NOTA-GZP. Bars represent the mean of 4 replicates ± SEM. *** P < 0.0001 by one-way ANOVA with a Bonferroni post test, comparison to granzyme B binding.
68Ga-NOTA-GZP Uptake Correlates with Granzyme B and Differentiates Therapeutic Efficacy
After confirming in vitro affinity and specificity, the ability of 68Ga-NOTA-GZP to image granzyme B in vivo was assessed in CT26 tumor-bearing mice treated with anti-PD-1 monotherapy, anti-PD-1 plus anti-CLTA-4 combination therapy regimen, or vehicle control. On day 14 post-inoculation, mice were injected with ~37 MBq of purified 68Ga-NOTA-GZP intravenously and imaged at 1 hour post-injection. PET imaging revealed uptake in tumors, kidneys and bladder, the latter of the two consistent with renal clearance characteristic of small peptides (Fig. 4A–C, Supp. Video 1–2). Specific 68Ga-NOTA-GZP PET imaging uptake was calculated by dividing total tumor uptake by left ventricle uptake to derive a tumor to blood ratio (TBR) as a measure of specifically retained signal. Comparison of TBR to Western blot-quantified granzyme B expression demonstrated a highly significant correlation (P<0.0001) with an R2 = 0.71, indicating that GZP PET imaging accurately reflects tumoral granzyme B expression (Fig. 4D). PET imaging was also used to non-invasively assess granzyme B expression following different immunotherapy treatments. Anti-PD-1 treated tumors had an average TBR of 1.29±0.12 whereas the TBR of combination (Anti-PD-1 + Anti-CTLA-4) treated mice was 1.83±0.18. Both monotherapy and combination therapy granzyme B expression were significantly elevated above untreated mice (TBR=0.96±0.11). Following imaging, mice were sacrificed and ex vivo radioactivity assessed by gamma counter, which confirmed PET analysis (Supp. Fig. S4). The specificity of tumoral granzyme B was finally investigated using dynamic PET imaging to analyze the effects of altered vasculature permeability on peptide retention. Based on the irreversible mechanism of binding a PATLAK graphical plot was utilized and tumor influx calculated. The resulting data was compatible with an irreversible two-compartment model, providing further evidence of granzyme B-specific peptide accumulation (Supp. Fig. S5).
Figure 4.
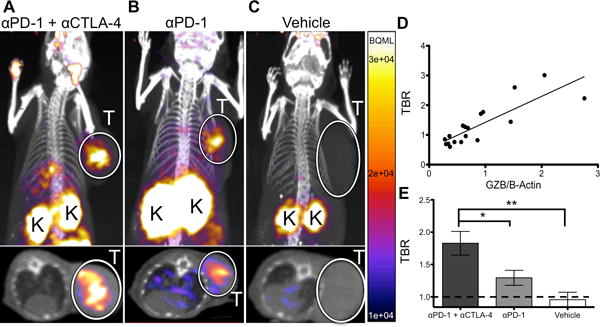
Quantitative PET Imaging of Granzyme B Following Cancer Immunotherapy PET images of A) anti-PD-1 and anti-CTLA-4 combination treated, B) anti-PD-1 treated and C) vehicle treated mice acquired 1 h post-injection of 68Ga-NOTA-GZP. Top image represents a coronal maximal intensity projection of whole body uptake, with tumors circled and labeled (T) and kidneys, which are the main route of peptide clearance, marked with a (K). Bottom image shows an axial slice of the mouse with tumors circled and labeled with a (T) for clarity. D) Plot of TBR versus normalized granzyme B expression from mice undergoing PET imaging followed by subsequent ex vivo protein quantification, r2 = 0.71, p < 0.0001 by Pearson’s correlation E) Mice treated with combination, monotherapy, or vehicle control were imaged and PET TBR acquired for each group. Bars represent the mean of N=9–14 mice ± SEM. * P < 0.05, ** P < 0.01
Granzyme B PET Imaging Predicts Response to Immunotherapy
Having determined that 68Ga-NOTA-GZP represented an accurate and non-invasive method to analyze granzyme B expression, the radiolabeled peptide was next used to image treated mice prior to tumor size divergence to determine the predictive value of the peptide. CT26 tumor-bearing mice were treated with anti-PD-1 and anti-CTLA-4 combination therapy and GZP PET imaging was performed on 12 treated and 8 untreated mice 12 days post-tumor inoculation. This day represented the earliest possible time point in which our previous studies observed significant differences in granzyme B expression and was also before repression of tumor growth. While the vehicle treated mice had mostly low levels of GZP PET uptake (Mean TBR = 0.95±0.20, range 0.72–1.28), the treated mice diverged into two distinct and non-overlapping groups of high GZP PET uptake (Mean TBR = 1.90±0.55, range 1.25–2.86) and low GZP PET uptake (Mean TBR = 0.89±0.19, range = 0.57–1.08) (Fig. 5). The high GZP-uptake group was significantly differentiated from both the low GZP uptake (P < 0.05) and untreated control groups (P < 0.001). There was no significant difference in uptake between low-GZP uptake treated tumors and untreated control. These results also stood in agreement with the patterns observed by ex vivo Western blot analysis.
Figure 5. Granzyme B PET Imaging Differentiates Treated Responders and Non-Responders.
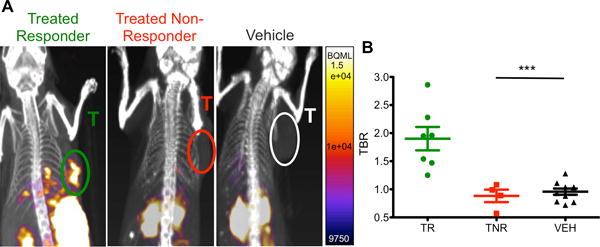
Mice treated with combination anti-PD-1 and anti-CTLA-4 therapy or vehicle were imaged 12 days post-inoculation. A) Representative sagittal images of treated responders, treated non-responders and vehicle treated mice, tumors labeled (T). B) Scatter plot of individual mice by groups, mean of each group are demonstrated by bars ± SEM. *** P < 0.001
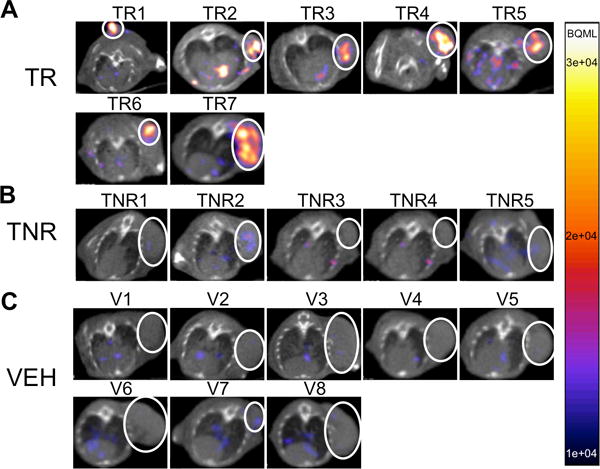
Although at the time of imaging there was no difference in tumor volume between any of the three groups (Fig. 6B), all treated tumors that regressed were identified as high GZP-uptake by PET imaging, while all tumors that significantly increased in size were characterized as having low GZP-uptake (Fig. 6C). As such, our PET imaging quantification of GZP TBR was completely predictive of future tumoral response in the CT26 model. Representative PET images of each tumor are shown in Supplementary Fig. S6 to demonstrate the striking visual correlation between tumor response and non-response between mice treated in an identical manner.
Figure 6. Tumor Growth of High and Low Granzyme B Expression.
A) Tumor growth curves of treated responder (green circles), treated non-responders (red squares) and vehicle treated (black triangles) mice, same groups as Figure 5. Each measurement represented the mean of two individual caliper measurements. B) Tumor volumes of each group of mice on the day of imaging, no significant difference between groups. C) Tumor volumes of mice at end of study, grouped by PET TBR. * P < 0.05; *** P < 0.001
Differential human granzyme B probe binding in human melanoma patient samples
Having demonstrated the predictive ability of the murine granzyme B-specific probe, we set out to develop an analogous human granzyme B-specific probe. The substrate specificity of human granzyme B differs by one amino acid from the murine enzyme(23), with Ile-Glu-Pro-Asp the preferred substrate. We modified this tetrapeptide in a similar fashion as our murine imaging agent to create an irreversible inhibitor, and then biotinylated the N-terminus for purpose of tissue staining (hGZP). We then analyzed a cohort of 9 human melanoma biopsy samples obtained from patients treated with anti-PD-1 checkpoint inhibitors (n=6 nivolumab and n=3 pembrolizumab), that were retrospectively correlated with response based on modified RECIST criteria. Using an anti-human granzyme B antibody, on-treatment biopsy samples demonstrated distinct differences in the amount and intensity of granzyme B staining between treated responders and non-responders by IHC (Fig. 7A). To quantify the degree and magnitude of difference between treated responders and non-responders, quantitative fluorescent microscopy was performed. Fluorescent microscopy analysis shows treated-responder specimen granzyme B expression up to ~1000x greater than treated non-responders, and suggests continual increase in treated-granzyme B expression over time (Fig. 7B). Finally, treated-responder samples were analyzed by both immunohistochemistry and immunofluorescence to compare the ability of hGZP to specifically detect granzyme B in human tissue and compare it to anti-granzyme B antibody. A strong correlation was observed by both techniques, indicating highly specific binding of hGZP to human granzyme B (Fig. 7C, 7D). These results suggest that there are significant differences in tumoral granzyme B expression between human responders and non-responders and that these differences are recognized by our human granzyme B specific probe. The magnitude of difference between responders and non-responders suggests that future clinical imaging studies will be able to readily distinguish between these two groups.
Figure 7. Human Melanoma Granzyme B Analysis and Peptide Binding.
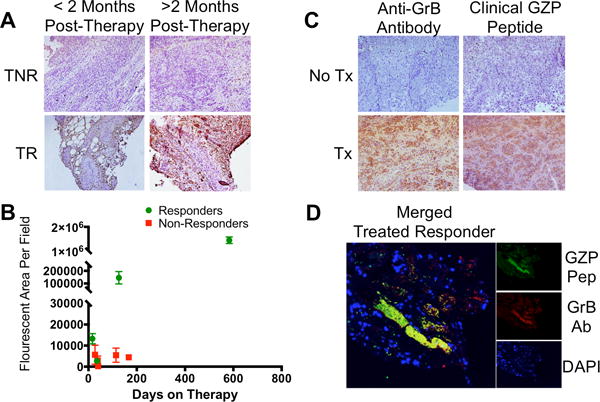
A) Human melanoma samples from patients treated with an anti-PD-1 checkpoint inhibitor were grouped as treated responders (TR) or treated non-responders (TNR) based on modified RECIST criteria. B) Immunofluorescent microscopy quantification of granzyme B in 9 patients at incremental time intervals reveals significant differences in granzyme B expression as early as 16 days post-therapy between responding and non-responding patients. C) Comparison of matched samples using either an anti-Granzyme B antibody (Anti-GrB) or humanized GZP peptide (clinical GZP) reveals similar patterns of staining between the antibody and peptide that are much stronger in treated patients than untreated patients. D) Co-localization (yellow) of human GZP (green) and anti-GrB (red) are demonstrated in a treated responder melanoma patient, with nuclear staining (DAPI) in blue.
Discussion
In this report we demonstrate that granzyme B represents an attractive biomarker for early response prediction to cancer immunotherapy and have developed a novel, translatable granzyme B-targeted peptide to allow for repeated, quantitative, and non-invasive PET imaging assessment. Beginning in a murine immunotherapy model, we establish that tumoral uptake of 68Ga-NOTA-GZP is highly correlated with tumoral granzyme B expression across a number of therapeutic strategies. In tumors treated with combined PD-1 and CTLA-4 inhibitors, we show that 68Ga-NOTA-GZP PET imaging prior to tumor volume divergence segments tumors into high and low-signal groups. Further monitoring of changes in tumor volume revealed that all high-uptake tumors subsequently regressed, and all low-uptake tumors progressed on therapy, with the low uptake group PET quantification indistinguishable from vehicle treated controls. We extended our findings by analyzing human melanoma biopsy specimens obtained from patients on checkpoint inhibitor therapy. Using a human specific version of our granzyme B imaging probe, we demonstrate marked increased granzyme B expression in treated responders in comparison to treated non-responders. These results suggest granzyme B PET imaging may serve as a non-invasive imaging biomarker for predicting response in immuno-oncology.
Immunotherapy represents a significant advance in cancer treatment, with many patients experiencing durable tumor remission(2,7,24). However, oncologists must balance the benefits that are eventually seen in only a minority of patients with a high incidence of severe immune-related adverse events in the treated population. Moreover, they must weigh the potential increased tumoricidal benefits of combination immunotherapy with the greater rate of severe side effects when utilizing these regimens(2,25). Unfortunately, standard clinical imaging modalities (CT, MRI, 18F-FDG-PET) typically utilized to monitor therapeutic efficacy are of limited value in the setting of immunotherapy, due in part to the tumoral inflammatory infiltrate that can be induced by treatment(26). This infiltrate is indistinguishable from tumor progression, confounding standard imaging diagnostics(27,28). As such, an alternative biomarker for monitoring immune response is needed. Potential PET imaging biomarkers such as CD8 or PD-L1 may provide benefit in certain cases, however a more global marker of T cell activation was sought in order to accurately determine T cell activity rather than cell presence.
Granzyme B, a serine protease released primarily by cytotoxic T cells as a primary tumor killing mechanism, may serve as such a biomarker. Our work and others’ have demonstrated it to be differentially expressed among treated responders and non-responders(29). Unlike other biomarkers under investigation, expression of tumoral granzyme B represents an incorporation of cytotoxic T cell tumor localization as well as tumoricidal activity. Its expression serves as a general response biomarker by integrating the activity of multiple converging pathways of immune-mediated tumor cell killing enhancement or suppression. Moreover, granzyme B specific imaging provides for an integrated picture of granzyme B expression within a given lesion and allows for simultaneous interrogation of all tumor sites. This global view stands in contrast to the small geographic and temporal perspective of a biopsy specimen, which provides a wealth of data but represents less than 0.1% of the total tumor volume. The inherent marked spatial heterogeneity of tumors and tumoral immune cell infiltrates, as demonstrated in our and others’ data(30,31), underscores the risk of inaccurate assessment when relying on biopsies rather than complete tumor sampling. Additionally, the rapid pharmacokinetics of the peptide-based imaging agent allows for repeat, non-invasive quantitation of granzyme B activity, facilitating integration into clinical trials and overcoming the need for repeat biopsy with the attendant patient risks(32–34). This current lack of global and temporal assessment has been one of the limitations to clinical development of cancer immunotherapies and combination treatments. Granzyme B PET imaging may reduce these limitations by providing early and quantitative verification of successful therapeutic development.
We anticipate that granzyme B imaging will significantly benefit several aspects of the evolving cancer immunotherapy landscape. It may be used to distinguish treated responders from treated non-responders on an individual patient basis at time points much earlier than previously possible, allowing for triage of non-responders onto alternative therapeutic regimens early in the course of treatment. Non-responders could avoid the often-severe side effects of an ineffective therapy, and would have an opportunity to try other, potentially more effective regimens, immunotherapy-based or otherwise. With the ability to rapidly distinguish effective from ineffective therapy, 68Ga-NOTA-GZP imaging may conversely allow patients to begin on less strenuous single-agent regimens and only move to combination regimens if imaging indicates a lack of granzyme B secretion. The quantitative signal derived from PET imaging may also be broadly useful in clinical trial development. As we observed in this study, combination therapy is associated with higher mean 68Ga-NOTA-GZP uptake than anti-PD-1 monotherapy. Further investigation of dose dependency and alternative combination therapy are required to definitively confirm this application, but comparison of immunotherapy regimens based on their 68Ga-NOTA-GZP quantification may allow for rapid comparison of alternative clinical trial regimens in a more nuanced and less time-intensive fashion than tracking overall survival.
Our work presented in this report suggests that granzyme B PET may serve as a much-needed quantitative predictive imaging biomarker. Multiple 68Ga-labelled peptides are currently in use clinically, and the pharmacokinetic profile of peptides is well suited for clinical translation. Given the potential benefits of incorporation of granzyme B PET imaging into immunotherapy diagnostics, near term human clinical trials are planned. Initial clinical trials focused in melanoma patients will allow for human pharmacokinetic analysis and granzyme B quantification and correlation with overall response and progression free-survival. They will also provide the framework for future trials that will permit a more comprehensive quantitative examination of the predictive capabilities at both an individual patient level and for novel therapeutic assessment.
Supplementary Material
Acknowledgments
The authors would like to thank Hans Vitzhum and Emily Bloch for their assistance with data collection and manuscript preparation.
Financial Support: NIH P50-CA127003 and R01-CA166582
Footnotes
Conflict of Interest: The authors declare no potential conflicts of interest.
References
- 1.Royal RE, Levy C, Turner K, Mathur A, Hughes M, Kammula US, et al. Phase 2 trial of single agent Ipilimumab (anti-CTLA-4) for locally advanced or metastatic pancreatic adenocarcinoma. Journal of immunotherapy. 2010;33(8):828–33. doi: 10.1097/CJI.0b013e3181eec14c. [DOI] [PMC free article] [PubMed] [Google Scholar]
- 2.Postow MA, Chesney J, Pavlick AC, Robert C, Grossmann K, McDermott D, et al. Nivolumab and ipilimumab versus ipilimumab in untreated melanoma. N Engl J Med. 2015;372(21):2006–17. doi: 10.1056/NEJMoa1414428. [DOI] [PMC free article] [PubMed] [Google Scholar]
- 3.Larkin J, Chiarion-Sileni V, Gonzalez R, Grob JJ, Cowey CL, Lao CD, et al. Combined Nivolumab and Ipilimumab or Monotherapy in Untreated Melanoma. N Engl J Med. 2015;373(1):23–34. doi: 10.1056/NEJMoa1504030. [DOI] [PMC free article] [PubMed] [Google Scholar]
- 4.Marrone KA, Ying W, Naidoo J. Immune-Related Adverse Events From Immune Checkpoint Inhibitors. Clinical Pharmacology & Therapeutics. 2016:n/a–n/a. doi: 10.1002/cpt.394. [DOI] [PubMed] [Google Scholar]
- 5.Wolchok JD, Hoos A, O’Day S, Weber JS, Hamid O, Lebbé C, et al. Guidelines for the evaluation of immune therapy activity in solid tumors: immune-related response criteria. Clinical Cancer Research. 2009;15(23):7412–20. doi: 10.1158/1078-0432.CCR-09-1624. [DOI] [PubMed] [Google Scholar]
- 6.Sachpekidis C, Larribere L, Pan L, Haberkorn U, Dimitrakopoulou-Strauss A, Hassel JC. Predictive value of early 18F-FDG PET/CT studies for treatment response evaluation to ipilimumab in metastatic melanoma: preliminary results of an ongoing study. European Journal of Nuclear Medicine and Molecular Imaging. 2015;42(3):386–96. doi: 10.1007/s00259-014-2944-y. [DOI] [PubMed] [Google Scholar]
- 7.Borghaei H, Paz-Ares L, Horn L, Spigel DR, Steins M, Ready NE, et al. Nivolumab versus Docetaxel in Advanced Nonsquamous Non-Small-Cell Lung Cancer. N Engl J Med. 2015;373(17):1627–39. doi: 10.1056/NEJMoa1507643. [DOI] [PMC free article] [PubMed] [Google Scholar]
- 8.Herbst RS, Baas P, Kim D-W, Felip E, Pérez-Gracia JL, Han J-Y, et al. Pembrolizumab versus docetaxel for previously treated, PD-L1-positive, advanced non-small-cell lung cancer (KEYNOTE-010): a randomised controlled trial. The Lancet. 2015 doi: 10.1016/S0140-6736(15)01281-7. [DOI] [PubMed] [Google Scholar]
- 9.Tavaré R, Escuin-Ordinas H, Mok S, McCracken MN, Zettlitz KA, Salazar FB, et al. An Effective Immuno-PET Imaging Method to Monitor CD8-Dependent Responses to Immunotherapy. Cancer Research. 2016;76(1):73–82. doi: 10.1158/0008-5472.CAN-15-1707. [DOI] [PMC free article] [PubMed] [Google Scholar]
- 10.Larimer BM, Wehrenberg-Klee E, Caraballo A, Mahmood U. Quantitative CD3 PET Imaging Predicts Tumor Growth Response to Anti-CTLA-4 Therapy. Journal of Nuclear Medicine. 2016 doi: 10.2967/jnumed.116.173930. [DOI] [PMC free article] [PubMed] [Google Scholar]
- 11.Maute RL, Gordon SR, Mayer AT, McCracken MN, Natarajan A, Ring NG, et al. Engineering high-affinity PD-1 variants for optimized immunotherapy and immuno-PET imaging. Proceedings of the National Academy of Sciences. 2015;112(47):E6506–E14. doi: 10.1073/pnas.1519623112. [DOI] [PMC free article] [PubMed] [Google Scholar]
- 12.Schwartz RH. T cell anergy. Annu Rev Immunol. 2003;21:305–34. doi: 10.1146/annurev.immunol.21.120601.141110. [DOI] [PubMed] [Google Scholar]
- 13.Roychoudhuri R, Eil RL, Restifo NP. The interplay of effector and regulatory T cells in cancer. Curr Opin Immunol. 2015;33:101–11. doi: 10.1016/j.coi.2015.02.003. [DOI] [PubMed] [Google Scholar]
- 14.Podack ER. Execution and suicide: cytotoxic lymphocytes enforce Draconian laws through separate molecular pathways. Curr Opin Immunol. 1995;7(1):11–6. doi: 10.1016/0952-7915(95)80023-9. [DOI] [PubMed] [Google Scholar]
- 15.Nagata S. Apoptosis by death factor. Cell. 1997;88(3):355–65. doi: 10.1016/s0092-8674(00)81874-7. [DOI] [PubMed] [Google Scholar]
- 16.Thornberry NA, Rano TA, Peterson EP, Rasper DM, Timkey T, Garcia-Calvo M, et al. A combinatorial approach defines specificities of members of the caspase family and granzyme B. Functional relationships established for key mediators of apoptosis. J Biol Chem. 1997;272(29):17907–11. doi: 10.1074/jbc.272.29.17907. [DOI] [PubMed] [Google Scholar]
- 17.Duraiswamy J, Kaluza KM, Freeman GJ, Coukos G. Dual blockade of PD-1 and CTLA-4 combined with tumor vaccine effectively restores T-cell rejection function in tumors. Cancer Res. 2013;73(12):3591–603. doi: 10.1158/0008-5472.CAN-12-4100. [DOI] [PMC free article] [PubMed] [Google Scholar]
- 18.Stewart JM, Young JD. Solid phase peptide synthesis. Pierce Chemical Company; 1984. [Google Scholar]
- 19.Heidari P, Wehrenberg-Klee E, Habibollahi P, Yokell D, Kulke M, Mahmood U. Free somatostatin receptor fraction predicts the antiproliferative effect of octreotide in a neuroendocrine tumor model: implications for dose optimization. Cancer Res. 2013;73(23):6865–73. doi: 10.1158/0008-5472.CAN-13-1199. [DOI] [PMC free article] [PubMed] [Google Scholar]
- 20.Voskoboinik I, Whisstock JC, Trapani JA. Perforin and granzymes: function, dysfunction and human pathology. Nat Rev Immunol. 2015;15(6):388–400. doi: 10.1038/nri3839. [DOI] [PubMed] [Google Scholar]
- 21.Willoughby CA, Bull HG, Garcia-Calvo M, Jiang J, Chapman KT, Thornberry NA. Discovery of potent, selective human granzyme B inhibitors that inhibit CTL mediated apoptosis. Bioorg Med Chem Lett. 2002;12(16):2197–200. doi: 10.1016/s0960-894x(02)00363-3. [DOI] [PubMed] [Google Scholar]
- 22.Rotonda J, Garcia-Calvo M, Bull HG, Geissler WM, McKeever BM, Willoughby CA, et al. The three-dimensional structure of human granzyme B compared to caspase-3, key mediators of cell death with cleavage specificity for aspartic acid in P1. Chem Biol. 2001;8(4):357–68. doi: 10.1016/s1074-5521(01)00018-7. [DOI] [PubMed] [Google Scholar]
- 23.Casciola-Rosen L, Garcia-Calvo M, Bull HG, Becker JW, Hines T, Thornberry NA, et al. Mouse and human granzyme B have distinct tetrapeptide specificities and abilities to recruit the bid pathway. Journal of Biological Chemistry. 2007;282(7):4545–52. doi: 10.1074/jbc.M606564200. [DOI] [PubMed] [Google Scholar]
- 24.Motzer RJ, Escudier B, McDermott DF, George S, Hammers HJ, Srinivas S, et al. Nivolumab versus Everolimus in Advanced Renal-Cell Carcinoma. N Engl J Med. 2015;373(19):1803–13. doi: 10.1056/NEJMoa1510665. [DOI] [PMC free article] [PubMed] [Google Scholar]
- 25.Naidoo J, Page DB, Li BT, Connell LC, Schindler K, Lacouture ME, et al. Toxicities of the anti-PD-1 and anti-PD-L1 immune checkpoint antibodies. Ann Oncol. 2015;26(12):2375–91. doi: 10.1093/annonc/mdv383. [DOI] [PMC free article] [PubMed] [Google Scholar]
- 26.Kubota R, Yamada S, Kubota K, Ishiwata K, Tamahashi N, Ido T. Intratumoral distribution of fluorine-18-fluorodeoxyglucose in vivo: high accumulation in macrophages and granulation tissues studied by microautoradiography. J Nucl Med. 1992;33(11):1972–80. [PubMed] [Google Scholar]
- 27.Wolchok JD, Hoos A, O’Day S, Weber JS, Hamid O, Lebbe C, et al. Guidelines for the evaluation of immune therapy activity in solid tumors: immune-related response criteria. Clin Cancer Res. 2009;15(23):7412–20. doi: 10.1158/1078-0432.CCR-09-1624. [DOI] [PubMed] [Google Scholar]
- 28.Okada H, Weller M, Huang R, Finocchiaro G, Gilbert MR, Wick W, et al. Immunotherapy response assessment in neuro-oncology: a report of the RANO working group. Lancet Oncol. 2015;16(15):e534–42. doi: 10.1016/S1470-2045(15)00088-1. [DOI] [PMC free article] [PubMed] [Google Scholar]
- 29.Tumeh PC, Harview CL, Yearley JH, Shintaku IP, Taylor EJ, Robert L, et al. PD-1 blockade induces responses by inhibiting adaptive immune resistance. Nature. 2014;515(7528):568–71. doi: 10.1038/nature13954. [DOI] [PMC free article] [PubMed] [Google Scholar]
- 30.Galon J, Costes A, Sanchez-Cabo F, Kirilovsky A, Mlecnik B, Lagorce-Pages C, et al. Type, density, and location of immune cells within human colorectal tumors predict clinical outcome. Science. 2006;313(5795):1960–4. doi: 10.1126/science.1129139. [DOI] [PubMed] [Google Scholar]
- 31.Nawaz S, Heindl A, Koelble K, Yuan Y. Beyond immune density: critical role of spatial heterogeneity in estrogen receptor-negative breast cancer. Mod Pathol. 2015;28(12):1621. doi: 10.1038/modpathol.2015.133. [DOI] [PubMed] [Google Scholar]
- 32.Manno C, Strippoli GF, Arnesano L, Bonifati C, Campobasso N, Gesualdo L, et al. Predictors of bleeding complications in percutaneous ultrasound-guided renal biopsy. Kidney Int. 2004;66(4):1570–7. doi: 10.1111/j.1523-1755.2004.00922.x. [DOI] [PubMed] [Google Scholar]
- 33.Myers RP, Fong A, Shaheen AA. Utilization rates, complications and costs of percutaneous liver biopsy: a population-based study including 4275 biopsies. Liver Int. 2008;28(5):705–12. doi: 10.1111/j.1478-3231.2008.01691.x. [DOI] [PubMed] [Google Scholar]
- 34.Heck SL, Blom P, Berstad A. Accuracy and complications in computed tomography fluoroscopy-guided needle biopsies of lung masses. Eur Radiol. 2006;16(6):1387–92. doi: 10.1007/s00330-006-0152-2. [DOI] [PubMed] [Google Scholar]
Associated Data
This section collects any data citations, data availability statements, or supplementary materials included in this article.


