Abstract
Even though there are hundreds of reports in the published literature supporting the hypothesis that G protein-coupled receptors (GPCR) form and function as dimers this remains a highly controversial area of research and mechanisms governing homodimer formation are poorly understood. Crystal structures revealing homodimers have been reported for many different GPCR. For adrenergic receptors, a potential dimer interface involving transmembrane domain 1 (TMD1) and helix 8 (H8) was identified in crystal structures of the beta1-adrenergic (β1-AR) and β2-AR. The purpose of this study was to investigate a potential role for TMD1 and H8 in dimerization and plasma membrane expression of functional β2-AR. Charged residues at the base of TMD1 and in the distal portion of H8 were replaced, singly and in combination, with non-polar residues or residues of opposite charge. Wild type and mutant β2-AR, tagged with YFP and expressed in HEK293 cells, were evaluated for plasma membrane expression and function. Homodimer formation was evaluated using bioluminescence resonance energy transfer, bimolecular fluorescence complementation, and fluorescence correlation spectroscopy. Amino acid substitutions at the base of TMD1 and in the distal portion of H8 disrupted homodimer formation and caused receptors to be retained in the endoplasmic reticulum. Mutations in the proximal region of H8 did not disrupt dimerization but did interfere with plasma membrane expression. This study provides biophysical evidence linking a potential TMD1/H8 interface with ER export and the expression of functional β2-AR on the plasma membrane.
Keywords: Beta2-adrenergic receptor, dimerization, homodimer interface, trafficking, fluorescence correlation spectroscopy
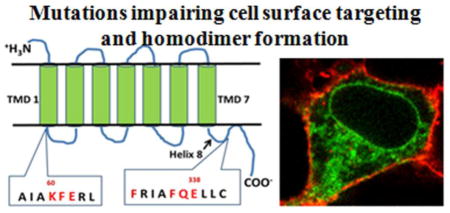
Graphical Abstract
1. Introduction
Monoamine receptors are members of the G protein-coupled receptor (GPCR) super family of plasma membrane signaling proteins, one of the largest protein families encoded in the human genome. They are expressed throughout the body and are targets for a wide variety of currently marketed pharmaceuticals. Therefore, significant emphasis has been placed on understanding molecular mechanisms governing monoamine receptor structure and function.
Over the past several decades, evidence has been mounting in favor of a new model of GPCR activation that includes the formation of dimeric or oligomeric complexes. While highly controversial, dimerization has been reported to regulate all aspects of GPCR function including synthesis, ligand binding, and signaling (reviewed in [1, 2]). More recently, homodimer formation has been reported for native 5-HT2C receptors endogenously expressed in their native cellular environment [3]. However, less is known about how dimer formation occurs and how it regulates receptor function. Central to our understanding of how dimerization occurs is the identification of the homodimer interface.
Two potential homodimer interfaces are predicted based on GPCR crystal structures: a more frequently observed interface involving symmetrical regions of transmembrane domains (TMD) 1, 2 and helix 8 (H8) [4–10] and a TMD4/5 or TMD5/6 interface [8, 10–12]. For monoamine receptors, experimental evidence has been provided supporting both TMD1/H8 [10, 13, 14] and TMD4/5/6 interfaces [10, 15–17]. Computer modeling studies predict a TMD1/H8 interface to be involved in the formation of stable GPCR homodimers, with the possibility of a more transient TMD4/5 interface being involved in the formation of oligomers [18, 19]. For adrenergic receptors, the beta1-adrenergic (β1-AR) crystal structure reported by Huang and colleagues [10] and the β2-AR crystal structure reported by Cherezov and colleagues [20] both implicate TMD1 and H8 as potential dimer interfaces, albeit in different arrangements. The β1-AR crystal structure shows symmetrical TMD1 and H8 interfaces, along with TMD4/5, while the β2-AR crystal structure predicts an inter-receptor ionic linkage between charged residues at the base of TMD1 (K60) and H8 (E338). Notably, both crystal structures implicate analogous charged residues in the distal portion of H8 at the dimer interface.
Previous mutagenesis studies have focused on hydrophobic residues within TMD1 [21, 22], intracellular loop 1 [23], and H8 [22, 24–26]. In contrast, the present study investigated the physiological role of charged residues at the base of TMD1 (in the region of K60) and the distal portion of H8 (in the region of E338) in regulating β2-AR homodimer biogenesis and receptor function. Polar and charged residues were replaced, singly and in combination, with non-polar residues or residues of opposite charge. Wild type (WT) and mutant β2-AR, labeled with YFP and expressed in HEK293 cells, were evaluated for plasma membrane targeting and G protein activation. Dimerization was evaluated using bioluminescence resonance energy transfer (BRET), bimolecular fluorescence complementation (BiFC) and fluorescence correlation spectroscopy (FCS). The results of this study support the hypothesis that residues in the distal portion of H8 and at the base of TMD1 play a role in β2-AR homodimer formation and the delivery of functional receptor complexes to the plasma membrane.
2. Methods
2.1 Cell culture and transfection
HEK293 cells from the American Type Culture Collection were cultured in Dulbecco’s Modified Eagle’s Medium (DMEM, Cellgro) with 10% fetal bovine serum (FBS, HyClone) at 37°C, 5% CO2. For radioligand binding, fluorescence, cAMP, and BRET assays the cells were plated in six-well plates (5×10⁵ cells/well) 24hrs prior to transfection. For confocal imaging, BiFC, and FCS cells were plated on poly-lysine treated glass coverslips in six-well plates. Transfections contained 100ng of each plasmid with 2ul of lipofectamine reagent (Invitrogen), unless otherwise indicated. Transfections were performed in serum-free DMEM and were ended after 5hrs by washing in PBS and addition of DMEM. For confocal, BiFC, and FCS transfections were ended in phenol-free MEM. Assays were performed 24hrs following transfection. Transfection efficiency was 40%, determined by confocal fluorescence imaging of cells transfected with CFP plasmid to identify transfected cells.
2.2 Creation of mutant and fluorescence-tagged receptors
Plasmid cDNA encoding β2-AR was provided by R.J. Lefkowitz (Duke University), CD-28 was provided by J. Miller (University of Rochester) and CD-86 was provided by G. Milligan (University of Glasgow). The β2-AR was cloned into the pEGFP-N1 (Clonetech) at EcoRI/BamHI to create a chimeric receptor with a fluorescent tag on the C-terminus of the receptor, which was used as the starting template for mutagenesis. Sense and anti-sense primers containing the desired TMD1 and H8 β2-AR mutations were used in PCR-based mutagenesis with pfu polymerase (Stratagene), according to the Stratagene protocol. For the BRET assay, yellow fluorescent protein (YFP) and Renilla luciferase (Rluc) were attached to the C-terminal end of WT and mutant β2-AR by ligation of receptors into pEYFP-N1 and Rluc vectors (Clontech). All constructs were confirmed by DNA sequencing (Center for Functional Genomics, Albany, NY).
2.3 Bimolecular fluorescence complementation (BiFC)
BiFC pairs, N-YFP and C-YFP, were made by site-directed mutagenesis using the β2-AR/YFP cDNA as the starting template. β2-AR/N-YFP was made by inserting a stop codon at amino acid 156 of YFP. β2-AR/C-YFP was made by inserting a BamHI site at amino acid 156 of the YFP, followed by BamHI digest to remove amino acids 1–155 of the YFP, and subsequent re-ligation. To create the mutant β2-AR BiFC pairs, WT β2-AR was cut out of the N-YFP and C-YFP constructs and the mutant β2-AR was inserted. BiFC was performed by co-transfecting equal amounts (200ng each) of WT or mutant β2-AR/N-YFP + β2-AR/C-YFP, along with 50ng of pECFP-N1 plasmid into HEK293 cells as described in section 2.1 above. Confocal fluorescence imaging was performed 36 to 40 hours post-transfection. CFP fluorescence was used to identify transfected cells and as a marker of transfection efficiency. Positive BiFC was observed as complementation of the N-YFP and C-YFP halves to restore YFP fluorescence. Negative BiFC was observed as a lack of YFP fluorescence in transfected cells co-expressing the CFP plasmid.
2.4 Radioligand binding: Cell surface and total
HEK293 cells were plated and transfected as described above in section 2.1. Whole cell radioligand binding (to measure cell surface receptors) was performed by incubating intact cells with 3H-DHA (1nM) at 37°C for 30 minutes in the absence and presence of membrane-impermeable isoproterenol (10uM) to measure cell surface binding. Cells were washed twice with cold PBS to remove unbound radioligand. Bound radioligand was released from intact cells with 3% TCA in PBS for 20 minutes, and measured by liquid scintillation counting. Membranes for homogenate radioligand binding (total binding; ER and plasma membranes) were prepared by homogenizing transfected cells in assay buffer (50mM Tris-HCl/5mM MgCl2/0.5mM EDTA pH7.4) and centrifugation at 12,000×g for 30 minutes. Membrane pellets were washed, re-suspended in assay buffer, and 10ug of membrane protein was incubated with 3H-DHA (1nM) and propranolol (0.01nM-1uM) at 37°C for 30 minutes. Samples were filtered through glass fiber filters and measured by liquid scintillation counting. Propranolol competition was analyzed using GraphPad Prism5.0.
2.5 Fluorescence assay for total protein expression
HEK293 cells were plated and transfected as described above in section 2.1. Twenty-four hours post-transfection, each well of cells was washed in PBS, re-suspended in 100 ul of trypsin/PBS 1:1, and 100ul of PBS with 5% FBS was added to a final volume of 200ul per well. Individual 200ul samples were added to a 96 well plate (black wall and bottom, Costar) and total YFP fluorescence was measured using a Victor3 Perkin Elmer plate reader (485nm/530nm for 2.0s). Data are reported as total fluorescence observed in each well in arbitrary fluorescence units recorded by the plate reader.
2.6 cAMP Assay
Transfected HEK293 cells were transferred to a 96 well plate and incubated with isoproterenol (0.1nM-1uM) for 30 minutes. Isoproterenol-stimulated cAMP production was measured using the LANCE cAMP kit (PerkinElmer), according to the manufacture’s protocol, in a VICTOR3 plate reader (Perkin Elmer). Dose-response EC50 values were determined using GraphPad Prism5.0.
2.7 Bioluminescence Resonance Energy Transfer (BRET)
HEK293 cells were plated and transfected as described above in section 2.1. HEK293 cells co-transfected with BRET donor (Renilla luciferase fused to the C-terminus of WT and mutant receptors) and acceptor (YFP fused to the C-terminus of WT and mutant receptors) were washed in PBS, lifted in 1ml of PBS/EDTA and placed in a cuvette with 5uM coelenterazine f (Molecular probes). Emission spectra (400nm–600nm) were collected on a Perkin Elmer LS-50B luminescence spectrophotometer. BRET ratios were calculated as: [(emission at 510–590nm) – (emission at 440–500nm) X cf] / (emission at 440–500nm) where cf = (emission at 510–590nm) – (emission at 440–500nm) for WT/Rluc+pcDNA3 control, as previously described [27].
2.8 Fluorescence correlation spectroscopy (FCS) with Photon Counting Histogram (PCH)
HEK293 cells were plated and transfected as described above in section 2.1. FCS recordings were made on the upper plasma membrane (WT) or within the ER (K60L/E338L and F332A/F336A) of transfected HEK293 cells (in HEPES-buffered MEM without phenol red) using a Zeiss LSM-780 confocal microscope (Carl Zeiss, Germany) as previously described [28]. Briefly, one-photon excitation with a continuous wave argon ion laser was performed using a 40× C-apochromat water immersion objective with 1.2 numerical aperture. FCS measurements were recorded at 23°C for 100s, as 10 consecutive 10s intervals. Time-dependent fluctuations in YFP fluorescence intensity were recorded using a gallium arsenide phosphide photon counting detector and analyzed using least-squares minimization (Zeiss Aim4.2 software) to calculate the autocorrelation function G(τ), which represents the time-dependent decay in fluorescence fluctuation intensity. PCH were generated and analyzed as previously described [28]. Briefly, each 10s FCS recording was broken down into one million 10μs intervals or bins. Histograms were constructed (using the PCH module, Zeiss Aim4.2 software) in which the number of 10μs bins was plotted on the y-axis and photon counts on the x-axis. The resulting histogram depicts the number of bins that registered 1, 2, 3 photon counts etc. during one 10s FCS recording. PCH data were fit to a one component model where concentration and molecular brightness were allowed to be free (and the first order correction was fixed at zero) to determine the average molecular brightness of the entire sample. The molecular brightness of a dimer was determined using a known dimeric control, CD-28/YFP, and the results were used to predict the monomeric/dimeric/oligomeric composition of wild type and mutant receptors. Residuals of the curve fit and reduced chi square analyses were used to determine the goodness of fit to a one component model for a single species (monomers or dimers or tetramers) and a two component model (for a mixture of monomers, dimers, tetramers), as previously described [28].
3. Results
Site-directed mutagenesis was used to investigate the role of TMD1 and H8 in β2-AR homodimerization and plasma membrane expression. Figure 1 shows the characteristic seven TMD structure of a GPCR, with amino acid residues of the β2-AR targeted for mutation analysis shown in red.
Figure 1.
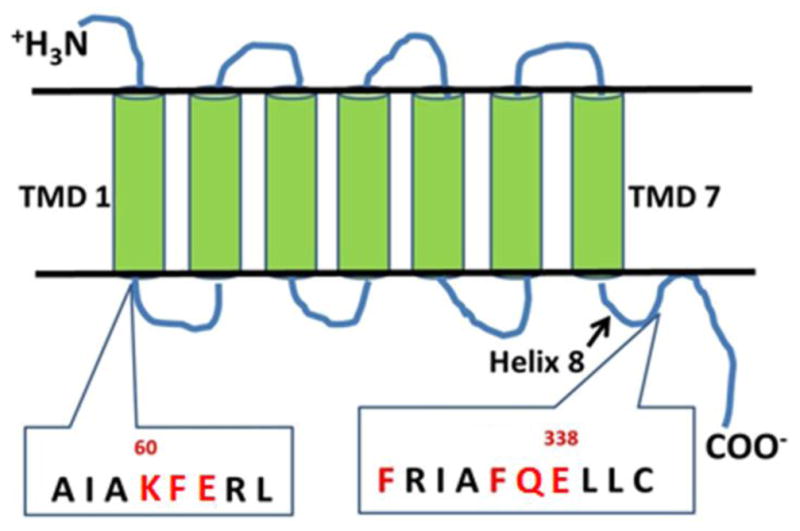
Seven transmembrane domain (TMD) structure of the β2-AR. Amino acids selected for mutagenesis at the base of TMD1 and helix 8 (H8) are shown in red. See β2-AR crystal structure of Cherezov and colleagues [20].
3.1 Cellular localization of wild type and mutant receptors
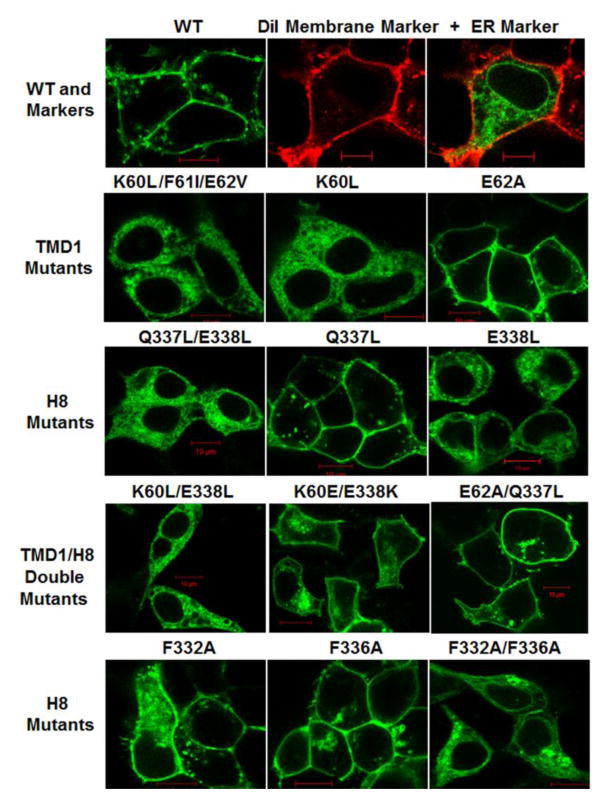
Confocal microscopy was used to determine the cellular localization of YFP-tagged wild type (WT) and mutant β2-AR expressed in HEK293 cells (figure 2). A plasma membrane dye (DiI) and YFP tag with ER retention motif (ER/YFP) were used to visualize the architecture of the plasma membrane and ER, respectively. WT receptors displayed normal trafficking and plasma membrane expression (figure 2). As a starting point, a triple mutant was created to convert the polar/charged region at the base of TMD1 into a non-polar region. The amino acids chosen for substitution were driven by the DNA sequence of the β2-AR. Alanine substitution was not possible at K60/F61/E62 because the DNA sequence to create a triple mutant with Alanine at all three positions generated primer dimers incompatible with site-directed mutagenesis. Instead, a K60L/F61I/E62V triple mutant was created. This mutant receptor demonstrated a pattern of fluorescence identical to the ER/YFP marker (figure 2). Individual mutation analysis revealed a major role for amino acid K60 and a minor role for E62 in mediating this phenotype: a K60L mutant was largely ER retained while an E62A mutant was expressed on the plasma membrane. In a similar fashion, the role of the polar/charged region of Q337/E338 in H8 was investigated by removing the charge while maintaining side chain length. The Q337L/E338L mutant was ER retained (figure 2). Individual mutation analysis revealed E338L receptors with impaired trafficking and Q337L receptors with plasma membrane expression. Based on these results, double TMD1/H8 mutants were investigated. The K60L/E338L double mutant was completely ER retained, while the neighboring E62A/Q337L mutant was able to traffic to the plasma membrane. Reversing the charge in the K60/E338 region to K60E/E338K partially restored trafficking. Since a previous study reported that F332 and F336 in H8 play a role in the ER export of the β2-AR [27], we tested these residues as well. The F332A and F336A single mutants were expressed on the plasma membrane, while the F332A/F336A double mutant was largely ER retained.
Figure 2.
Fluorescence Confocal Microscopy. Live HEK293 cells expressing YFP-tagged Wild Type (WT) and mutant β2-AR (green); DiI plasma membrane marker (red) with ER marker ER/YFP (green). Red scale bar = 10μm. Images are representative of entire fields of cells from two to four independent transfections.
3.2 Expression levels of wild type and mutant receptors
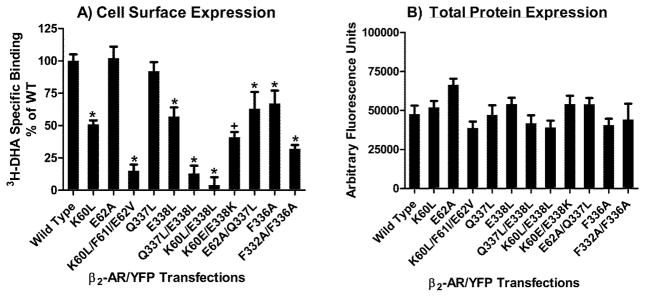
Whole cell radioligand binding was performed to measure plasma membrane expression of WT and mutant receptors (figure 3A). Specific binding of 3H-DHA to cell surface receptors was measured using isoproterenol to define non-specific binding. Consistent with the fluorescence microscopy results, the TMD1 triple mutation K60L/F61I/E62V and the Q337L/E338L H8 double mutation reduced plasma membrane expression by 85% compared to WT levels (2.78+/−0.30 pm/mg protein). Plasma membrane expression was reduced by 50% for K60L and 43% for E338L, while the E62A and Q337L neighboring mutations had minimal impact. The K60L/E338L TMD1/H8 double mutation reduced cell surface expression by >90% and the K60E/E338K double reverse mutation partially restored surface expression to 41% of WT levels. The E62A/Q337L mutation slightly reduced surface expression. The F332A/F336A mutation reduced surface expression to 32% of WT levels. While several of the mutations significantly reduced cell surface expression, they did not reduce protein expression as similar total cellular fluorescence was observed in cells transfected with equal amounts of WT/YFP or mutant/YFP cDNAs (figure 3B). Therefore, differences in cell surface expression levels of the mutant receptors (observed in figure 3A) are not due to differences in transfection, translation or expression of the mutant receptors, but instead reflect differences in the ability of the mutant receptors to traffic to the plasma membrane.
Figure 3.
Expression of WT and mutant β2-AR in HEK293 cells. A) Whole cell radioligand binding of 3H-DHA to the surface of intact cells. Data are expressed as percent of WT and represent the mean+/−sem from three transfections. Student’s t-test *p< 0.01 vs WT; +p<0.01 for K60E/E338K vs K60L/E338L. B) YFP fluorescence as an indicator of total protein expression. Data represent the mean+/−sem from three transfections.
3.3 Binding pocket integrity and function
Homogenate radioligand binding studies were performed to test the integrity of the binding pocket of several ER-retained mutant receptors. Membrane homogenates, containing both ER and plasma membranes, were prepared from HEK293 cells expressing WT and mutant receptors. Competition radioligand binding experiments were used to determine the Ki value of propranolol for inhibition of 3H-DHA binding (table 1). The K60L/E338L, K60E/E338K and E62A/Q337L mutant receptors displayed high affinity for propranolol, demonstrating proper folding of the binding pocket. The functionality of plasma membrane expressed receptors was determined by measuring cAMP production. Isoproterenol EC50 values within 1–5nM were obtained for cells expressing WT and K60E/E338K mutant receptors (table 1). No cAMP production was observed in cells expressing K60L/E338L in response to 100nM isoproterenol, consistent with a lack of cell surface expression for this mutant.
Table 1.
Propranolol binding affinity for 3H-DHA labeled receptors in membrane homogenates and isoproterenol-stimulated cAMP production in intact HEK293 cells expressing WT and mutant β2-AR. Data represent the mean+/−sem from three experiments. NR=No response to 100nM isoproterenol. ND=Not determined.
| β2-AR Plasmid | Propranolol Ki (nM) | Isoproterenol EC50 (nM) |
|---|---|---|
| WT | 1.0+/−0.1 | 0.9+/−0.1 |
| K60L/E338L | 1.0+/−0.5 | NR |
| K60E/E338K | 0.5+/−0.2 | 4.3+/−1.5 |
| E62A/Q337L | 0.4+/−0.2 | ND |
3.4 Homodimerization
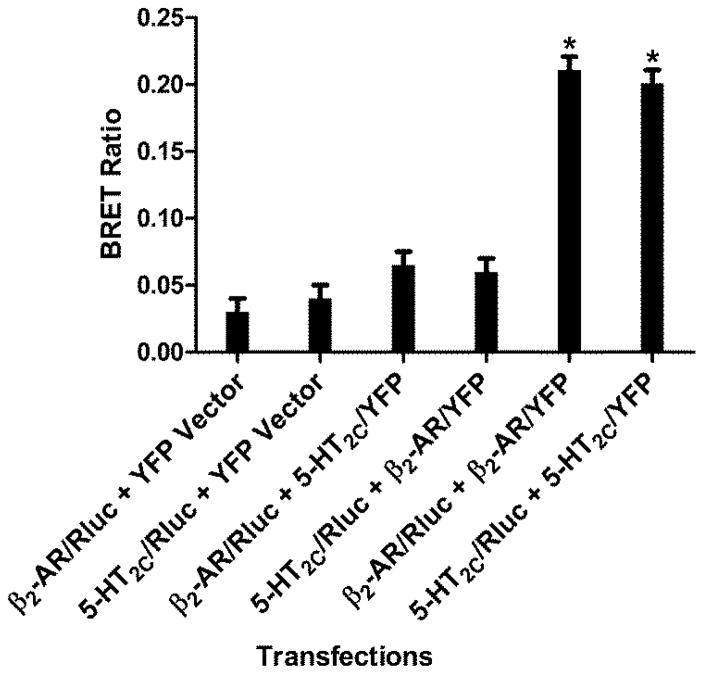
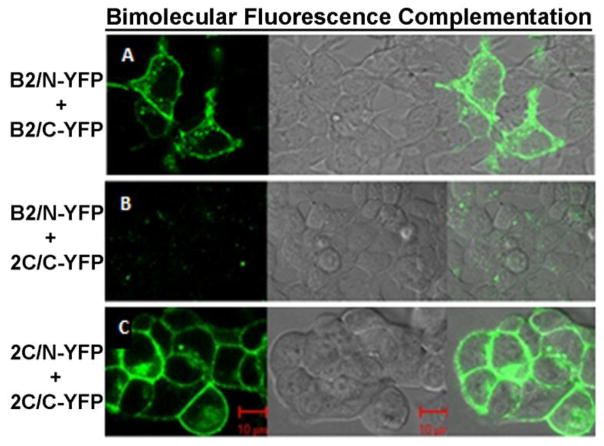
Homodimer formation was investigated using three different approaches: BRET, BiFC and FCS. The first step was to identify a non-interacting receptor pair to be used as a control for establishing baseline BRET measurements and BiFC fluorescence. The serotonin 5-HT2C receptor was used for this purpose. For the BRET studies, Renilla luciferase (Rluc) attached to the C-terminus of the receptor was used as the donor and YFP as the acceptor. Figure 4 shows the BRET ratios obtained for different combinations of Rluc and YFP vectors with tagged β2-AR and 5-HT2C receptors. Significant BRET ratios were observed in cells co-expressing Rluc- and YFP-tagged β2-AR or 5-HT2C receptors, but not in cells co-expressing β2-AR with 5-HT2C (figure 4). BiFC was used to verify the BRET results (figure 5). β2-AR and 5-HT2C receptors were tagged with the N-terminal half of YFP (N-YFP) or the C-terminal half of YFP (C-YFP). Fluorescence can only be observed when the N and C terminal halves of YFP physically associate with one another to reconstitute a functionally fluorescent YFP protein. Fluorescence complementation was observed in cells co-expressing N- and C-terminally tagged β2-AR or 5-HT2C, but not in cells co-expressing β2-AR with 5-HT2C (figure 5). The BRET results were confirmed by BiFC and indicate that β2-AR and 5-HT2C are suitable non-interacting partners for determining baseline BRET values. Thus, the BRET ratio obtained for β2-AR/Rluc + 5-HT2C/YFP (0.065) was used in subsequent experiments to define baseline or non-specific BRET levels.
Figure 4.
BRET controls. Identification of a non-interacting BRET pair as a control for establishing baseline BRET measurements. HEK293 cells were transfected with the indicated constructs and BRET ratios were measured as described in the methods section. Data represent the mean+/−sem from three to five experiments. Student’s t-test *p<0.01 vs controls.
Figure 5.
Verification of non-interacting BRET pair using bimolecular fluorescence complementation (BiFC). A) Fluorescence microscopy of HEK293 cells co-transfected β2- AR/N-YFP + β2-AR/C-YFP. Positive BiFC is indicated by green fluorescence in the left panel. The middle panel shows the differential interference contrast (DIC) image of the same cells and the right panel shows the merged image of the left and middle panels. B) Left panel: fluorescence image of cells co-transfected with β2-AR/N-YFP + 5-HT2C/C-YFP. Middle panel: DIC image of same cells. Right panel: merged image of the left and middle panels. C) Left panel: fluorescence image of cells co-transfected with 5-HT2C/N-YFP + 5-HT2C/C-YFP. Middle panel: DIC image of same cells. Right panel: merged image of the left and middle panels. Red scale bar = 10μm. Images are representative of entire fields of cells from two transfections.
3.4.1 BRET
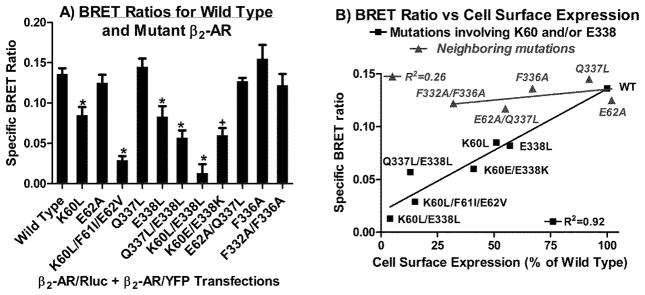
BRET was used as a preliminary screen to identify potential amino acids at the base of TMD1 and in H8 that may play a role in the self-association of β2-AR (figure 6A). The BRET ratio obtained for the non-interacting β2-AR/Rluc + 5-HT2C/YFP pair was used to determine non-specific BRET. Specific BRET ratios were defined as the difference in BRET ratio obtained from cells co-expressing Rluc- and YFP-tagged WT or mutant β2-AR and cells co-expressing β2-AR/Rluc with 5-HT2C/YFP (figure 6A). Mutations at E62 and Q337 did not impair the BRET signal, while the K60L and E338L mutations produced a moderate decrease in the BRET signal. Notably, the K60L/E338L double mutant did not interact with self as evidenced by a specific BRET signal equivalent to 10% of WT levels. Similar results were obtained with the TMD1 triple mutant K60L/F61I/E62V and to a lesser extent with the Q337L/E338L H8 double mutant. The K60E/E338K double reverse mutation partially restored specific BRET to 45% of WT levels. The F332A and F336A mutations did not impair the BRET signal. Linear regression analysis revealed a significant correlation between BRET ratios and cell surface expression for mutations involving K60 and/or E338, but not for mutations in the neighboring amino acids (figure 6B).
Figure 6.
A) BRET measured in transfected HEK293 cells. The β2-AR/Rluc+5-HT2C/YFP pair was used to define non-specific BRET as 0.065 (determined in figure 4), which was subtracted from BRET ratios obtained with the indicated Rluc+YFP pairs to obtain the “specific” BRET ratios plotted on the Y-axis. Data represent the mean+/-sem from three to five experiments. Student’s t-test *p<0.01 vs Wild Type; +p<0.05 for K60E/E338K vs K60L/E338L. B) BRET ratio vs cell surface expression. The specific BRET ratios from figure 6A were plotted on the Y-axis and cell surface expression levels from the whole cell radioligand binding assay in figure 3A were plotted on the X-axis.
3.4.2 BiFC
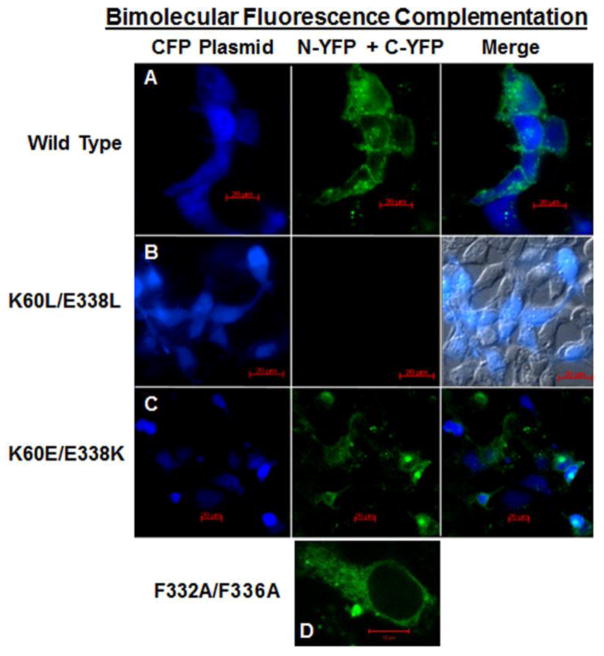
Of all the mutations screened in the preliminary BRET study, the K60L/E338L double mutant had the greatest impact on the BRET ratio. Since the BRET results implicate a role for K60 in combination with E338 in maintaining the ability of the β2-AR to self-associate, the K60L/E338L mutant was selected for further analysis using BiFC (figure 7). The N-terminal and C-terminal halves of YFP where individually attached to the C-terminus of each receptor. The ability of the YFP halves to recombine and restore fluorescence upon co-expression was monitored using fluorescence microscopy. A CFP plasmid was used as a control to identify transfected cells and to determine transfection efficiency. As anticipated based on the BiFC results presented in figure 5, HEK293 cells co-transfected with WT/N-YFP and WT/C-YFP, in combination with CFP plasmid, displayed YFP fluorescence on the plasma membrane and CFP in the cytosol (figure 7A). In contrast, in cells co-transfected with K60L/E338L/N-YFP and K60L/E338L/C-YFP, along with CFP plasmid, YFP fluorescence was absent from entire fields of cells in which nearly half of the cells were transfected successfully and expressed the CFP plasmid (figure 7B). Since the BRET study indicated a partial restoration of the BRET signal for the double reverse mutation, the K60E/E338K mutation was also evaluated in the BiFC assay. Co-expression of K60E/E338K/N-YFP and K60E/E338K/C-YFP, along with CFP plasmid, yielded YFP fluorescence in the majority of cells expressing CFP (figure 7C). Positive BiFC for K60E/E338K was observed using the same split constructs (N-YFP and C-YFP) that were used on the K60L/E338L mutant. At this point we have no reason to anticipate that the same split constructs that worked on the K60E/E338K mutant would be non-functional on the K60L/E338L mutant. While this cannot be ruled out, lack of positive BiFC for K60L/E338L is supported by the BRET results. The F332A/F336A mutant was used as a positive control in the BiFC assay since this mutant had a specific BRET ratio similar to WT. Even though the F332A/F336A mutant was entirely ER-retained, prominent BiFC was observed within the ER (figure 7D).
Figure 7.
BiFC. Fluorescence confocal microscopy of HEK293 cells co-transfected with CFP plasmid (shown in blue to identify transfected cells) and WT or mutants with N-YFP and C-YFP tags. Positive BiFC is indicated by green fluorescence in the middle column. Cells were co-transfected as follows: A) left panel, CFP; middle panel, WT/N-YFP + WT/C-YFP with positive BiFC shown in green; right panel, CFP/YFP merged image. Red scale bar = 20μm. B) left panel, CFP; middle panel, K60L/E338L/N-YFP + K60L/E338L/C-YFP with no BiFC; right panel, differential interference contrast merged with CFP image shows 40% transfection efficiency. Red scale bar = 20μm. C) left panel, CFP; middle panel, K60E/E338K/N-YFP + K60E/E338K/C-YFP with BiFC; right panel, CFP/YFP merged image. Red scale bar = 20μm. D) F332A/F336A/N-YFP + F332A/F336A/C-YFP positive BiFC signal (green) at higher magnification to show detailed ER structure. Red scale bar = 10μm. Images are representative of entire fields of cells from two transfections.
3.4.3 FCS
Taken together, the confocal microscopy, BRET and BiFC results suggest that the K60L/E338L double mutation disrupts β2-AR self-association and plasma membrane expression. The F332A/F336A mutation also impaired plasma membrane expression, but did not impair BRET or BiFC. These results predict that the K60L/E338L mutant is monomeric and that the F332A/F336A mutant retains its ability to self-associate. This hypothesis was tested using FCS. FCS records the fluctuations in fluorescence intensity arising from individual fluorescent molecules in a temporal manner (reviewed in [28–30]). In FCS, fluorescence-tagged receptors freely diffusing within the membrane are excited by a laser and the emitted photons are recorded by a photon counting detector. Fluorescence-tagged receptors that associate with one another or are part of a larger protein complex will co-diffuse within the plasma membrane. The number of fluorescence-tagged receptors present in the complex can be determined using a photon counting histogram (PCH), which analyzes the amplitude of the fluorescence fluctuations to determine the number of fluorescent molecules present in the sample and determines the number of photon counts per molecule or molecular brightness [31]. The molecular brightness is proportional to the number of fluorescent molecules traveling together within a protein complex such that a monomer with a single fluorescent tag will have a brightness of x, a dimer 2×, tetramer 4× and so forth. The molecular brightness of fluorescence-tagged receptors known to be monomeric (CD-86) or known to form homodimers (CD-28) [32] can be used as controls to decode the monomeric/oligomeric size of WT and mutant β2-AR.
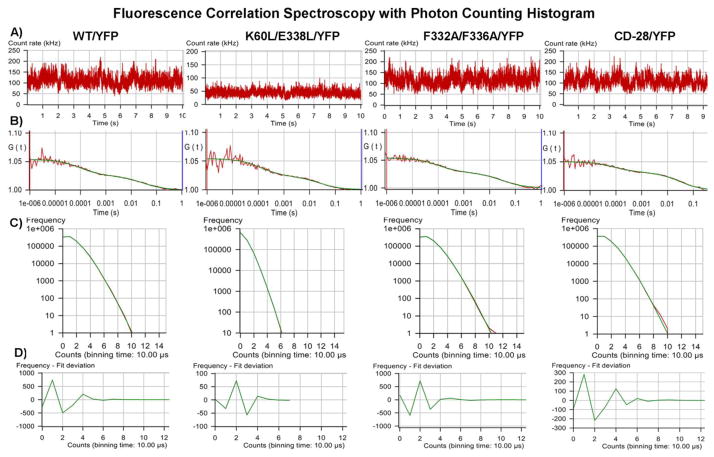
WT and mutant YFP-tagged receptors, freely diffusing within HEK293 cell membranes, were excited by a laser and the fluctuations in fluorescence intensity were recorded (figure 8A). Autocorrelation analyses of the fluorescence intensity traces produced biphasic autocorrelation curves (figure 8B) with a fast component related to the photo-physical properties of YFP (on the order of 100μs) and a slower component representing the translational diffusion of receptors within the membrane (on the order of 30ms, equivalent to 7.5 × 10⁻⁹ cm2/s). The amplitude of the autocorrelation function is inversely related to the number of fluorescent receptor complexes present in the sample. The amplitude (y-intercept) of the autocorrelation curve (figure 8B) was the same for all samples tested, indicating that each sample was expressing similar numbers of receptor complexes.
Figure 8.
FCS. Fluorescence fluctuation recordings were made in HEK293 cells expressing the indicated constructs. A) Recorded fluctuations in fluorescence intensity. B) Autocorrelation of fluorescence fluctuations. C) Photon counting histograms of the corresponding FCS recordings. To generate the histograms, each 10 second fluorescence intensity trace shown in (A) was broken down into one million 10μs intervals or bins. The number of bins is plotted on the y-axis and photon counts on the x-axis. D) Residuals of the PCH curve fit to a one component model. The residuals of the curve fit are less than two standard deviations and are randomly distributed about zero, indicating a good fit to the selected model.
The corresponding fluorescence intensity traces (shown in figure 8A) revealed an average photon count rate of 110kHz for WT/YFP, F332A/F336A/YFP and CD-28/YFP, and 55 kHz for K60L/E338L/YFP. Similarly, the corresponding photon counting histograms (PCH, figure 8C), registered twice as many photon counts for WT/YFP, F332A/F336A/YFP and CD-28/YFP as for K60L/E338L/YFP. Initially, the PCH data were fit to a one component model for a single fluorescent species. The residuals of the PCH curve fit (figure 8D) were randomly distributed about zero and less than 2 standard deviations. Reduced chi square values were close to unity (table 2), indicating the PCH data are a good fit to a one component model [31].
Table 2.
PCH molecular brightness values are reported as counts per second per molecule (CPSM). Reduced chi square values are reported for the PCH data fit to a one component model. Data represent the mean+/−sem for the number of cells examined (N).
| Fluorescence-tagged Receptors | Brightness CPSM | Reduced chi square | N |
|---|---|---|---|
| WT β2-AR | 19,342+/−822 | 0.99+/−0.08 | 7 |
| CD-28 dimer | 19,175+/−456 | 0.96+/−0.06 | 6 |
| CD-86 monomer | 9,364+/−390 | 1.04+/−0.10 | 12 |
| WT BiFC pair | 9,596+/−480 | 1.10+/−0.06 | 13 |
| K60L/E338L | 8,533+/−485 | 0.97+/−0.06 | 6 |
| F332A/F336A | 17,149+/−872 | 1.40+/−0.10 | 10 |
PCH molecular brightness values, expressed as counts per second per molecule (CPSM), are listed in table 2. WT β2-AR and the known dimer CD-28 displayed similar molecular brightness values, consistent with our previous FCS results for β2-AR homodimers [28]. The known monomer, CD-86, was half as bright as the known dimer CD-28. The WT BiFC pair, containing a single YFP tag, was half as bright as WT and similar to monomeric CD-86. The ER-retained K60L/E338L/YFP was half as bright as WT and was similar to monomeric CD-86. F332A/F336A/YFP was similar to WT/YFP and CD-28/YFP. Since PCH reports the average molecular brightness of all fluorescent species present in the sample [31], a molecular brightness value that is half of the known dimeric control sample (as observed for CD-86 and K60L/E338L) can only be produced by a population of receptors that is predominantly monomeric. On the other hand, a molecular brightness value equivalent to the known dimeric control sample could be produced either by a predominantly homodimeric population of WT β2-AR or by a mixture of monomers/dimers/tetramers in fixed proportions that yield an average molecular brightness equivalent to a dimer, such as 20%/70%/10% or 40%/40%/20%, respectively. Multi-component modeling of the PCH data to these fixed proportions of monomers/dimers/tetramers produced reduced chi square values greater than four or 15, respectively [28]. Fitting the PCH data to a one component homodimer model gave reduced chi square values close to unity (table 2). These results indicate that WT β2-AR and the ER-retained F332A/F336A mutant are predominantly homodimeric, while the K60L/E338L mutant remains monomeric within the ER.
3.5 Pharmacochaperone-mediated rescue
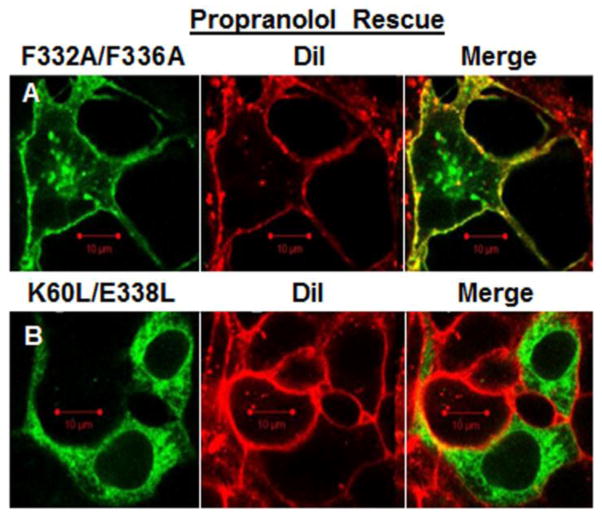
Both the K60L/E338L and the F332A/F336A mutant receptors were ER-retained, yet they exhibit very different structural properties in terms of their ability to form homodimers. The structural properties were investigated using pharmacochaperone-mediated rescue. Propranolol, a membrane-permeable β2-AR antagonist, was added to the culture media and the distribution of YFP-tagged receptors was evaluated. In contrast to the images of F332A/F336A/YFP in figures 2 and 7D where the receptors were ER-retained, in the presence of propranolol the F332A/F336A/YFP mutant was able to traffic to the plasma membrane and demonstrated co-localization with the DiI plasma membrane marker (figure 9A). However, the K60L/E338L/YFP mutant remained ER-retained in the presence of propranolol and did not co-localize with DiI (figure 9B).
Figure 9.
Propranolol rescue. HEK293 cells were incubated in the presence of 10uM propranolol for 24 hours following transfection with the indicated mutant receptors. A) Cells transfected with F332A/F336A/YFP (green, left panel) were labeled with the plasma membrane marker DiI (red, middle panel). Yellow in the merged image (right panel) shows F332A/F336A/YFP on the plasma membrane in the presence of propranolol. Red scale bar =10μm. B) Cells transfected with K60L/E338L/YFP (green, left panel) were labeled with the plasma membrane marker DiI (red, middle panel). The merged image (right panel) shows K60L/E338L/YFP retained in the ER in the presence of propranolol.
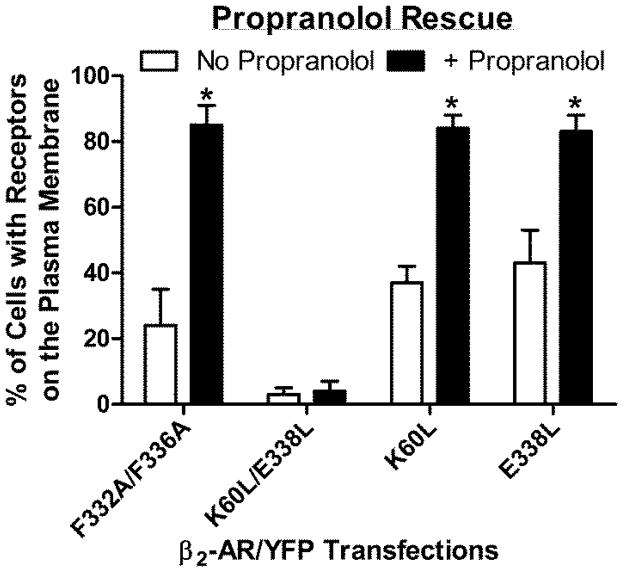
In order to quantify these results, transfected cells were cultured in the absence and presence of propranolol and visualized using confocal microscopy. The number of cells displaying YFP fluorescence co-localized with the DiI marker was recorded (figure 10). In the absence of propranolol, cells expressing K60L/E338L/YFP did not display YFP co-localization with DiI. A small percentage of the F332A/F336A/YFP expressing cells did show YFP co-localization with DiI, as did the single mutants K60L/YFP and E338L/YFP. Note that the percentage of cells with YFP/DiI co-localization (plasma membrane expression) is very similar to results obtained from whole cell radioligand binding (figure 3A). Following exposure to propranolol, approximately 85% of the cells showed YFP co-localization with the DiI marker for F332A/F336A/YFP, K60L/YFP and E338L/YFP. However, propranolol had no effect on the cellular distribution of K60L/E338L/YFP.
Figure 10.
Confocal microscopy was used to measure cell surface expression of YFP-tagged mutant receptors in the absence and presence of 10uM Propranolol. The percentage of cells exhibiting YFP co-localization with the DiI plasma membrane marker (as illustrated in figure 9) was used as a measure of propranolol rescue. Data represent the mean+/−SD from four different fields of cells (from independent transfections) with 15–20 cells/field. Student’s t-test *p<0.001 vs. no propranolol.
4. Discussion
While isolated and purified monomeric β2-AR have been reported to activate G proteins [33, 34] and a β2-AR crystal structure revealed a monomeric β2-AR in complex with a single G protein [35], it is difficult to ignore the plethora of evidence supporting the self-assembly of β2-AR into homodimeric or oligomeric complexes provided by studies using immunoprecipitation, BRET, FRET, BiFC, FRAP, TIRF, FCS, and others. Even so, homodimer formation remains a highly controversial topic [2], as little is known about the physiological function of class A GPCR homodimers and their organization in native tissues.
GPCR crystal structures have provided valuable information, but it is recognized that GPCR organization within the crystal lattice is influenced by the purification and crystallization process. Even so, a small handful of crystal structures have revealed GPCR dimers with interfaces similar to those predicted by mutagenesis, cross-linking and computer modeling studies (reviewed in [36]), suggesting that they may have physiological relevance and warrant further investigation. Such dimer interfaces include TMD1/2 and H8 as identified in a crystal structure of the β1-AR [10], the β2-AR crystal structure reported by Cherezov and colleagues [20], and a crystal structure of the closely related rhodopsin receptor [6]. On the other hand, crystal structures of chemokine and opioid receptors contain potential TMD4/5 and/or TMD5/6 dimer interfaces [8,12]. Thus it should be acknowledged that dimer interfaces could be a shifting network of interactions that may be receptor specific and may even be ligand specific [37]. With these caveats in mind, we investigated a potential TMD1/H8 dimer interface in β2-AR homodimer formation, as predicted by two of the β-AR crystal structures [10, 20], and studied its role in regulating plasma membrane expression of functional β2-AR.
The β2-AR crystal structure reported by Cherezov and colleagues predicts a TMD1-H8 homodimer interface involving K60 and E338 [20]. The same region of H8 is implicated in the β1-AR crystal structure, although the β1-AR crystal structure revealed a symmetrical H8 interface as well as TMD1/2 and TMD4/5 interfaces [10]. Cross-linking of cysteine residues within H8 of rhodopsin receptors in native disc membranes supports the physiological relevance of a potential H8-H8 interface [38]. The H8-H8 interface predicted by the β1-AR crystal structure involves K354/R355/L356. Experimental evidence supporting a role for H8 in the β1-AR dimer interface was provided by cross-linking of a substituted cysteine at position 355 [10]. Interestingly, the analogous residue in this region of H8 in the β2-AR is E338. In the present study, mutation of analogous residues in H8 of the β2-AR significantly decreased the BRET signal between donor and acceptor pairs attached downstream of H8 at the C-terminus of the receptor. Combining mutations in this region with a point mutation at the base of TMD1 further impaired dimer formation and halted plasma membrane targeting.
Single amino acid substitutions at K60 or E338 impaired cell surface expression and reduced the specific BRET ratio. The magnitude of the effect was enhanced by multiple mutations within these regions. These results suggest that the K60-E338 ionic linkage predicted by the β2-AR crystal structure is not absolute but that neighboring residues may participate. The important role of charged residues in these positions is highlighted by the partial restoration of trafficking and BRET signaling for the K60E/E338K double reverse mutation. At this point it is not known if the ER-retained receptors are fully functional. However, the ER-retained receptors with mutations at K60 or E338 appear to have a functional binding pocket as they have retained the ability to bind propranolol. One of the challenges of this type of study is to distinguish between mutations that produce defects in folding as opposed to defects in receptor dimerization. The best evidence that to suggest that the results observed with the K60l/E338L mutant are not simply a folding issue is the binding pocket for propranolol appears to remain intact, suggesting proper folding of the mutant receptor.
Several studies have provided evidence that dimerization is essential for the expression of functional monoamine receptors on the plasma membrane [27, 39, 40]. In the present study, a significant correlation was found between cell surface expression and the specific BRET ratio for mutations at the base of TMD1 and in the distal portion of H8, linking a potential TMD1/H8 dimer interface with ER export. This conclusion is supported by the BiFC results. No BiFC was observed for the ER-retained K60L/E338L mutant, indicating that this mutant does not self-associate. This result was verified using FCS with PCH, demonstrating that this mutant is monomeric. The C-terminal region of H8, implicated in β-AR dimer formation [10, 20], is located at the distal end of a highly conserved F(X)6LL motif previously suggested to play a role in ER export [22, 25, 26]. Interestingly, mutation of hydrophobic residues in the proximal region of H8, within the highly conserved F(X)6LL motif (F332/F336), produced a different result from mutation of polar/charged residues in the distal portion of H8 (Q337/E338). While mutations in both regions dramatically impaired cell surface expression, only mutation of polar/charged residues in the distal portion of H8 impaired BRET, suggesting a specific role for this region in homodimer formation. These results are in agreement with the crystal structures of the β1-AR and β2-AR, revealing the same polar/charged residues in the distal portion of H8 as contact points within the dimer interface [10, 20]. Positive BiFC was observed for the F332A/F336A mutant and was largely confined to the ER, providing direct visual conformation that dimer formation occurs within the ER. The BRET and BiFC results for the F332A/F336A mutation were further validated using FCS and PCH, which demonstrated that this mutant receptor is dimeric in the ER.
The F332A/F336A mutation did not impair dimerization, suggesting that these residues may play a role in protein folding, recognition by chaperone proteins, and/or association with COP II vesicles essential for ER export. These results are consistent with previous studies demonstrating a role for hydrophobic residues in the proximal portion of H8 in protein folding and ER export [22, 25, 26]. In each of these studies, membrane permeable antagonists were used to restore plasma membrane expression of mutant receptors. In the present study, propranolol effectively rescued plasma membrane expression of the dimer-competent F332A/F336A mutant. However, propranolol did not rescue the dimer-deficient K60L/E338L mutant, even though propranolol binding was not impaired. These results further substantiate the conclusion that TMD1 and H8 are important for β2-AR homodimer assembly, trafficking and expression of functional receptors on the plasma membrane.
GPCR homodimers have been reported to preassemble with G proteins in the ER, and a specific role for Gβγ in this process has been proposed (reviewed in [41]). Preassembly of the signaling complex and association with appropriate chaperone proteins play an important role in GPCR exit from the ER and trafficking to the plasma membrane [42]. Based on the crystal structure of the G-protein heterotrimer and initial GPCR crystal structures, it appeared that two receptors would be required to provide enough surface area to form the predicted docking interface (based on functional studies) with G-alpha and beta-gamma subunits of a single G-protein [43, 44]. 3D projection mapping of photo-activated rhodopsin shows the rhodopsin dimer more centrally positioned over the G-protein heterotrimer with both protomers contacting the G-protein in an asymmetrical manner [45–47]. G-protein docking simulations using the recently solved crystal structure of the β1-AR homodimer suggest that one protomer of the dimer is predominantly responsible for contacting the G-alpha subunit [10]. In an elegant series of experiments using mutant Gs proteins, Huang and colleagues reported a role for the second intracellular loop of the β2-AR in G-alpha activation and guanyl nucleotide exchange [48].Their model, based on the reported crystal structure of the β2-AR-G protein complex [35], shows one protomer of a β2-AR contacting the G protein alpha subunit, with the TMD1/H8 regions facing inward toward the beta-gamma subunits. If both protomers of a β2-AR homodimer physically associate with the G protein, then these models [35, 48] predict a TMD1/H8 homodimer interface as the TMD4/5 regions appear to be oriented away from the center of the G protein complex. These models are supported by the findings in the present study in which residues in TMD1 and H8 are proposed to play a role in homodimer formation.
Notable differences have been observed between β1-AR and β2-AR homodimers in terms of their stability [49] and monomer/dimer/tetramer equilibrium [50]. β2-AR have been reported to form tetramers following reconstitution into a model lipid bilayer [14], or to exist as a mixture of monomers, dimers and tetramers when expressed in recombinant cells [50]. In the present study, the FCS and PCH results suggest that β2-AR are predominantly homodimers, similar to our previous results with other monoamine receptors [3, 28, 51]. Thus our mutagenesis results favor the presence of a TMD1/H8 interface in the formation of β2-AR homodimers, without higher order oligomers. Since FCS only measures mobile proteins, the FCS results cannot exclude the possibility that higher order oligomers may form within regions of the plasma membrane where receptor mobility is more limited. However, the presence of higher order oligomers involving potential TMD4/5 or TMD5/6 interface(s) is not supported by a complete loss of BRET and BiFC signals observed for the K60L/E338L mutant.
Based on our results it is tempting to speculate a role for an interaction between residues in the distal portion of H8 with residues at the cytoplasmic side of TMD1, in similar fashion to the β2-AR crystal structure of Cherezov and colleagues [20]. However, we cannot exclude the possibility that mutating polar/charged residues at the base of TMD1 could have a more global impact on the overall organization of the TMD1 helix within the plasma membrane, potentially disrupting residues involved in a symmetric TMD1 dimer interface similar to the β1-AR crystal structure reported by Huang and colleagues [10].
5. Conclusion
In conclusion, this study provides biophysical evidence demonstrating specific roles for residues at the base of TMD1 and in the distal portion of H8 in the assembly of β2-AR homodimers. The striking correlation between the BRET ratio and cell surface expression provides supporting evidence potentially linking a TMD1/H8 interface with ER export and the expression of functional β2-AR on the plasma membrane.
Highlights.
Mutations that disrupt β2-Adrenergic Receptor (β2-AR) homodimerization.
Homodimer formation was evaluated using BRET, BiFC and FCS.
Transmembrane domain 1 (TMD1) and helix 8 (H8) regulate trafficking & homodimers.
A TMD1/H8 interface is linked with ER export and expression of functional β2-AR.
Acknowledgments
Funding for this work was provided in part by a grant from the National Institute of Mental Health MH086796 awarded to KHD.
Abbreviations
- GPRC
G protein-coupled receptor
- FCS
fluorescence correlation spectroscopy
- PCH
photon counting histogram
- BRET
bioluminescence resonance energy transfer
- BiFC
bimolecular fluorescence complementation
- β2-AR
beta2-adrenergic receptor
Footnotes
Competing interests: the authors have no competing interests.
Publisher's Disclaimer: This is a PDF file of an unedited manuscript that has been accepted for publication. As a service to our customers we are providing this early version of the manuscript. The manuscript will undergo copyediting, typesetting, and review of the resulting proof before it is published in its final citable form. Please note that during the production process errors may be discovered which could affect the content, and all legal disclaimers that apply to the journal pertain.
References
- 1.Herrick-Davis K. Functional significance of serotonin receptor dimerization. Exp Brain Res. 2013;230:375–386. doi: 10.1007/s00221-013-3622-1. [DOI] [PMC free article] [PubMed] [Google Scholar]
- 2.Ferré S, Casadó V, Devi LA, Filizola M, Jockers R, Lohse MJ, et al. G protein-coupled receptor oligomerization revisited: functional and pharmacological perspectives. Pharmacol Rev. 2014;66:413–434. doi: 10.1124/pr.113.008052. [DOI] [PMC free article] [PubMed] [Google Scholar]
- 3.Herrick-Davis K, Grinde E, Lindsley T, Teitler M, Mancia F, Cowan A, et al. Native Serotonin 5-HT2C Receptors are Expressed as Homodimers on the Apical Surface of Choroid Plexus Epithelial Cells. Mol Pharmacol. 2015;87:660–673. doi: 10.1124/mol.114.096636. [DOI] [PMC free article] [PubMed] [Google Scholar]
- 4.Ruprecht JJ, Mielke T, Vogel R, Villa C, Schertler GF. Electron crystallography reveals the structure of metarhodopsin I. EMBO J. 2004;23:3609–3620. doi: 10.1038/sj.emboj.7600374. [DOI] [PMC free article] [PubMed] [Google Scholar]
- 5.Salom D, Lodowski DT, Stenkamp RE, Le Trong I, Golczak M, Jastrzebska B, et al. Crystal structure of a photoactivated deprotonated intermediate of rhodopsin. Proc Natl Acad Sci. 2006;103:16123–16128. doi: 10.1073/pnas.0608022103. [DOI] [PMC free article] [PubMed] [Google Scholar]
- 6.Lodowski DT, Salom D, Le Trong IL, Teller DC, Ballesteros JA, Palczewski K, et al. Crystal packing analysis of rhodopsin crystals. J Struct Biol. 2007;158:455–462. doi: 10.1016/j.jsb.2007.01.017. [DOI] [PMC free article] [PubMed] [Google Scholar]
- 7.Park JH, Scheeter P, Hofmann KP, Choe HW, Ernst OP. Crystal structure of the ligand-free G protein-coupled receptor opsin. Nature. 2008;454:183–187. doi: 10.1038/nature07063. [DOI] [PubMed] [Google Scholar]
- 8.Manglik A, Kruse AC, Kobilka TS, Thian FS, Mathiesen JM, Sunahara RK, et al. Crystal structure of the mu-opioid receptor bound to a morphinan antagonist. Nature. 2012;485:321–326. doi: 10.1038/nature10954. [DOI] [PMC free article] [PubMed] [Google Scholar]
- 9.Wu H, Wacker D, Milemi M, Katritch V, Han GW, Vardy E, et al. Structure of the human κ-opioid receptor in complex with JDTic. Nature. 2012;485:327–332. doi: 10.1038/nature10939. [DOI] [PMC free article] [PubMed] [Google Scholar]
- 10.Huang J, Chen S, Zhang JJ, Huang XY. Crystal structure of oligomeric β1-adrenergic G protein-coupled receptors in ligand-free basal state. Nat Struct Mol Biol. 2013;20:419–425. doi: 10.1038/nsmb.2504. [DOI] [PMC free article] [PubMed] [Google Scholar]
- 11.Liang Y, Fotiadis D, Filipek S, Saperstein DA, Palczewski K, Engel A. Organization of the G protein-coupled receptors rhodopsin and opsin in native membranes. J Biol Chem. 2003;278:21655–21662. doi: 10.1074/jbc.M302536200. [DOI] [PMC free article] [PubMed] [Google Scholar]
- 12.Wu B, Chien EY, Mol CD, Fenalti G, Liu W, Katritch V, et al. Structure of the CXCR4 chemokine GPCR with small-molecule and cyclic peptide antagonists. Science. 2010;330:1066–1071. doi: 10.1126/science.1194396. [DOI] [PMC free article] [PubMed] [Google Scholar]
- 13.Guo W, Urizar E, Kralikava M, Mobarec JC, Shi L, Filizola M, et al. Dopamine D2 receptors form higher order oligomers at physiological expression levels. EMBO J. 2008;27:2293–2304. doi: 10.1038/emboj.2008.153. [DOI] [PMC free article] [PubMed] [Google Scholar]
- 14.Fung JJ, Deupi X, Pardo L, Yao Xj, Velez-Ruiz GA, Devree BT, et al. Ligand-regulated oligomerization of beta2-adrenoceptors in a model lipid bilayer. Embo J. 2009;28:3315–3328. doi: 10.1038/emboj.2009.267. [DOI] [PMC free article] [PubMed] [Google Scholar]
- 15.Guo W, Filizola M, Weinstein H, Javitch JA. Crosstalk in G protein-coupled receptors: changes at the transmembrane homodimer interface determine activation. Proc Natl Acad Sci. 2005;102:17495–17500. doi: 10.1073/pnas.0508950102. [DOI] [PMC free article] [PubMed] [Google Scholar]
- 16.Mancia F, Assur Z, Herman AG, Siegel R, Hendrickson WA. Ligand sensitivity in dimeric associations of the serotonin 5-HT2c receptor. EMBO Rep. 2008;9:363–369. doi: 10.1038/embor.2008.27. [DOI] [PMC free article] [PubMed] [Google Scholar]
- 17.Hu J, Thor D, Zhou Y, Lin T, Wang Y, McMillian SM, et al. Structural aspects of M3- muscarinic acetylcholine receptor dimer formation and activation. FASEB J. 2012;26:604–616. doi: 10.1096/fj.11-191510. [DOI] [PMC free article] [PubMed] [Google Scholar]
- 18.Johnston JM, Wang H, Provasi D, Filizola M. Assessing the relative stability of dimer interfaces in G protein-coupled receptors. PLoS Comp Biol. 2012;8:e1002649. doi: 10.1371/journal.pcbi.1002649. [DOI] [PMC free article] [PubMed] [Google Scholar]
- 19.Periole X, Knepp A, Sakmar TP, Marrink SJ, Huner T. Structural determinants of the supramolecular organization of G protein-coupled receptors in bilayers. J Am Chem Soc. 2012;134:10959–10965. doi: 10.1021/ja303286e. [DOI] [PMC free article] [PubMed] [Google Scholar]
- 20.Cherezov V, Rosenbaum DM, Hanson MA, Rassmusen SG, Thian FS, Kobilka TS, et al. High-resolution crystal structure of an engineered human beta2-adrenergic G protein-coupled receptor. Science. 2007;318:1258–1265. doi: 10.1126/science.1150577. [DOI] [PMC free article] [PubMed] [Google Scholar]
- 21.Wüller S, Wiesner B, Löffler A, Furkert J, Krasue G, Hermosilla R, et al. Pharmacochaperones post-translationally enhance cell surface expression by increasing conformational stability of wild-type and mutant vasopressin V2 receptors. J Biol Chem. 2004;279:47254–47263. doi: 10.1074/jbc.M408154200. [DOI] [PubMed] [Google Scholar]
- 22.Sawyer GW, Ehlert FJ, Shults CA. A conserved motif in the membrane proximal c-terminal tail of human muscarinic M1 acetylcholine receptors affects plasma membrane expression. J Pharmacol Exp Ther. 2010;332:76–86. doi: 10.1124/jpet.109.160986. [DOI] [PMC free article] [PubMed] [Google Scholar]
- 23.Duvernay MT, Dong C, Zhang X, Robitaille M, Hébert TE, Wu G. A single conserved leucine residue on the first intracellular loop regulates ER export of G protein-couple receptors. Traffic. 2009;10:552–566. doi: 10.1111/j.1600-0854.2009.00890.x. [DOI] [PMC free article] [PubMed] [Google Scholar]
- 24.Duvernay MT, Zhou F, Wu G. A conserved motif for the transport of G protein-coupled receptors from the endoplasmic reticulum to the cell surface. J Biol Chem. 2004;279:30741–30750. doi: 10.1074/jbc.M313881200. [DOI] [PubMed] [Google Scholar]
- 25.Thielen A, Oueslati M, Hermosilla R, Krause G, Oksche A, Rosenthal W, et al. The hydrophobic amino acid residues in the membrane-proximal C tail of the G protein-coupled vasopressin V2 receptor are necessary for transport-competent receptor folding. FEBS Let. 2005;579:5227–5235. doi: 10.1016/j.febslet.2005.08.043. [DOI] [PubMed] [Google Scholar]
- 26.Duvernay MT, Dong C, Zhang X, Zhou F, Nichols CD, Wu G. Anterograde trafficking of G protein-coupled receptors: function of the c-terminal F(X)6LL motif in export from the endoplasmic reticulum. Mol Pharmacol. 2009;75:751–761. doi: 10.1124/mol.108.051623. [DOI] [PMC free article] [PubMed] [Google Scholar]
- 27.Salahpour A, Angers S, Mercier JF, Lagace M, Marullo S, Bouvier M. Homodimerization of the beta 2-adrenergic receptor as a pre-requisite for cell surface targeting. J Biol Chem. 2004;279:33390–33339. doi: 10.1074/jbc.M403363200. [DOI] [PubMed] [Google Scholar]
- 28.Herrick-Davis K, Grinde E, Cowan A, Mazurkiewicz JE. Fluorescence correlation spectroscopy analysis of serotonin, adrenergic, muscarinic, and dopamine receptor dimerization: the oligomer number puzzle. Mol Pharmacol. 2013;84:630–642. doi: 10.1124/mol.113.087072. [DOI] [PMC free article] [PubMed] [Google Scholar]
- 29.Elson EL. Fluorescence correlation spectroscopy: past, present, future. Biophys J. 2011;101:2855–2870. doi: 10.1016/j.bpj.2011.11.012. [DOI] [PMC free article] [PubMed] [Google Scholar]
- 30.Herrick-Davis K, Mazurkiewicz JE. Fluorescence correlation spectroscopy and photon-counting histogram analysis of receptor-receptor interactions. Methods Cell Biol. 2013;117:181–196. doi: 10.1016/B978-0-12-408143-7.00010-4. [DOI] [PubMed] [Google Scholar]
- 31.Müller JD, Chen Y, Gratton E. Resolving heterogeneity on the single molecular level with the photon-counting histogram. Biophys J. 2000;78:474–486. doi: 10.1016/S0006-3495(00)76610-0. [DOI] [PMC free article] [PubMed] [Google Scholar]
- 32.Sanchez-Lockhart M, Rojas AV, Fettis MM, Bauserman R, Higa TR, Miao H, et al. T cell receptor signaling can directly enhance the avidity of CD28 ligand binding. PLoS One. 2014;9:e89263. doi: 10.1371/journal.pone.0089263. [DOI] [PMC free article] [PubMed] [Google Scholar]
- 33.Bayburt TH, Leitz AJ, Xie G, Oprian DD, Sligar SG. Transducin activation by nanoscale lipid bilayers containing one and two rhodopsins. J Biol Chem. 2007;282:14875–14881. doi: 10.1074/jbc.M701433200. [DOI] [PubMed] [Google Scholar]
- 34.Whorton MR, Bokoch MP, Rasmussen SG, Huang B, Zare RN, Kobilka B, Sunahara RK. A monomeric G protein-coupled receptor isolated in a high-density lipoprotein particle efficiently activates its G protein. Proc Natl Acad Sci. 2007;104:7682–7687. doi: 10.1073/pnas.0611448104. [DOI] [PMC free article] [PubMed] [Google Scholar]
- 35.Rasmussen SG, DeVree BT, Zou Y, Kruse AC, Chung KY, Kobilka TS, Thian FS, Chae PS, Pardon E, Calinski D, Mathiesen JM, Shah ST, Lyons JA, Caffrey M, Gellman SH, Steyaert J, Skiniotis G, Weis WI, Sunahara RK, Kobilka BK. Crystal structure of the β2 adrenergic receptor-Gs protein complex. Nature. 2011;477:549–555. doi: 10.1038/nature10361. [DOI] [PMC free article] [PubMed] [Google Scholar]
- 36.Provasi D, Boz MB, Johnston JM, Filizola M. Preferred supramolecular organization and dimer interfaces of opioid receptors from simulated self-association. PLoS Comput Biol. 2015;11:e1004148. doi: 10.1371/journal.pcbi.1004148. [DOI] [PMC free article] [PubMed] [Google Scholar]
- 37.Shan J, Khelashvili G, Mondal S, Mehler EL, Weinstein H. Ligand-dependent conformations and dynamics of the serotonin 5-HT(2A) receptor determine its activation and membrane-driven oligomerization properties. PLoS Comput Biol. 2012;8(4):e1002473. doi: 10.1371/journal.pcbi.1002473. [DOI] [PMC free article] [PubMed] [Google Scholar]
- 38.Knepp AM, Periole X, Marrink SJ, Sakmar TP, Huber T. Rhodopsin forms a dimer with cytoplasmic helix 8 contacts in native membranes. Biochemistry. 2012;51:1819–1821. doi: 10.1021/bi3001598. [DOI] [PMC free article] [PubMed] [Google Scholar]
- 39.Herrick-Davis K, Weaver BA, Grinde E, Mazurkiewicz JE. Serotonin 5-HT2C receptor homodimer biogenesis in the endoplasmic reticulum: real-time visualization with confocal fluorescence resonance energy transfer. J Biol Chem. 2006;281:27109–27116. doi: 10.1074/jbc.M604390200. [DOI] [PubMed] [Google Scholar]
- 40.Canals M, Lopez-Gimenez JF, Milligan G. Cell surface delivery and structural reorganization by pharmacological chaperones of an oligomerization-defective α1b-adrenoceptor mutant demonstrates membrane targeting of GPCR oligomers. Biochem J. 2009;417:161–172. doi: 10.1042/BJ20081227. [DOI] [PMC free article] [PubMed] [Google Scholar]
- 41.Dupré DJ, Robitaille M, Rebois RV, Hébert TE. The role of Gbetagamma subunits in the organization, assembly, and function of GPCR signaling complexes. Annu Rev Pharmacol Toxicol. 2009;49:31–56. doi: 10.1146/annurev-pharmtox-061008-103038. [DOI] [PMC free article] [PubMed] [Google Scholar]
- 42.Dupré DJ, Robitaille M, Ethier N, Villeneuve LR, Mamarbachi AM, Hébert TE. Seven transmembrane receptor core signaling complexes are assembled prior to plasma membrane trafficking. J Biol Chem. 2006;281(45):34561–34573. doi: 10.1074/jbc.M605012200. [DOI] [PubMed] [Google Scholar]
- 43.Lambright DG, Sondek J, Bohm A, Skiba NP, Hamm HE, Sigler PB. The 2.0 A crystal structure of a heterotrimeric G protein. Nature. 1996 Jan 25;379(6563):311–9. doi: 10.1038/379311a0. [DOI] [PubMed] [Google Scholar]
- 44.Filipek S, Krzysko KA, Fotiadis D, Liang Y, Saperstein DA, Engel A, Palczewski K. A concept for G protein activation by G protein-coupled receptor dimers: the transducin/rhodopsin interface. Photochem Photobiol Sci. 2004;3:628–638. doi: 10.1039/b315661c. [DOI] [PubMed] [Google Scholar]
- 45.Jastrzebska B, Ringler P, Palczewski K, Engel A. The rhodopsin-transducin complex houses two distinct rhodopsin molecules. J Struct Biol. 2013;182:164–172. doi: 10.1016/j.jsb.2013.02.014. [DOI] [PMC free article] [PubMed] [Google Scholar]
- 46.Jastrzebska B, Orban T, Golczak M, Engel A, Palczewski K. Asymmetry of the rhodopsin dimer in complex with transducin. FASEB J. 2013;27:1572–1584. doi: 10.1096/fj.12-225383. [DOI] [PMC free article] [PubMed] [Google Scholar]
- 47.Jastrzebska B, Ringler P, Lodowski DT, Moiseenkova-Bell V, Golczak M, Müller SA, Palczewski K, Engel A. Rhodopsin-transducin heteropentamer: three-dimensional structure and biochemical characterization. J Struct Biol. 2011;176:387–394. doi: 10.1016/j.jsb.2011.08.016. [DOI] [PMC free article] [PubMed] [Google Scholar]
- 48.Huang J, Sun Y, Zhang JJ, Huang XY. Pivotal role of extended linker 2 in the activation of Gα by G protein-coupled receptor. J Biol Chem. 2015 Jan 2;290(1):272–83. doi: 10.1074/jbc.M114.608661. [DOI] [PMC free article] [PubMed] [Google Scholar]
- 49.Dorsch S, Klotz KN, Engelhardt S, Lohse MJ, Bünemann M. Analysis of receptor oligomerization by FRAP microscopy. Nat Methods. 2009;6:225–230. doi: 10.1038/nmeth.1304. [DOI] [PubMed] [Google Scholar]
- 50.Calebiro D, Rieken F, Wagner J, Sungkaworn T, Zabel U, Borzi A, Cocucci E, Zürn A, Lohse MJ. Single-molecule analysis of fluorescently labeled G-protein-coupled receptors reveals complexes with distinct dynamics and organization. Proc Natl Acad Sci. 2013;110:743–748. doi: 10.1073/pnas.1205798110. [DOI] [PMC free article] [PubMed] [Google Scholar]
- 51.Herrick-Davis K, Grinde E, Lindsley T, Cowan A, Mazurkiewicz JE. Oligomer size of the serotonin 5-HT2C receptor revealed by fluorescence correlation spectroscopy with photon counting histogram analysis: evidence for homodimers without monomers or tetramers. J Biol Chem. 2012;287:23604–23614. doi: 10.1074/jbc.M112.350249. [DOI] [PMC free article] [PubMed] [Google Scholar]


