Figure 1.
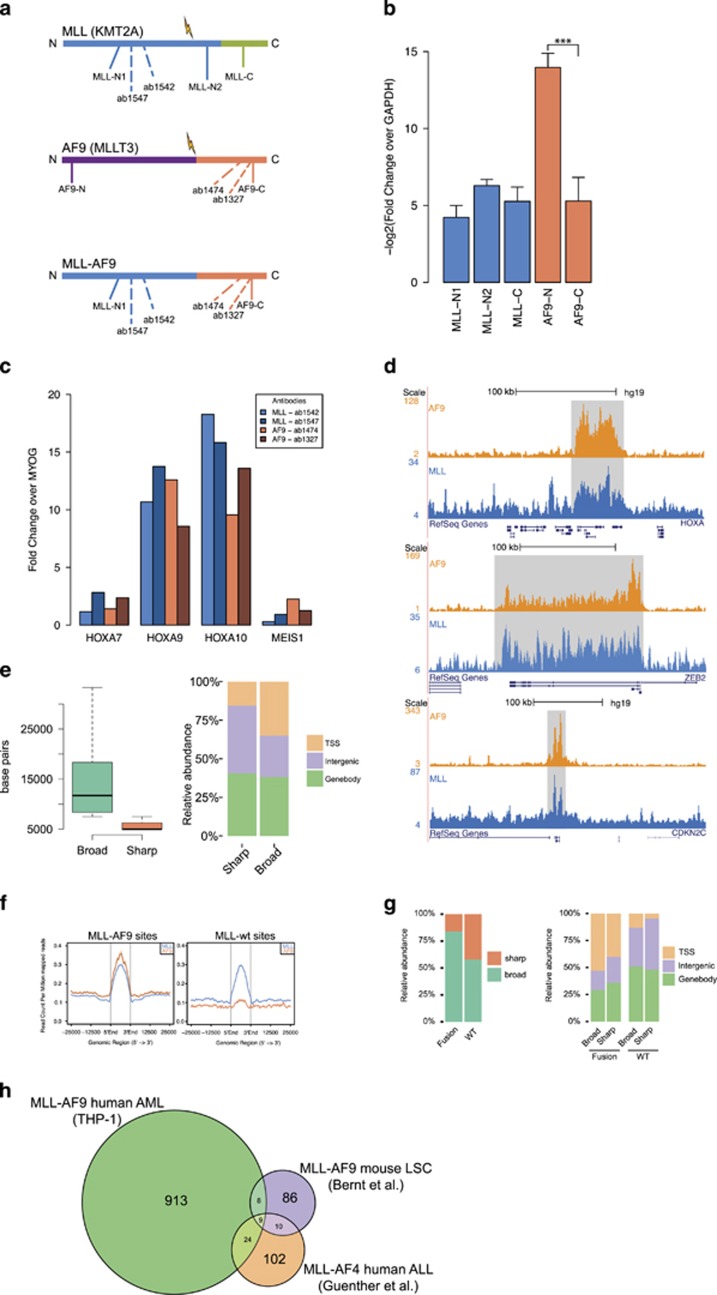
Genome-wide binding patterns of MLL and AF9 in THP-1 cells. (a) Schematic representation of MLL, AF9 and MLL-AF9. Antibody binding locations are indicated with dotted lines, primer regions used in panel (b) with a filled line. (b) Reverse transcriptase–qPCR experiments (n=5) in THP-1 cells with primers against the C and N termini of MLL and AF9 normalized to GAPDH. The N-terminus of AF9 is not expressed, indicating that there is no WT expression of AF9 in this cell line. ***P<0.001 (Welch’s t-test). (c) ChIP-qPCR experiments using two anti-MLL-1 and two anti-AF9 antibodies in THP-1 cells and primers for HOXA7, 9, 10 and MEIS1. (d) ChIP-seq overview of MLL and AF9 binding at the HOXA, ZEB2 and CDKN2C loci in THP-1 cells. (e) Classification of MLL and AF9 binding events in ‘broad’ and ‘sharp’ modes. Left: boxplot showing dispersion of peak lengths. Right: barplot showing genomic distributions. (f) Classification of MLL-AF9 and MLL WT binding events. Average profiles showing ChIP-seq signal intensities for MLL-AF9 and MLL WT binding events in THP-1 cells. (g) Left: Distribution of MLL-AF9 and MLL WT binding events in the ‘broad’ and ‘sharp’ modes. Right: Genomic distribution of MLL-AF9 and MLL WT binding events in the ‘broad’ and ‘sharp’ modes. (h) Venn diagram illustrating the overlap between our human (THP-1) MLL-AF9 AML targets, MLL-AF9 targets in a mouse LSC model (Bernt et al.7) and human MLL-AF4 ALL targets (Guenther et al.20).

