

Abstract
B-lymphocytes play a key role in type 1 diabetes (T1D) development by serving as a subset of APC preferentially supporting expansion of autoreactive pathogenic T-cells. As a result of their pathogenic importance, B-lymphocyte-targeted therapies have received considerable interest as potential T1D interventions. Unfortunately, B-lymphocyte-directed T1D interventions tested to date failed to halt β-cell demise. IgG autoantibodies marking humans at future T1D risk indicate B-lymphocytes producing them have undergone the affinity maturation processes of class switch recombination (CSR) and possibly somatic hypermutation (SHM). This study found that CRISPR/Cas9-mediated ablation of the Aicda gene required for CSR/SHM induction, inhibits T1D development in the NOD mouse model. The Aicda encoded AID molecule induces genome-wide DNA breaks that, if not repaired through RAD51-mediated homologous recombination (HR), result in B-lymphocyte death. Treatment with the RAD51 inhibitor 4,4′-diisothiocyanatostilbene-2, 2′-disulfonic acid (DIDS) also strongly inhibited T1D development in NOD mice. Both the genetic and small molecule-targeting approaches expanded CD73+ B-lymphocytes exerting regulatory activity suppressing diabetogenic T-cell responses. Hence, an initial CRISPR/Cas9 mediated genetic modification approach has identified the AID/RAD51 axis as a target for a potentially clinically translatable pharmacological approach that can block T1D development by converting B-lymphocytes to a disease inhibitory CD73+ regulatory state.
Introduction
While the autoimmune destruction of insulin producing pancreatic β-cells underlying the development of type 1 diabetes (T1D)5 is ultimately mediated by the combined activity of CD4+ and CD8+ T-cells, it is clear in the NOD mouse model, and also likely humans, that B-lymphocytes play an additional key pathogenic role (1-9). Studies in NOD mice indicate B-lymphocytes contribute to T1D by being the subset of APC that most efficiently support the expansion of pathogenic T-cell responses (10-12). This is due to the presence of B-lymphocytes expressing plasma membrane bound Ig molecules capable of efficiently capturing and internalizing β-cell autoantigens for subsequent processing and presentation to diabetogenic T-cells (10, 12). Similar populations of pathogenic B-lymphocytes also likely contribute to T1D development in humans given the presence of circulating β-cell antigen-specific autoantibodies that are critical biomarkers for identifying individuals at high future disease risk (13).
Most autoantibodies in humans with, or at risk for, T1D are of an IgG isotype indicating the B-lymphocytes producing them have undergone affinity maturation (13). Affinity maturation is the process occurring within germinal centers (GCs) by which B-lymphocytes undergo Ig diversification and clonal selection. Ig diversification occurs through somatic hypermutation (SHM) and class switch recombination (CSR), while clonal selection results from competitive interaction with follicular helper T-cells (Tfh) (14). Selective pressures within GCs result in the preferential expansion of B-lymphocytes with greater affinity for their cognate antigen. In autoimmune diseases, such as T1D, aberrant selection processes lead to expansion of self-reactive B-lymphocytes, which may become autoantibody-secreting cells or retain their surface Ig to serve as potentially more effective APC (15). Although previous findings suggest affinity maturation is important to T1D pathogenesis (16), the significance of CSR/SHM processes to disease progression has yet to be elucidated. Furthermore, it remains unclear whether B-lymphocytes must undergo CSR/SHM to become effective autoreactive APC supporting T1D pathogenesis.
Due to their role in supporting pathogenic T-cell responses, there has been considerable interest in determining if B-lymphocyte-targeted approaches could provide an effective T1D intervention. A previous clinical trial found transient treatment with the B-lymphocyte-depleting, CD20-specific Rituximab antibody, allowed for early (1 yr), but not long-term (2 yr) preservation of C-peptide production in recent onset T1D patients (17). The lack of long-term protection may be at least partially attributable to the rebound of B-lymphocytes following transient Rituximab treatment. However, in NOD mice, pancreatic islet-infiltrating B-lymphocytes lose cell surface expression of CD20, and thus are rendered resistant to depletion by a Rituximab-like murine anti-CD20 antibody (18). These results indicate a need to identify alternative strategies that may provide a more effective B-lymphocyte-directed T1D intervention approach.
In the current study, we evaluated the contribution of CSR/SHM to T1D development and if specifically targeting B-lymphocytes undergoing these processes could provide an effective therapeutic intervention. As a first step, we utilized CRISPR-Cas9 technology to directly ablate in NOD mice the activation-induced cytidine deaminase (Aicda) gene necessary for initiating CSR/SHM processes (19-21). Aicda ablation significantly inhibited T1D development.
The Aicda-encoded activation-induced cytidine deaminase protein (AID) initiates SHM and CSR by inducing point mutations and double stranded DNA breaks (DSBs) in Ig gene sequences. Additionally, AID generates DSBs elsewhere throughout the genome (22, 23), that are normally repaired by RAD51 complex-mediated homologous recombination (HR). In the absence of HR, B-lymphocytes in which SHM/CSR has been initiated undergo cell death (23). The small molecule 4,4′-diisothiocyanatostilbene-2, 2′-disulfonic acid (DIDS) inhibits RAD51-mediated HR (23). DIDS has been used as a model agent in previous studies indicating RAD51 blockade could be considered as an intervention for eliminating AID-positive B-cell lymphomas (23). Here we utilized DIDS treatment to determine whether targeting the AID/RAD51 axis could provide a B-lymphocyte-directed intervention for T1D. Interestingly, both genetic and DIDS-mediated disruption of the AID/RAD51 axis increased numbers of CD73+ B-lymphocytes exerting regulatory processes actively suppressing T1D. Together these studies indicate therapies capable of expanding regulatory B-lymphocytes, potentially including those targeting affinity maturation processes, may ultimately represent clinically translatable T1D intervention strategies.
Materials and Methods
Mice
NOD and C57BL/6J (B6) mice are maintained at The Jackson Laboratory under specific pathogen free conditions. Lymphocyte-deficient NOD.Cg-PrkdcscidEmv30b/Dvs (NOD-scid) mice have been previously described (24). B6.Cg-Aicda<tm1Hon>/HonRbrc (B6.Aicda-/-) were kindly provided to KDM by Dr. Tasuku Honjo, Graduate School of Medicine, Kyoto University. CRISPR-Cas9 technology was used to directly generate NOD.Aicda-/- mice by cytoplasmic microinjection of NOD/ShiLtDvs zygotes with 100 ng/μL Cas9 mRNA and 50 ng/μL of the following sgRNA, with the capitalized letters being the compliment to the targeted genomic sequence: 5′ - gaaattaatacgactcactataggAGTCACGCTGGAGACCGATAgttttagagctagaaatagc - 3′ or 5′ - gaaattaatacgactcactataggACTTCTTTTGCTTCATCAGAgttttagagctagaaatagc - 3′, respectively targeting exon 1 or exon 2 of Aicda (Supplementary Fig. 1a). The exon 1 and exon 2 sgRNAs were respectively microinjected into 47 zygotes and 39 zygotes. These microinjected zygotes were then respectively transplanted into three and two recipient females. Tail DNA from surviving progeny was sequenced and identified 100% and 14.3% targeting efficiency for exon 1 (14/14) and exon 2 (2/14). Mosaic founder mice identified as carrying a mutation in the targeted region of Aicda were backcrossed to NOD/ShiLtDvs. The resulting N1 progeny were screened for germline transmitted mutations by PCR amplification of exon 1 with the following primers: 5′ – TCACACAACAGCACTGAAGC – 3′ and 5′ – ACCCAAAAGACCTGAGCAGA – 3′ or exon 2 with the following primers: 5′ – CGCTCAGCTACCTTGCCTAT – 3′ and 5′ – CGAAGTCCAGTGAGCAGGA – 3′. PCR products were purified and analyzed by sequencing on an ABI 3730 DNA analyzer (Applied Biosystems, Inc.) using the forward or reverse primer. Mutant sequences were separated from WT using the PolyPeakParser package (25) for R. A 2bp deletion along with a 309bp insertion was selected for a line targeting exon 1 (referred to as Line 1 in the text, formal name: NOD/ShiLtDvs-Aicda<em1Cml>/Dvs) and a 13bp deletion was selected for a line targeting exon 2 (referred to as Line 26 in the text, formal name: NOD/ShiLtDvs-Aicda<em2Cml>/Dvs). N1 mutants were intercrossed to fix the mutations to homozygosity after which lines were maintained by brother-sister matings. Mutant mice were genotyped by amplification length polymorphisms using the same primers used for sequencing (Supplementary Fig. 1b). Mice were age and sex matched for experimentation, but no specific randomization method was performed to form experimental groups. The Jackson Laboratory's Institutional Animal Care and Use Committee approved all protocols involving mice.
RT-PCR and Gene Expression analysis
B-lymphocytes were purified from 8-week-old female NOD or B6 mice. Total RNA was extracted using RNeasy Micro kit (Qiagen). Primers for Aicda RT-PCR (26) are 5′ – CAGGGACGGCATGAGACCT – 3′ and 5′ – TCAGCCTTGCGGTCTTCACA – 3′ and Gapdh are 5′ – GAGAAACCTGCCAAGTATGATGAC – 3′ and 5′ – TGATGGTATTCAAGAGAGTAGGGAG – 3′ (27). RNA was used to synthesize cDNA using MessageSensor RT kit (ThermoFisher) and Random decamers (Invitrogen). Power SyBR Green (Applied Biosystems) was used to determine the expression of Aicda and Gapdh. qPCR was run using Applied Biosystems ViiA7 and data was analyzed by A&B RUO software.
Monitoring of T1D Development
Development of T1D was assessed by weekly monitoring of glycosuria with Ames Diastix (Bayer), with disease onset defined by two consecutive readings of ≥0.25% (corresponds to a blood glucose of ≥300 mg/dl).
Histological Assessment of Insulitis
Quantitative mean insulitis scores were determined using the previously described calculation method (28). Briefly, Bouin's fixed pancreata were sectioned at three non-overlapping levels. Slides were stained with aldehyde fuchsin and H&E. Islets were scored by a blinded observer as follows: 0, no visible lesions; 1, peri-insular non-invasive leukocytic aggregates; 2, <25% islet destruction; 3, 25-75% islet destruction; 4, 75-100% islet destruction. The final score was determined by dividing the accumulative score for each pancreas by the number of total islets (at least 20 per mouse) examined. If no β-cell containing islets were found across three sections, the analyzed mouse received an insulitis score of 4. The final insulitis score incorporates the proportion of islets in analyzed mice that had undergone each level of destruction.
Islet Associated Leukocyte Isolation
Infiltrating islet associated leukocytes were isolated for flow cytometry as previously described (18).
In vitro Class Switch Recombination Assay
Splenic B-lymphocytes were purified using anti-CD43 microbeads (Miltenyi) according to the manufacturer's protocol. Purified B-lymphocytes were cultured at a concentration of 1×10⁶ cells per mL in RPMI 1640 (Gibco) supplemented with 2mM L-Glutamine (Gibco), 71.5 μM 2-mercaptoethanol (Fisher Scientific BP176-100), 100 U/mL penicillin (Sigma), 100 μg/mL streptomycin (Sigma) and 10% (v/v) heat-inactivated FBS (Atlanta Biologicals) under stimulation with recombinant murine IL-4 (25 ng/mL, PeproTech) and αCD40 (1 μg/mL, BD Biosciences) or LPS (25 μg/mL, Sigma-Aldrich) at 37°C (5% CO2) for 48 hours. At 48 hours, cultures were re-stimulated as described above. At 72 hours, cultures were diluted with media back to 1×10⁶ cells/mL. Class switching to IgG1 isotype was quantified by flow cytometric analysis after 96 total hours in culture.
Flow Cytometry
Leukocytes among indicated samples were phenotyped by flow cytometry using LSRII SORP (BD Biosciences) or Attune Cytometer (ThermoFisher Scientific) instrumentation and data analyzed using FlowJo software (FlowJo, LLC). For Aicda-/- experiments, single cell suspensions of splenocytes were first lysed with Gey's Buffer to remove red blood cells as previously described (29). For all experiments, either propidium iodide or DAPI were used for live/dead discrimination. All analysis was done on gated singlets – live – cells (Gating strategies shown in Supplementary Fig. 2A and 2B). For DIDS-based experiments, prior to singlet/live gating, TER-119+ cells were excluded (Supplementary Fig. 2C) via gating strategies in lieu of lysis procedures. Fluorochrome conjugated antibodies (clones) used for these studies were purchased from BD Biosciences: CD95 (J02), GL-7 (GL7), CD43 (S7), CD69 (H1.2F3), CD21 (7G6), CD45.1 (A20), CD62L (MEL-14), CD8a (53-6.7), CD19 (1D3), B220 (RA3-6B2), CD4 (GK1.5), CD23 (B3B4), TER-119 (TER119), Streptavidin; From BioLegend: CXCR5 (L138-D7), CD21 (7G6), IgD (11-26c.2a), CD80 (16-10A1), GL-7 (GL7), CD73 (TY/11.8), CD39 (Duha59), CD45.1 (A20), PD-1 (RMP1-30), PD-L2 (TY25), CD4 (GK1.5), CD23 (B3B4), B220 (RA3-6B2), TCRβ (H57-597); From eBiosciences: CD19 (1D3), IgM (II/41), CD45.1 (A20), CD44 (IM7); From Tonbo Biosciences: CD8α (53-6.7), CD19 (1D3), CD16/CD32 (2.4G2). From Southern Biotech: IgG1 (1070-09). Splenic B-lymphocyte subsets were characterized by flow cytometry as previously described (30).
Serum Ig Isotype ELISA
Quantification of serum Ig isotypes was performed as described (31). Coating antibodies were as follows: IgG1, IgG2b, IgG3 and IgM (Southern Biotech). Detection antibody was goat anti-mouse κ coupled to alkaline phosphatase (SouthernBiotech). Antibody standards included IgG1 and IgG2b (Southern Biotech) and IgG3 and IgM (Sigma-Aldrich). Plates were analyzed using an Infinite M200 Pro running Magellan 7.0 software (Tecan).
Adoptive Transfers
Splenic B-lymphocytes and T-cells were purified by negative depletion of CD11b+, CD11c+, TER-119+, CD3ε+ populations and in some experiments CD73+ (for B-lymphocyte purification) or CD11b+, CD11c+, TER-119+ and B220+ cells (for T-cell purification), using biotin-conjugated antibodies and streptavidin microbeads (Miltenyi). NOD-scid recipients were intravenously (i.v) injected with indicated B-lymphocytes and/or T-cells and monitored for T1D development. Specific biotinylated antibodies used from BD Biosciences were: CD11b (M1/70), CD11c (HL3), CD3ε (145-2C11), TER-119 (TER119), B220 (RA3-6B2). CD73 (TY/11.8) was obtained from BioLegend.
CD73+ B-lymphocyte – mediated T-cell Suppression Assay
B-lymphocytes from 6-8 week old NOD.Aicda-/- or NOD mice were first purified from pooled spleens and PLNs by negative-depletion of CD11b+, CD11c+, CD3ε+ and TER-119+ cells using Biotin Binder Dynabeads (Invitrogen). CD73+ and CD73- B-lymphocytes from the purified pools were then sorted directly into Heat-Inactivated HyClone FBS (GE Healthcare Life Sciences) using FACSAriaII SORP sorter (BD Biosciences) equipped with an 85μm nozzle. CD4+ CD73- T-cells were purified from spleens of 6-8 week old NOD mice by negative depletion of CD11b+, CD11c+, TER-119+, B220+, CD8+ and CD73+ cells using streptavidin microbeads (Miltenyi) and antibodies already described above. Purified CD4+ CD73- T-cells were labeled with 5 μM Cell Proliferation Dye eFluor670 (eBiosciences). Sorted B-lymphocytes and labeled T-cells were washed with serum-free XVIVO-20 medium (Lonza) three times to remove residual serum and co-cultured under stimulation with soluble anti-CD40 (1 μg/mL, BD Biosciences), plate-bound anti-CD3ε (5 μg/mL, BD Biosciences) and soluble anti-CD28 (2 μg/mL, BD Biosciences) in the presence of 10 μM AMP (Sigma-Aldrich) and 0 or 100 μM α β-methyleneadenosine 5′-diphosphate (APCP, Sigma-Aldrich) in serum-free XVIVO-20 medium supplemented with 10 mM HEPES (Lonza), 1 mM sodium pyruvate (Gibco), 71.5 μM 2-mercaptoethanol (Fisher Scientific), 100 U/mL penicillin (Sigma-Aldrich), 100 μg/mL streptomycin (Sigma-Aldrich) and non-essential amino acids (Lonza) at 37°C for 4 days. T-cell proliferation was assessed by flow cytometry and data analyzed using FlowJo software. Percent suppression was calculated relative to the mean Proliferation Index of T-cells in the presence of CD73- B-lymphocytes with 0 μM AMP and 0 μM APCP.
ELISA Measurement of IL-10 production
CD73+ or CD73- B-lymphocytes were sorted as described above and cultured at 5.0×10⁵ cells/ mL in XVIVO-20 medium with 0 or 10 μg/mL LPS (Sigma-Aldrich) for 3 days. IL-10 concentration in culture supernatants was determined using the Mouse IL-10 ELISA MAX kit (BioLegend).
DIDS Treatments
Beginning at six, eight, or ten-weeks of age NOD female mice were injected i.p. weekly with 0, 10, 50 mg/Kg of DIDS (Santa Cruz Biotechnology, CAS 67483-13-0) for the indicated periods of time. Vehicle was 0.1 M potassium bicarbonate.
IAA Status
Serum insulin autoantibodies were detected as described as part of the International Workshop on Lessons From Animal Models for Human Type 1 Diabetes (32).
Immunoglobulin Repertoire Library Prep
Library preparation and data analysis for Ig repertoire sequencing was performed as previously described (33) with minor alterations. Briefly, female NOD/ShiLtDvs mice received weekly DIDS (50 mg/kg) or vehicle treatment from 8-16 weeks of age, after which, PLN B-lymphocytes (CD45.1+ CD19+ B220+) were sort-purified using FACSAriaII. Similarly, purified PLN resident B-lymphocytes from 8-week-old unmanipulated NOD and NOD.Aicda-/- mice served as controls. Purified cells were washed with PBS, re-suspended in RLT buffer and snap-frozen. Total RNA was purified using RNeasy Micro Kit (Qiagen). RNA integrity number determined using the Bioanalyzer RNA 6000 Pico Kit (Agilent) for all samples was 10. Total RNA was reverse transcribed using SMARTscribe Reverse Transcriptase (Takara) with IgH isotype-specific primers (1 μM each): IgHG1/2: 5′-CAGGGATCCAKAGTTC-3′, IgHG3: 5′-CAGGGCTCCATAGTTC-3′, IgHM: 5′-GATGACTTCAGTGTTGT-3′ and IgHD: 5′-AGTGGCTGACTTCCAA-3′; and 1μM template-switch adapter (5′-AAGCAGUGGTAUCAACGCAGAGUNNNNUNNNNUNNNNUCTTrGrGrGrG-3′, U=deoxyuridine) to introduce a unique molecular identifier (UMI) sequence to the 3′-end of each cDNA molecule. Reverse transcription reactions were setup as follows: 5 μL RNA and 2 μL IgH isotype-specific primers (10 μM each) were heated to 72°C for 3 minutes then incubated at 42°C for 3 minutes to anneal primers; 13 μL of the following mixture was then added to each reaction for a final concentration of 1× First-strand buffer, 2 mM DTT, 1 μM 5′-Template Switch Adapter, 1 mM each dNTP (Invitrogen), 40 units RNaseOUT (Invitrogen) and 200 units SMARTscribe Reverse Transcriptase. cDNA was then treated with 5 units of Uracil DNA Glycosylase (New England Biolabs) to degrade residual template-switch adapter then purified using the NucleoSpin Gel and PCR Purification Kit (Takara). First PCR was performed using cDNA equivalent to 2.5 ng of RNA and Platinum SuperFi DNA Polymerase (Invitrogen) with the following primers: M1SS: 5′-AAGCAGTGGTATCAACGCA-3′, mIGG12_r2: 5′-ATTGGGCAGCCCTGATTAGTGGATAGACHGATG-3′, mIGG3_r2: 5′-ATTGGGCAGCCCTGATTAAGGGATAGACAGATG -3′, mIGM_r2: 5′- ATTGGGCAGCCCTGATTGGGGGAAGACATTTGG-3′, mIGD_r2: 5′-ATTGGGCAGCCCTGATTCTCTGAGAGGAGGAAC-3′. First PCR products were purified using NucleoSpin Gel and PCR Purification Kit then amplified using Platinum SuperFi DNA Polymerase to introduce sample-specific dual-end barcodes with the following primers: M1S: 5′-(N)4-6(XXXXXX)CAGTGGTATCAACGCAGAG-3′ and Z: 5′-(N)4-6(XXXXXX)ATTGGGCAGCCCTGATT-3′, where XXXXXX represents sample-specific 6-nt barcode. Second PCR products were purified using NucleoSpin Gel and PCR Purification Kit. For each sample, 300ng of purified second PCR product was used for individual sequencing library prep using NEBNext Ultra II DNA Library Prep Kit with NEBNext Singleplex Oligos both for Illumina (New England Biolabs). Concentrations for each library were determined using Qubit dsDNA BR Assay Kit (Life Technologies) and equal quantity of each library was pooled, run on a 1.5% agarose gel and 600-800 bp band was excised and extracted using the NucleoSpin Gel and PCR Purification Kit. Pooled, gel-extracted libraries were then quality controlled using a Bioanalyzer High Sensitivity Kit (Agilent) and quantified by qPCR using the Library Quantification Kit/Illumina GA/ABI Prism (KAPA Biosystems) with the Illumina Internal Control (KAPA Biosystems).
Ig repertoire sequencing and data analysis
Sequencing libraries were spiked with 30% PhiX Control Kit v3 (Illumina) and loaded at 10 pM concentration for asymmetric 400+225bp paired-end sequencing performed using MiSeq (Illumina) sequencer running MiSeq Reagent Kit v3 (Illumina). Sequencing data was processed using MIGEC (34), as follows: First, raw reads were de-multiplexed based on each sample's two 6-nt barcodes then split into molecular identifier groups (MIG) consisting of reads sharing the same UMI. MIGs consisting of <5 reads were discarded. Then, using only the first reads, consensus sequences were determined independently for 5′- and 3′-end reads within each MIG. 5′- and 3′-end read consensus sequences were then merged using the MiTools Merge Utility (https://github.com/milaboratory/mitools), with the minimum sequence similarity set to 70% for reads with overlapping parts, to generate full-length IgH sequences for each MIG. Using MiXCR (35), full-length Ig sequences were then mapped to the mouse reference germline sequences and resulting alignments were used to assemble clonotypes. When assembling clonotypes, a specific mutation probability of 10-4 was used for frequency-based correction of PCR or sequencing errors. Assembled clonotypes were then exported for diversity analyses using VDJtools (36). Clonotypic diversity estimates were calculated based on CDR3 nucleotide sequence and V- and J-segment usage.
Statistical Analysis
All graphs and statistics were generated using Prism 6 (GraphPad) or Excel (Microsoft). Specific statistical analyses are listed within the respective figure legends. Mann-Whitney, Wilcoxon and t-test analyses were all two-tailed.
Results
NOD B-lymphocytes display increased Aicda expression and its ablation significantly retards T1D development
B-lymphocytes in NOD mice can undergo CSR/SHM, enhancing their capacity to process and present autoantigenic epitopes to diabetogenic T-cells (16). However, it is unknown if the processes of CSR and SHM are naturally important contributors to the diabetogenic activity of B-lymphocytes in NOD mice, and by extension, in disease-susceptible humans. An initial finding supporting this possibility was that basal expression levels of the Aicda gene necessary to induce CSR/SHM was higher in NOD B-lymphocytes than those from non-autoimmune prone B6 mice (Fig. 1A). These data support the presence of a significantly higher baseline level of autoantigen-activated Aicda-expressing B-lymphocytes in NOD mice than B6 controls, and is consistent with previous observations that germinal centers are expanded in autoimmune prone strains (37).
Figure 1. NOD B-lymphocytes spontaneously express high levels of Aicda and ablation of this gene inhibits T1D development.
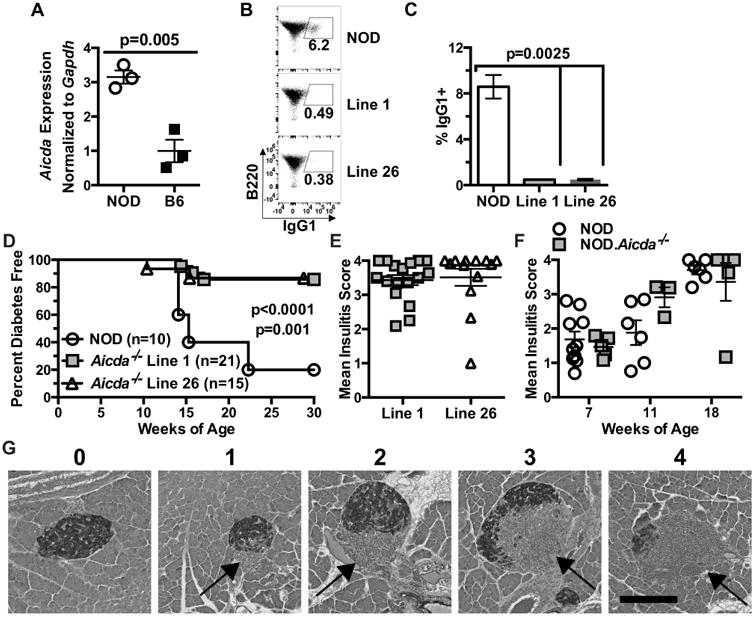
(A) B-lymphocytes purified from individual spleens of 8 week old NOD (n=3) and B6 (n=3) female mice were tested for Aicda expression via qPCR. Data are representative of 3 independent experiments. (B) Representative flow cytometry plots showing class-switching to IgG1 of purified B-lymphocytes from NOD and NOD.Aicda-/- Line 1 and Line 26 mice stimulated in culture with anti-CD40 (1 μg/ml) and murine IL-4 (25 ng/ml) for 96 hours with quantitative data pooled from three experiments (NOD=7, Line 1=5, Line 26=5) summarized in (C). (D) FemaleT1D incidence in NOD controls compared with NOD.Aicda-/- Line 1 (p<0.0001) and NOD.Aicda-/- Line 26 (p=0.001) mice. (E) Insulitis scores on a scale of 0 (no visible lesion) to 4 (75-100% islet destruction) for female NOD.Aicda-/- Line 1 and Line 26 mice remaining free of overt T1D at end of the disease incidence study. (F) Insulitis for female NOD and NOD.Aicda-/- Line 1 mice at 7, 11, and 18 weeks of age. (G) Representative islet for each insulitis scoring level. Student's t-test was used to determine p-value shown for gene expression and Mann-Whitney utilized for class switching. P-values for T1D incidence were determined using Mantel-Cox log-rank tests. All bar graphs and scatter plots show Mean±SEM.
We next tested whether Aicda expression by NOD B-lymphocytes was critical to their diabetogenic activity. CRISPR-Cas9 technology was utilized to directly target in NOD zygotes, either exon 1 or exon 2 (containing a potential alternative start site) of the Aicda gene (Supplementary Fig. 1A-D). This allowed for the subsequent generation of pure NOD background stocks carrying either the exon 1 (Line 1) or exon 2 (Line 26) targeted Aicda allele in a homozygous state (Supplementary Fig. 1A-D). We then assessed the ability of purified B-lymphocytes from the Line 1 or 26 stocks to undergo CSR to the IgG1 isotype following anti-CD40 and IL-4 stimulation in vitro. Similar to the case reported in a B6 background stock (22), B-lymphocytes from both Line 1 and 26 NOD.Aicda-/- mice displayed significantly decreased CSR (Fig. 1B-C). Analyses were also carried out to confirm the reduced ability of NOD.Aicda-/- B-lymphocytes to undergo CSR was not the result of off-target mutations caused by CRISPR-Cas9. To do this, each NOD.Aicda-/- line was crossed to the established B6.Aicda-/- stock and purified B-lymphocytes from the resulting F1 hybrids tested for CSR capacity. The observation of similarly reduced CSR in F1 offspring for each line demonstrates this phenotype is the result of our novel direct-in-NOD disruption of Aicda (Supplementary Fig. 1E, F).
We then compared the female rate of T1D development for each NOD.Aicda-/- line to that of wild-type (WT) NOD controls. Both NOD.Aicda-/- lines exhibited similar significantly reduced rates of T1D (Fig. 1D). Heterozygous NOD.Aicda+/- mice developed T1D at an intermediate rate (data not shown). Interestingly, both Line 1 and 26 NOD.Aicda-/- mice remaining free of overt T1D at the end of the incidence study were still characterized by significant levels of insulitis (Fig. 1E). Next, we compared kinetics of insulitis progression in female NOD and NOD.Aicda-/- mice at 7, 11 and 18 weeks of age. Insulitis progression was not delayed in Line 1 NOD.Aicda-/- mice (Fig. 1F,G), indicating this could not explain their resistance to overt T1D. Together these data indicate that despite the continued presence of islet-infiltrating leukocytes in NOD.Aicda-/- mice, the diabetogenic nature of these cells have been altered by genetic ablation of AID.
NOD.Aicda-/- total B-lymphocytes are numerically increased and germinal center and memory-like subsets are proportionally expanded
To initially investigate the basis for the T1D resistance of NOD.Aicda-/- mice, we compared them to WT controls for the presence of various immature and mature B-lymphocyte populations within spleens and pancreatic lymph nodes (PLN). Gating strategies for subsequently described flow cytometric studies are depicted in Supplemental Figure 2. Line 1 mice were used for all subsequent studies due to better breeding proclivity and ease of genotyping compared to the equally T1D resistant Line 26.
Selection processes to prune autoreactive B-lymphocytes operate at the immature transitional-1 (T1) stage in the spleen (38). The frequency of splenic T1 B-lymphocytes is increased in NOD.Aicda-/- mice, while subsequent developmental stage T2 cells are decreased (Fig. 2A). A shift in the ratio of T1:T2 cells might reflect increased tolerogenic culling of autoreactive B-lymphocytes in NOD.Aicda-/- mice (39). Alternatively, this shift may be the result of Aicda-/- B-lymphocytes decreased susceptibility to apoptosis at the T1 stage (40). Despite the differing distribution of T1 and T2 subsets, total splenic and PLN B-lymphocyte yields were higher in NOD.Aicda-/- mice than WT controls (Fig. 2B). Consistent with reports of AID ablation in other strains (41), Fas+ GL7+ GC B-lymphocytes were expanded in both the spleens and PLNs of NOD.Aicda-/- mice (Fig. 2C, D). This correlates with the large germinal center sizes observed in spleens of Aicda-/- mice (data not shown). Also, proportions of splenic CD80+ and PD-L2+ memory-like B-lymphocytes (42) were increased in NOD.Aicda-/- mice (Fig. 2E). Furthermore, the IgM-dominated serum isotype profile of NOD.Aicda-/- mice parallels that of other Aicda-/- strains (Fig. 2F), as well as those seen in AID-deficient patients (43). Finally, percentages of B-lymphocytes among islet-infiltrating leukocytes (CD45.1+) were similar in NOD and NOD.Aicda-/- mice (Fig. 2G). Proportions of islet-infiltrating B-lymphocytes in NOD.Aicda-/- mice expressing the CD69 activation and CD80 or PD-L2 memory-like markers (42) were respectively similar and greater than those from NOD controls (Fig. 2H). Together, these data indicate genetically ablating AID in NOD mice increases numbers of peripheral B-lymphocytes displaying a more predominant GC and memory-like phenotype.
Figure 2. NOD.Aicda-/- B-lymphocytes are numerically increased and display a more predominant GC phenotype than those from NOD controls.

(A) Flow cytometric analyses comparing splenic T1 (B220+ CD19+ CD21- CD23-), T2 (B220+ CD19+ CD21hi CD23+), MZ (B220+ CD19+ CD21hi CD23-) and FO (B220+ CD19+ CD21+ CD23+) B-lymphocyte subsets in 8 week old female NOD and NOD.Aicda-/- mice (n=8 per group; one representative of three experiments). (B) Enumeration of total B-lymphocytes (CD45.1+ B220+ CD19+) in spleen and PLN of 7-10 week old NOD.Aicda-/- mice (n=21) compared with NOD controls (n=19) pooled from 4 individual experiments. (C) Representative flow cytometry contour plots showing single-cell live B-lymphocyte gated events for analysis of splenic and PLN GC (Fas+ GL7+) B-lymphocytes in 7 week old female NOD and NOD.Aicda-/- mice with quantitative data (n=7 per group) summarized in panel (D) from one experiment. (E) Percent CD80+ or PD-L2+ amongst splenic or PLN B-lymphocytes in 10 week old female NOD (n=8) and NOD.Aicda-/- (n=10) mice from one experiment. (F) Quantification by ELISA of serum immunoglobulin isotypes in 6-7 week old male NOD (n=7) and NOD.Aicda-/- mice (n=10) pooled from two experiments. (G) Analysis of islet-infiltrating B220+ cells among CD45.1+ leukocytes in 10-12 week old female NOD (n=18) and NOD.Aicda-/- mice (n=16) pooled from five experiments. (H) Proportions of islet-infiltrating B-lymphocytes with a CD69+, CD80+, or PD-L2+ phenotype in 10-12 week old female NOD (n=18 for CD69 and CD80, n=13 for PD-L2) or NOD.Aicda-/- mice (n=16 for CD69 and CD80, n=14 for PD-L2) pooled from five experiments. All p-values were calculated using Mann-Whitney analyses and all bar graphs show Mean±SEM.
AID ablation in NOD mice expands T-cell populations but does not directly affect their diabetogenic activity
T-cells are the ultimate mediators of β-cell destruction in T1D. Therefore, we tested if T-cells in T1D-resistant NOD.Aicda-/- mice were quantitatively and/or qualitatively distinct from those in NOD controls. Surprisingly, yields of splenic CD4+ and CD8+ T-cells were increased in NOD.Aicda-/- mice (Fig. 3A). Corresponding with increased GC B-lymphocytes, fully activated CXCR5+ PD-1+ Tfh cells were also expanded in both spleens and PLNs of NOD.Aicda-/- mice (Fig. 3B, C). While numerically expanded, we sought to determine whether the intrinsic diabetogenic activity of T-cells in NOD.Aicda-/- mice was decreased. Purified NOD or NOD.Aicda-/- T-cells did not differ in ability to transfer T1D to lymphocyte-deficient NOD-scid recipients (Fig. 3D). Together these data indicate that genetic ablation of AID in NOD mice leads to an expansion of total peripheral, and Tfh subset T-cells, and the observed disease protection is not due to a decrease in their diabetogenic potential.
Figure 3. Numbers of total peripheral and GC phenotype CD4+ T-cells are increased in NOD.Aicda-/- mice.

(A) Yields of splenic or PLN resident CD4 (CD45.1+ TCRβ+ CD4+) and CD8 (CD45.1+ TCRβ+ CD8+) T-cells in 7-10 week old female NOD (n=19) and NOD.Aicda-/- (n=21) mice pooled from four experiments. (B) Representative flow cytometric contour plots showing single-cell live CD4 T-cell gated events for analysis of splenic and PLN full Tfh cells (CXCR5+ PD-1+) in 7 week old female mice with quantitative data (n=7 per group) summarized in (C), one representative of three experiments. (D) T1D development in NOD-scid recipients injected with 2.5×10⁶ purified T-cells from 7-8 week old female NOD.Aicda-/- or NOD mice. All p-values for bar graphs were calculated using Mann-Whitney analysis. All bar graphs show Mean±SEM. T1D incidence p-value was calculated using Mantel-Cox analysis.
NOD T-cells adoptively transfer T1D less efficiently in the presence of Aicda-deficient B-lymphocytes characterized by an expanded CD73+ subset
As described above, when transferred in the absence of B-lymphocytes, purified T-cells from NOD.Aicda-/- donors efficiently induced T1D development in NOD-scid recipients. This indicated that T1D resistance in NOD.Aicda-/- mice does not result from a T-cell intrinsic effect. Therefore, we assessed how AID-deficient B-lymphocytes might influence such pathogenic effectors. To initially test this, equal numbers of purified NOD splenic T-cells and purified NOD or NOD.Aicda-/- splenic B-lymphocytes were transferred into NOD-scid recipients. NOD T-cells induced T1D far less efficiently in NOD-scid recipients when co-transferred with Aicda-/- than WT B-lymphocytes (Fig. 4A). These results indicated Aicda-/- B-lymphocytes may actively suppress diabetogenic T-cell responses.
Figure 4. NOD T-cells adoptively transfer T1D less efficiently in the presence of Aicda deficient B-lymphocytes characterized by an expansion of the CD73+ subset.

(A) T1D development in NOD-scid recipients injected with 2.5×10⁶ purified T-cells from 7-8 week-old female NOD donors admixed with 2.5×10⁶ B-lymphocytes from 7-8 week-old NOD (n=10) or NOD.Aicda-/- mice (n=9). (B) Representative contour plots for B220 vs CD73 staining pattern of splenic B220+ CD19+ B-lymphocytes from female NOD and NOD.Aicda-/- mice. (C) Quantification of %CD73+ among spleen, PLN and islet B-lymphocytes in 7-12 week old NOD (spleen/PLN: n=15, Islets: n=18) and NOD.Aicda-/- (spleen/ PLN: n=17, islets: n=16) mice. Spleen and PLN data is pooled from three experiments, islet data is pooled from five experiments. Quantification of the %CD39+ CD73+, CD39+ CD73-, CD39- CD73+ expressing cells amongst (D) splenic (E) PLN or (F) islet B220+ CD19+ B-lymphocytes in 7-12 week old female NOD (spleen/PLN: n=15, islets: n=7) and NOD.Aicda-/- mice (spleen/PLN: n=17, islets: n=8) pooled from two individual experiments. T1D incidence study p-value was calculated using Mantel-Cox analysis. All bar graph p-values were calculated using Mann-Whitney analysis, and all bar graphs show Mean±SEM.
CD39 and CD73 are ecto-enzymes which catalyze the conversion of extracellular ATP to AMP then to adenosine, respectively. There is evidence that alterations to the CD39/CD73 purinergic metabolic pathway play a major role in several autoimmune diseases (44). Adenosine signaling through the Adenosine A2a receptor (A2aR) can inhibit TCR signaling and prevent cellular activation (45). In a murine colitis model, CD73 expression reportedly marks a subset of B-lymphocytes with the capacity to suppress T-cell responses through adenosine production (46). Thus, we compared the extent that B-lymphocytes from Aicda intact and deficient NOD mice express CD39 and/or CD73. Levels of CD73+ B-lymphocytes were greater within spleens, PLNs, and islets of NOD.Aicda-/- mice than NOD controls (Fig. 4B, C). We observed higher proportions of CD73+ B-lymphocytes that either did or did not co-express CD39 within spleens, PLNs and islets of NOD.Aicda-/- mice than NOD controls, but found no differences in the CD39+ CD73- fraction (Fig. 4D, E, F). Together these data indicate the ability of NOD T-cells to induce T1D development is reduced in the presence of NOD.Aicda-/- B-lymphocytes, which contain an expanded CD73+ subset previously reported to exert regulatory activity (46).
CD73+ B-lymphocytes in NOD.Aicda-/- mice exert regulatory activity suppressing diabetogenic T-cell responses
As noted above, CD73 expression can mark a population of suppressive B-lymphocytes. Aicda-/- B-lymphocytes engrafted into NOD-scid recipients retain increased CD73 expression (Fig. 5A). Thus, we assessed if the expanded CD73+ B-lymphocytes in NOD.Aicda-/- mice exert T1D suppressive effects in adoptive transfer experiments. Purified NOD T-cells transferred T1D to NOD-scid recipients with significantly greater efficiency when admixed with Aicda-/- B-lymphocytes that had been depleted of the CD73+ subset (Fig. 5B). We then carried out in vitro studies to determine whether Aicda deficient NOD B-lymphocytes exert suppressive effects on such pathogenic effectors through regulatory activity mediated by the expanded CD73+ subset. Sorted CD73+ and CD73- B-lymphocytes from NOD or NOD.Aicda-/- mice were cultured with anti-CD40, anti-CD3/CD28 stimulated CD73- CD4+ WT T-cells and AMP with or without the CD73 inhibitor α,β-methyleneadenosine 5′-diphosphate (APCP). On a per cell basis, CD73+ B-lymphocytes from both AID intact and deficient NOD mice equally suppressed T-cell proliferation to a significantly greater extent than the CD73- subset in the presence of AMP, and addition of APCP diminished this effect (Fig. 5C, Supplementary Fig. 3A).
Figure 5. Expanded AID deficient CD73+ B-lymphocytes exert regulatory-like activity suppressing diabetogenic T-cell responses.

(A) Splenic engraftment levels of CD73+ B-lymphocytes from NOD (n=9) or NOD.Aicda-/- (n=8) donors admixed with NOD T-cells (2.5×10⁶ of each cell type) 4 weeks post-transfer into NOD-scid recipients. Results from one experiment. (B) T1D development in NOD-scid recipients injected with 2.5×10⁶ purified T-cells from 7-8 week old female NOD mice admixed with 2.5×10⁶ total or CD73-depleted B-lymphocytes purified from 7-8 week-old female NOD.Aicda-/- donors. (C) 1.0×10⁵ CD73-depleted purified CD4+ T-cells from 7-10 week-old male NOD mice were labeled with Cell Proliferation Dye eFluor670 (CPD) and co-cultured for 4 days with 1.0×10⁵ CD73+ or CD73- B-lymphocytes from pooled spleens of 7-10 week old male NOD (n=6 biological replicates) or NOD.Aicda-/- (n=10 biological replicates) mice under stimulation conditions consisting of soluble anti-CD40 (1 μg/mL), plate-bound anti-CD3ε (5 μg/mL) and soluble anti-CD28 (2 μg/mL) with 0 (baseline) or 10 μM AMP in the presence or absence of 100 μM APCP. Quantification of percent suppression from baseline. (D) 5×10⁴ sort-purified NOD (n=5 biological replicates) or NOD.Aicda-/- (n=10 biological replicates) CD73+ or CD73- B-lymphocytes were cultured for 3 days with 0 or 10 μg/mL LPS and culture supernatant IL-10 subsequently measured by ELISA. CD73-mediated in vitro suppression and IL-10 production data shown are combined from three and two individual experiments, respectively. T1D incidence study p-value was calculated using Mantel-Cox analysis. Wilcoxon test was performed for suppression assay. Mann-Whitney analysis was performed for IL-10 production. All bar graphs show Mean±SEM.
It has been previously reported that B-lymphocytes with an ability to suppress T1D development in NOD mice primarily do so through IL-10 secretion (47). Similarly, the expanded CD73+ B-lymphocyte population in NOD.Aicda-/- mice, exhibiting capacities to suppress diabetogenic T-cell responses, secrete significantly greater levels of IL-10 upon LPS stimulation than their CD73- counterparts (Fig. 5D). Together, these results indicate that diminished T1D development in NOD.Aicda-/- mice is at least in part due to an expansion of CD73+ B-lymphocytes with the capacity to suppress pathogenic T-cell responses. CD73+ B-lymphocytes suppress T-cell responses through the generation of adenosine by this ecto-enzyme, and potentially by their ability to secrete IL-10 upon stimulation. These collective results also indicate genetic ablation of AID inhibits T1D development in NOD mice by quantitatively increasing rather than qualitatively changing immunoregulatory CD73+ B-lymphocytes.
DIDS treatment decreases the Ig repertoire diversity of NOD B-lymphocytes
The results of our genetic studies show AID-dependent processes play an important role in B-lymphocyte contributions to T1D development in NOD mice. By inhibiting RAD51-mediated HR repair of AID-initiated off-target DSBs, treatment with the small molecule DIDS induces the death of B-lymphocytes in which SHM and CSR processes have been initiated (23). Therefore, we hypothesized targeting the AID/RAD51 pathway by DIDS treatment might provide an effective B-lymphocyte-directed T1D intervention. To initially test this possibility, we stimulated purified NOD B-lymphocytes with anti-CD40 and IL-4 in the presence of vehicle or 150μM DIDS in vitro. Similar to the case for those from B6 control mice, after four days of stimulation fewer NOD B-lymphocytes were recovered from DIDS containing cultures (Fig. 6A). In addition, fewer anti-CD40/IL-4 stimulated B-lymphocytes were recovered from cultures containing (E)-5-acetamido-2-(4-(3-isopropylthioureido)-2-sulfonatostyryl)benzenesulfonate (C1523), another small molecule RAD51 inhibitor 1,500 fold more potent than DIDS (Fig. 6A, Supplementary Fig. 4).
Figure 6. DIDS diminishes in vitro expansion and Ig usage diversity of NOD B-lymphocytes.

(A) Cellular yields of purified B-lymphocytes from B6 or NOD (n=3 biological replicates per group) mice cultured for 96 hours at 1×10⁶ cells/mL with anti-CD40 (1 μg/mL) and murine IL-4 (25 ng/mL) in the presence of vehicle, 150μM DIDS, or 100nM C1523. Data are representative of one of three experiments. (B) 136,000-400,000 purified PLN B-lymphocytes from the indicated NOD experimental groups were sequenced for IgH gene usage diversity (n=3 mice per group) in one experiment. Sequences with early stop codons or frameshift mutations were filtered to display only “functional” clones. Data are presented in a rarefraction plot showing clonal diversity as a function of unique cDNA molecules sequenced. Solid and dashed lines are interpolated and extrapolated regions respectively with points marking the exact sample size and observed diversity. The shaded area represents 95% confidence interval. (C) ChaoE Index. (D) Observed diversity and (E) Efron-Thisted Estimate after 500 iterations of down sampling to 500 reads. P-values in (C-E) were calculated using Student's t-test. Scatter plots show Mean±SEM.
We next determined whether DIDS treatment affected the Ig repertoire of NOD mice in a similar manner to genetic ablation of AID. We reasoned the inability of NOD.Aicda-/- B-lymphocytes to initiate CSR/SHM processes would result in decreased Ig gene coding repertoire diversity relative to WT controls. By extension, we also hypothesized DIDS-mediated disruption of the AID/RAD51 axis would recapitulate such decreases in Ig repertoire diversity. Therefore, using established protocols (33), we utilized high-throughput sequencing to characterize full-length IgH mRNAs from purified PLN resident B-lymphocytes of individual 8-week-old NOD and NOD.Aicda-/- mice and from NOD mice treated with vehicle or 50 mg/kg DIDS from 8-16 weeks of age. To minimize overestimations of diversity, the protocol utilizes template switch reverse transcription to incorporate a 12-bp UMI at the 3′-end of each cDNA molecule. This allows for correction of sequencing and PCR errors by grouping multiple reads originating from single cDNA molecules to form consensus reads. Rarefaction and extrapolated Chao diversity estimate (ChaoE, (48)) analyses revealed decreased IgH diversity among B-lymphocytes from NOD.Aicda-/- and DIDS-treated NOD mice compared to untreated and vehicle-treated NOD controls, respectively (Fig. 6B, C). To ensure that sampling bias resulting from variances in sequencing depth was not responsible for the observed differences in diversity, each sample was down-sampled to 500 consensus reads. After 500 iterations of re-sampling, both Aicda-/- and DIDS-treated B-lymphocytes had decreased diversity, measured by Observed Diversity and Lower Bound Total Diversity (Efron-Thisted) estimate (49), compared to their respective controls (Fig. 6D, E). Together, both the in vitro and in vivo data indicate NOD B-lymphocytes are as susceptible to DIDS as previously reported for those from the B6 strain (23), and treatment with this small molecule decreases IgH repertoire diversity in a manner similar to Aicda ablation.
Molecular inhibition of the AID-RAD51 axis inhibits T1D development
We next tested whether in vivo treatment with DIDS exerted T1D protective effects in NOD mice. Starting at 6, 8, or 10-weeks of age, female NOD mice received weekly i.p. injections of either vehicle or DIDS at 10 (low-dose), or 50 mg/kg (high-dose, 6 and 8 week start only). Regardless of start time or dose, DIDS treatment exerted strong T1D protective effects to 24 weeks of age at which the disease incidence in controls reached 90% (Fig. 7A, B, C).
Figure 7. DIDS treatment inhibits T1D development.

Starting at 6 (A), 8 (B), or 10 (C) weeks of age female NOD mice were treated with vehicle, or DIDS at 10 mg/kg or 50 mg/kg on a weekly basis and monitored for T1D development. P-values were calculated using Mantel-Cox analysis. (D) Serum was harvested from the cohort of mice in (A) at the initiation of treatment and retrospectively typed for IAA. Graph represents the percent of IAA+ or IAA- mice in each treatment group that did or did not progress to T1D (IAA+ DIDS: n= 9; IAA+ Vehicle: n=3; IAA- DIDS: n=11; IAA- Vehicle: n=7). P-values were calculated using Fisher's exact test. (E) Insulitis scores for NOD female mice treated weekly starting at 8 weeks of age with vehicle (n=10) or DIDS at a dose of 10 mg/kg (n=8) or 50 mg/kg (n=14). P-values were calculated using Mann-Whitney analysis showing Mean±SEM.
The presence of insulin autoantibodies (IAA) is an important criteria used to identify humans at high future T1D risk for inclusion in possible disease intervention trials (13). Thus, just prior to treatment initiation, serum was collected from mice depicted in Figure 7A and retrospectively typed for IAA. Importantly, DIDS treatment prevented progression to overt T1D when initiated in already IAA+ NOD mice (IAA+: Vehicle 2/3, DIDS 0/9; IAA-: Vehicle 6/7, DIDS 0/11) (Fig. 7D). Additionally, NOD mice treated with DIDS from 8 weeks of age had decreased levels of insulitis compared to controls (Fig. 7E). These collective data indicate DIDS treatment inhibits progression to overt T1D, even when initiated in NOD mice that had already developed high ongoing levels of β-cell autoimmunity marked by the presence of IAA.
DIDS treatment alters B-lymphocyte profiles in a manner similar to that elicited by Aicda gene ablation
To initially investigate how the reagent may elicit T1D protection, NOD mice treated with DIDS from 8-16 weeks of age were evaluated for phenotypic changes in B-lymphocyte populations. As observed following genetic ablation of AID, NOD mice treated with 50 mg/kg DIDS from 8-16 weeks of age were characterized by increased numbers of total splenic and PLN B-lymphocytes (Fig. 8A). Additionally, similar to the case elicited by genetic ablation of AID, DIDS treatment led to the expansion of splenic and PLN GC B-lymphocyte compartments (Fig. 8B). B-lymphocytes were also proportionally increased amongst islet-infiltrating lymphocytes (Fig. 8C). Further phenocopying NOD.Aicda-/- mice, the proportion of splenic, PLN, and islet-resident CD73+ B-lymphocytes, with potential immunosuppressive capacity, were increased by DIDS treatment (Fig. 8D). Furthermore, the DIDS elicited increase in islet CD73+ B-lymphocytes occurred in both the CD73+ CD39+ and CD73+ CD39- subpopulations (Fig. 8E). Finally, islet-infiltrating B-lymphocytes had similar levels of CD69, but increased CD80 and PD-L2 expression (Fig. 8F). This was also similar to the expansion of B-lymphocytes with a memory-like phenotype within the islets of NOD.Aicda-/- mice. Despite this observed expansion of islet-infiltrating memory-like B-lymphocytes in DIDS-treated mice, flow cytometric analyses of BM-resident B-lymphocytes revealed that, relative to vehicle-treated controls, DIDS treatment led to a proportional decrease in recirculating mature (Hardy Fraction F) B-lymphocytes (Fig. 8G, Supplementary Fig. 2F).
Figure 8. DIDS treatment alters B-lymphocyte profiles in a manner similar to that elicited by Aicda gene ablation.

NOD female mice were treated with vehicle or 50 mg/kg DIDS from 8-16 weeks of age. (A) Yield of total splenic and PLN CD19+ B220+ B-lymphocytes (n=7 vehicle, n=8 DIDS; combined from two experiments). (B) Percent splenic and PLN GC (Fas+ GL7+) B-lymphocytes (n=7 vehicle, n=8 DIDS; combined from two experiments). (C) %B220+ amongst islet CD45.1+ cells (combined from two experiments). (D) Percent CD73+ amongst B220+ CD19+ B-lymphocytes (n=7 Vehicle Spleen/PLN, n=8 DIDS Spleen/PLN, n=13 Vehicle Islet, n=14 DIDS Islet; combined from two experiments). (E) Percent CD73+CD39+, CD73-CD39+ and CD73+CD39- amongst islet B220+ lymphocytes (n=13 Vehicle, n=14 DIDS; combined from two experiments). (F) Percent CD69+, CD80+, and PD-L2+ amongst islet B220+ cells (n=13 Vehicle, n=14 DIDS; combined from two experiments). (G) Proportions of Hardy Fractions D (B220+ CD43- IgM- IgD-), E (B220+ CD43- IgM+ IgD-) and F (B220+ CD43- IgM+ IgD+) B-lymphocyte subsets in bone marrow (one experiment). Mann-Whitney analysis was performed for all bar and scatter plot graphs, showing Mean±SEM.
DIDS treatment effects on B-lymphocytes indirectly suppresses diabetogenic T-cell responses
DIDS treatment and genetic ablation of Aicda elicit similar phenotypic alterations in NOD B-lymphocytes. While not elicited by Aicda ablation, we considered it important to determine if DIDS treatment directly affects the diabetogenic capacity of NOD T-cells. Total CD4+ and CD8+ T-cells were numerically increased in the PLNs, but not spleens of DIDS-treated mice (Fig. 9A). As observed upon genetic ablation of AID, proportions of Tfh cells were increased in both the spleens and PLNs of DIDS-treated NOD mice (Fig. 9B). The proportion of total T-cells was decreased amongst islet-infiltrating leukocytes (Fig. 9C) after DIDS treatment. Additionally, there was a decrease in the proportion of the CD8+ subset amongst islet-infiltrating T-cells (Fig. 9D). Islet CD4+ T-cells displayed increased CD69 expression after DIDS treatment (Fig. 9E). DIDS treatment did not significantly alter islet CD8+ T-cells CD69 expression but marginally increased IL-7Rα levels (Fig. 9E). Finally, compared to vehicle-treated controls, in DIDS-treated mice, islet-infiltrating CD4+ T-cells had a decreased naïve and increased central memory phenotype, while CD8+ T-cells had a decreased effector and an increased central memory phenotype (Fig. 9F). Together, these data indicate DIDS treatment reduces effector CD8+ T-cells and drives the accumulation of central memory CD4+ and CD8+ T-cells within the islets of NOD mice.
Figure 9. DIDS effects on B-lymphocytes indirectly suppresses diabetogenic T cell responses.

NOD females were treated weekly with 50 mg/kg DIDS or vehicle from 8-16 weeks of age. (A) Percentage of CD4+ and CD8+ T-cells amongst live TER-119- splenic or PLN resident leukocytes (non-red blood cells) (n=7 Vehicle, n=8 DIDS; combined from two experiments). (B) Quantification of percent full Tfh cells amongst CD4+ TCRβ+ cells in the spleen and PLN (n=7 Vehicle, n=8 DIDS; combined from two experiments). (C) Percent TCRβ+ amongst CD45.1+ cells within the islets. (D) Percent CD4+ or CD8+ amongst islet T-cells (n=13 Vehicle, n=14 DIDS; combined from two experiments). (E) Percent CD69+ and IL-7Rα+ amongst islet CD4+ and CD8+ T-cells (n=13 Vehicle, n=14 DIDS; combined from two experiments). (F) Percent Naïve (CD44- CD62L+), Effector (CD44+ CD62L-), and Central Memory (CD44+ CD62L+) CD4+ and CD8+ T-cells in the islets of DIDS or vehicle treated mice (n=13 Vehicle, n=14 DIDS; combined from two experiments). (G) Female NOD mice were injected with vehicle or 50 mg/kg DIDS from 8-16 weeks of age. Splenic T-cells were then purified from each treatment group and transferred at a dose of 3×10⁶ into NOD-scid recipients (n=16 per group) that were subsequently monitored for T1D development. (H) 2.5×10⁶ purified total T-lymphocytes from 6-week-old female NOD mice were transferred into NOD-scid mice which then began weekly treatment with 0 or 50 mg/kg DIDS (n=10 per group) and monitored to T1D. Incidence study p-values were calculated using Mantel-Cox analysis; Mann-Whitney analysis was performed for all bar graphs. All bar graphs show Mean±SEM.
We next tested whether DIDS treatment had lasting effects on T-cell diabetogenic activity. Female NOD mice treated once weekly with vehicle or 50 mg/kg DIDS from 8-16 weeks of age, then became donors of purified splenic T-cells transferred into NOD-scid recipients that were subsequently monitored for T1D development. T-cells from DIDS-treated mice transferred T1D to NOD-scid recipients with significantly less efficiency than those from control donors (Fig. 9G). We envisioned two possible (non-exclusive) explanations for this result: 1) B-lymphocytes in the DIDS-treated donors expand autoreactive T-cell populations less efficiently than in vehicle-treated mice; 2) DIDS can act directly suppress diabetogenic T-cell activity.
To distinguish between the above possibilities, we tested the direct effect of DIDS on the diabetogenic function of NOD T-cells in the absence of B-lymphocytes. Purified splenic T-cells from 5-6-week-old female NOD mice were transferred into NOD-scid recipients. Starting three days post-transfer, the NOD-scid recipients began weekly 50 mg/kg DIDS or vehicle treatment, and were monitored for T1D development. After engraftment with NOD T-cells, NOD-scid recipients treated with DIDS or vehicle developed T1D at an equivalent rate (Fig. 9H). These results indicate DIDS treatment does not directly affect the diabetogenic activity of NOD T-cells. Thus, the diminished ability of T-cells from DIDS-treated NOD to adoptively transfer T1D cannot be attributed to a direct reduction in their pathogenicity, but rather, is likely due to DIDS limiting the ability of B-lymphocytes to support the expansion of pathogenic effectors.
CD73+ B-lymphocytes expanded by DIDS treatment suppress diabetogenic T-cell responses
We tested whether co-infusion of B-lymphocytes from control or DIDS-treated NOD mice differentially affected the ability of diabetogenic T-cells to transfer disease to NOD-scid recipients. NOD female mice were injected once weekly from 8-16 weeks of age with vehicle or 50 mg/kg DIDS. Purified splenic T-cells from the vehicle-treated mice were then co-transferred into NOD-scid recipients with equal numbers of purified total B-lymphocytes from vehicle or DIDS-treated donors. As previously noted, similar to the case of NOD.Aicda-/- mice, DIDS treatment expands CD73+ B-lymphocyte populations. Therefore, we also transferred T-cells from vehicle-treated controls with CD73-depleted B-lymphocytes from DIDS-treated mice. T1D development was significantly decreased in NOD-scid recipients of pathogenic T-cells co-infused with total B-lymphocytes from DIDS- compared to vehicle-treated donors (Fig. 10A). However, depletion of the CD73+ subset significantly enhanced the ability of B-lymphocytes from DIDS-treated donors to support T1D development in NOD-scid recipients co-infused with pathogenic T-cells (Fig. 10A). Hence, similar to the case with genetic ablation of AID, DIDS treatment of NOD mice induces a quantitative increase in CD73+ B-lymphocytes with a capacity to actively suppress T1D development (Fig. 10A).
Figure 10. CD73+ B-lymphocytes in DIDS treated mice are T1D suppressive.

NOD female mice were treated weekly with 50 mg/kg DIDS or vehicle from 8-16 weeks of age. (A) NOD-scid recipients were infused with 2×10⁶ purified splenic T-cells from vehicle-treated donors admixed with an equal number of purified total splenic B-lymphocytes from vehicle (VB) or total or CD73-depleted B-lymphocytes from DIDS-treated mice (DB). The NOD-scid recipients were then monitored for T1D development over 8 weeks. (B) 1.0×10⁵ NOD T-cells were labeled with Cell Proliferation Dye (CPD) eFluor670 and co-cultured for 4 days with 1.0×10⁵ CD73+ or CD73- B-lymphocytes from pooled spleens of vehicle (n=6 biological replicates) or DIDS treated (n=6 biological replicates) mice under stimulation conditions consisting of soluble anti-CD40 (1 μg/mL), plate-bound anti-CD3ε (5 μg/mL) and soluble anti-CD28 (2 μg/mL) with 0 (baseline) or 10 μM AMP in the presence or absence of 100 μM APCP. Quantification of percent suppression from baseline. (C) 1×10⁵ sort-purified CD73+ or CD73- B-lymphocytes from vehicle- or DIDS-treated NOD mice (n=6 biological replicates per group) were cultured for 3 days with 10 μg/mL LPS and culture supernatant IL-10 subsequently measured by ELISA. CD73-mediated in vitro suppression and IL-10 production data shown are each combined from two individual experiments. Incidence study p-value was calculated using Mantel-Cox analysis. Wilcoxon test was performed for suppression assay. Mann-Whitney analysis was performed for IL-10 production. All bar graphs show Mean±SEM.
Next, we tested whether the CD73+ population expanded by DIDS treatment can directly suppress T-cell responses. On a per cell basis, CD73+ B-lymphocytes from both vehicle- and DIDS-treated mice equally suppressed T-cell proliferation in response to anti-CD3ε and anti-CD28 stimulation to a significantly greater extent than the CD73- subset in the presence of AMP (Fig. 10B). This suppressive effect was diminished upon addition of APCP (Fig. 10B, Supplementary Figure 3B). Finally, we examined IL-10 production by sorted CD73+ and CD73- B-lymphocytes from vehicle- and DIDS-treated mice. Surprisingly, CD73+ B-lymphocytes from DIDS-treated mice produced less IL-10 upon LPS stimulation than those from vehicle-treated controls (Fig. 10C). These results indicate pharmacological targeting of RAD51 activity inhibits T1D development in NOD mice in a manner similar to that elicited by Aicda gene ablation, including a quantitative increase in CD73+ regulatory B-lymphocytes (Breg).
Discussion
We have demonstrated disruption of the AID/RAD51 axis, through either genetic or pharmacological means, strongly inhibits T1D development in NOD mice, and this protection is at least in part, due to the expansion of specific CD73+ B-lymphocyte populations with capacities to regulate pathogenic T-cell responses. Additionally, we provide the first evidence that while CSR and SHM processes are important B-lymphocyte intrinsic processes in T1D pathogenesis, their absence does not diminish autoreactive T-cell development. While purified T-cells from NOD.Aicda-/- mice are effective at adoptively transferring T1D to NOD-scid recipients, inhibiting CSR and SHM processes leads to an expansion of Breg controlling these effectors. These findings reveal an unexpected link between blocking AID/RAD51-dependent affinity maturation processes and Breg development. Thus, disruption of the AID/RAD51 axis may represent a previously unrealized means of in vivo Breg expansion.
Both ablation of AID and DIDS targeting of RAD51 result in accumulation of CD73+ B-lymphocytes capable of suppressing T-cells at least in part through production of adenosine (Fig. 5C, 10B). Previous studies demonstrated adenosine signaling via A2aR inhibits CD8+ T-cell down-regulation of IL-7Rα preventing the differentiation of memory T-cells to effectors (50). Therefore, the shift of islet-infiltrating CD8+ T-cell populations in DIDS treated NOD mice from an effector to central memory phenotype (Fig. 9F), paired with increased IL-7Rα expression (Fig. 9E) further supports the conclusion that, in this system, diabetogenic T-cells are suppressed through an adenosine-mediated mechanism. Therefore, while not precluding the possibility of other non-overlapping adenosine-independent suppression pathways, the population of CD73+ B-lymphocytes expanded in either AID-deficient or DIDS-treated NOD mice both appear to largely inhibit diabetogenic T-cell responses through a mechanism dependent on activity of this ecto-enzyme.
It should also be noted that while CD73-depleted B-lymphocytes from DIDS-treated mice could support the ability of co-infused pathogenic T-cells to transfer T1D to NOD-scid recipients, they did so less efficiently than total B-lymphocytes from vehicle-treated control donors. This could indicate that in addition to expanding CD73+ Breg, DIDS-treatment may diminish the ability of other B-lymphocyte populations in NOD mice to support diabetogenic T-cell activity. This could include DIDS treatment supporting expansion of CD73- Breg capable of suppressing T-cells through adenosine-independent mechanisms. Should this be the case, the mechanism by which such CD73- Breg mediate suppression is likely to be IL-10-independent as this population produces little of the cytokine in response to stimulation.
It is currently unknown why CD73+ B-lymphocytes from DIDS-treated mice produce less LPS-induced IL-10 than those from controls. To date, IL-10 secretion has been recognized as a major means of Breg–mediated immune suppression (51). However, there have also been reports of reports of Breg capable of suppressing SLE and EAE development through IL-10-independent mechanisms (52). IL-10 production by B-lymphocytes requires strong stimulation whereas adenosine generation by CD73+ B-lymphocytes is constitutive providing its substrate is present (46). The ability of B-lymphocytes from DIDS-treated NOD mice to inhibit diabetogenic T-cell responses (Fig. 10A, B) despite decreased IL-10 production (Fig. 10C) supports the conclusion that such disease-protective effects are largely the result of CD73-mediated adenosine production. This observation is consistent with a report suggesting that Breg-mediated adenosine production may play a more important role in immunosuppression than IL-10 secretion (46). Additionally, it should be noted that IL-10-/- B-lymphocytes have reduced CD73 expression, suggesting this cytokine likely directly regulates CD73 expression by B-lymphocytes (46). Therefore, DIDS treatment of mice made genetically deficient in IL-10 expression or treated with an antibody blocking this cytokine mice would be unable to separate the regulatory contributions of CD73-mediated-adenosine production versus direct action by IL-10. The future creation of B-lymphocyte-specific CD73-/- NOD mice will help to uncouple the individual regulatory contributions provided by adenosine generation and IL-10 secretion.
This study has focused on the role of AID/RAD51 axis in germinal center affinity maturation processes contributing to T1D. However, the AID pathway has been shown to play an important role in B-lymphocyte outside of the splenic or lymph node germinal center environment. For example, AID has been implicated in the central tolerance of B-lymphocytes in C57BL/6 and BALB/c background strains (53). Another study demonstrated a role for AID in both central and peripheral tolerance of human B-lymphocytes (54). However, discerning the contribution of AID to these processes in NOD mice is complicated by strain-specific defects in B-lymphocyte central tolerance (55). Therefore, the effect of targeting AID/RAD51 on B-lymphocyte central tolerance in NOD is unclear and warrants further investigation. Additionally, manipulation of AID affects gut-associated-B-lymphocytes and alters intestinal microflora (56). Gut microflora alterations can drastically impact T1D development (57). Thus, examining the impact of disrupting the AID/RAD51 axis on gut-associated lymphoid tissue homeostasis is warranted. Additionally, disruption of the AID/RAD51 axis could conceivably result in decreased ability to clear infection. Due to institutional policy, we cannot currently infect mice with microbes at The Jackson Laboratory. Therefore, the possible effects of targeting the AID/RAD51 axis on the ability to clear pathogens will need to be the subject of others' research. Additionally, agents that might specifically increase CD73+ Breg without impacting the AID/RAD51 axis should be investigated.
Previous Rituximab-mediated pan-B-lymphocyte targeting clinical trial did not permanently halt β-cell demise (17). Studies in NOD mice indicate this may at least in part be due to down-regulation of cell surface CD20 expression by islet infiltrating B-lymphocytes (18). This provides a likely explanation for why anti-CD20 immunotherapy only protects NOD mice from T1D if initiated prior to IAA development. Other studies have provided evidence that Breg expansion has a potential to confer strong T1D inhibitory effects, and pan-B-lymphocyte depletion regimens could deplete these protective populations (58). Our results provide the first indication that future clinically applicable pharmaceutical agents targeting the AID/RAD51 axis could convert some B-lymphocytes to a T1D protective CD73+ regulatory phenotype. Furthermore, because this immunomodulatory therapy retains efficacy even when initiated at a late prodromal autoantibody positive stage of T1D development, it also represents a significant improvement upon previous B-lymphocyte-targeted disease intervention strategies.
In summary, these studies show that the genetic or pharmacologic blockade of B-lymphocyte affinity maturation processes in NOD mice drives diversion to a CD73+ regulatory phenotype capable of inhibiting autoimmune T1D development. Therefore, pharmacological targeting of RAD51 to block diabetogenic B-lymphocyte activity, either directly or by converting them to an immunoregulatory state, might ultimately represent a clinically translatable disease intervention approach. Since RAD51 is a multi-protein complex, this area of the AID pathway has other potential targets that might be exploited. The identification and utilization of pharmacological agents potentially directly blocking AID activity as a novel T1D intervention approach should also be explored. These studies also indicate further research into the role of the purinergic immunoregulatory pathway in T1D pathogenesis is warranted. Furthermore, this pathway could also represent a potentially clinically relevant immunomodulatory target for the treatment of various other autoimmune diseases, either through increasing adenosine production or through administration of A2aR agonists. Together, these initial studies reveal therapeutic targeting of the AID/RAD51 axis in B-lymphocytes is a previously unrealized area of research for T1D therapy development.
Supplementary Material
Acknowledgments
We thank staff within The Jackson Laboratory's Genome Technologies group, Genetic Engineering Technologies group, Flow Cytometry service and Research Animal Facility for technical support. We also thank Susanne Sattler (Imperial College, London) for critical review of the manuscript.
Footnotes
DVS is supported by NIH grants DK-46266, DK-95735, and OD-020351. CML is supported by NIH grant DK101735. KDM is supported by NIH grant CA138646 and The Jackson Laboratory Principal Investigator grant TJL DIF FY13 KDM. JJR2 is supported by NIH Fellowship 1F32DK111078. A part of this work was also supported by NCI grant P30CA034196. MAA is supported by NIH grant P01-AI42288. Author KDM. is a founder and shareholder in Cyteir Therapeutics, Inc. KDM, MGH, and CML hold patent No. 13/799,963: “Methods and composition for treatment of Cancer and Autoimmune Disease”. All other authors declare no additional financial interests.
Contributions: JJR1 designed and conducted experimentation, interpreted data, and contributed to writing of the manuscript; JJR2 designed and conducted experimentation, interpreted data, and contributed to writing of the manuscript; MGH designed and conducted experimentation and contributed to discussion of data interpretation; QW conducted experimentation; JAB conducted experimentation; HDC conducted experimentation and contributed to discussion of data interpretation; JZ conducted experimentation; ND conducted experimentation; VP conducted statistical analyses; WHS conducted experimentation and contributed to design of flow cytometry strategies; CW conducted experimentation, MAA contributed to discussion of data interpretation; KDM contributed to study conception and discussion of data interpretation; CML contributed to study conception and discussion of data interpretation; DVS contributed to study conception, supervised experimental effort, and writing of the manuscript.
Abbreviations: type 1 diabetes (T1D); class switch recombination (CSR); somatic hypermutation (SHM); inhibitor 4,4′-diisothiocyanatostilbene-2-2′disulfonic acid (DIDS); germinal centers (GCs); T-follicular helper cells (Tfh); activation-induced cytidine deaminase (Aicda); Aicda-encoded activation-induced cytidine deaminase protein (AID); double stranded DNA breaks (DSBs); homologous recombination (HR); NOD.Cg-PrkdcscidEmv30b/Dvs (NOD-scid); C57BL/6J (B6); wild-type (WT); pancreatic lymph nodes (PLN); Adenosine A2a receptor (A2aR); CD73 inhibitor α,β-methyleneadenosine 5′-diphosphate (APCP); (E)-5-acetamido-2-(4-(3-isopropylthioureido)-2-sulfonatostyryl)benzenesulfonate (C1523); insulin autoantibodies (IAA); regulatory B-lymphocytes (Breg).
References
- 1.Serreze DV, Chapman HD, Varnum DS, Hanson MS, Reifsnyder PC, Richard SD, Fleming SA, Leiter EH, Shultz LD. B lymphocytes are essential for the initiation of T cell mediated autoimmune diabetes: analysis of a new “speed congenic” stock of NOD. Igμnull mice. J Exp Med. 1996;184:2049–2053. doi: 10.1084/jem.184.5.2049. [DOI] [PMC free article] [PubMed] [Google Scholar]
- 2.Akashi T, Nagafuchi S, Anzai K, Kondo S, Kitamura D, Wakana S, Ono J, Kikuchi M, Niho Y, Watanabe T. Direct evidence for the contribution of B cells to the progression of insulitis and the development of diabetes in non-obese diabetic mice. Int Immunol. 1997;9:1159–1164. doi: 10.1093/intimm/9.8.1159. [DOI] [PubMed] [Google Scholar]
- 3.Wong FS, Visintin I, Wen L, Granata J, Flavell R, Janeway CA. The role of lymphocyte subsets in accelerated diabetes in nonobese diabetic-rat insulin promoter-B7-1 (NOD-RIP-B7-1) mice. J Exp Med. 1998;187:1985–1993. doi: 10.1084/jem.187.12.1985. [DOI] [PMC free article] [PubMed] [Google Scholar]
- 4.Noorchashm H, Noorchashm N, Kern J, Rostami SY, Barker CF, Naji A. B-cells are required for the initiation of insulitis and sialitis in nonobese diabetic mice. Diabetes. 1997;46:941–946. doi: 10.2337/diab.46.6.941. [DOI] [PubMed] [Google Scholar]
- 5.Bouaziz JD, Yanaba K, Venturi GM, Wang Y, Tisch RM, Poe JC, Tedder TF. Therapeutic B cell depletion impairs adaptive and autoreactive CD4+ T cell activation in mice. Proc Natl Acad Sci U S A. 2007;104:20878–20883. doi: 10.1073/pnas.0709205105. [DOI] [PMC free article] [PubMed] [Google Scholar]
- 6.Fiorina P, Vergani A, Dada S, Jurewicz M, Wong M, Law K, Wu E, Tian Z, Abdi R, Guleria I, Rodig S, Dunussi-Joannopoulos K, Bluestone J, Sayegh MH. Targeting CD22 reprograms B-cells and reverses autoimmune diabetes. Diabetes. 2008;57:3013–3024. doi: 10.2337/db08-0420. [DOI] [PMC free article] [PubMed] [Google Scholar]
- 7.Hu CY, Rodriguez-Pinto D, Du W, Ahuja A, Henegariu O, Wong FS, Shlomchik MJ, Wen L. Treatment with CD20-specific antibody prevents and reverses autoimmune diabetes in mice. J Clin Invest. 2007;117:3857–3867. doi: 10.1172/JCI32405. [DOI] [PMC free article] [PubMed] [Google Scholar]
- 8.Xiu Y, Wong CP, Bouaziz JD, Hamaguchi Y, Wang Y, Pop SM, Tisch RM, Tedder TF. B lymphocyte depletion by CD20 monoclonal antibody prevents diabetes in nonobese diabetic mice despite isotype-specific differences in Fc gamma R effector functions. J Immunol. 2008;180:2863–2875. doi: 10.4049/jimmunol.180.5.2863. [DOI] [PubMed] [Google Scholar]
- 9.Pearson JA, Wong FS, Wen L. The importance of the Non Obese Diabetic (NOD) mouse model in autoimmune diabetes. J Autoimmun. 2016;66:76–88. doi: 10.1016/j.jaut.2015.08.019. [DOI] [PMC free article] [PubMed] [Google Scholar]
- 10.Hulbert C, Riseili B, Rojas M, Thomas JW. B cell specificity contributes to the outcome of diabetes in nonobese diabetic mice. J Immunol. 2001;167:5535–5538. doi: 10.4049/jimmunol.167.10.5535. [DOI] [PubMed] [Google Scholar]
- 11.Marino E, Tan B, Binge L, Mackay CR, Grey ST. B-cell cross-presentation of autologous antigen precipitates diabetes. Diabetes. 2012;61:2893–2905. doi: 10.2337/db12-0006. [DOI] [PMC free article] [PubMed] [Google Scholar]
- 12.Silveira P, Johnson EA, Chapman HD, Tisch RM, Serreze DV. The preferential ability of B lymphocytes to act as diabetogenic APC in NOD mice depends on expression of self-antigen specific immunoglobulin receptors. Eur J Immunol. 2002;32:3657–3666. doi: 10.1002/1521-4141(200212)32:12<3657::AID-IMMU3657>3.0.CO;2-E. [DOI] [PubMed] [Google Scholar]
- 13.Bonifacio E, Ziegler AG. Advances in the prediction and natural history of type 1 diabetes. Endocrinol Metab Clin North Am. 2010;39:513–525. doi: 10.1016/j.ecl.2010.05.007. [DOI] [PubMed] [Google Scholar]
- 14.Victora GD, Nussenzweig MC. Germinal centers. Annu Rev Immunol. 2012;30:429–457. doi: 10.1146/annurev-immunol-020711-075032. [DOI] [PubMed] [Google Scholar]
- 15.Murphy K, Travers P, Walport M, Janeway C. Janeway's Immunobiology. Garland Science; New York: 2008. [Google Scholar]
- 16.Wan X, Thomas JW, Unanue ER. Class-switched anti-insulin antibodies originate from unconventional antigen presentation in multiple lymphoid sites. J Exp Med. 2016;213:967–978. doi: 10.1084/jem.20151869. [DOI] [PMC free article] [PubMed] [Google Scholar]
- 17.Pescovitz MD, Greenbaum CJ, Krause-Steinrauf H, Becker DJ, Gitelman SE, Goland R, Gottlieb PA, Marks JB, McGee PF, Moran AM, Raskin P, Rodriguez H, Schatz DA, Wherrett D, Wilson DM, Lachin JM, Skyler JS. Rituximab, B-lymphocyte depletion, and preservation of beta-cell function. N Engl J Med. 2009;361:2143–2152. doi: 10.1056/NEJMoa0904452. [DOI] [PMC free article] [PubMed] [Google Scholar]
- 18.Serreze DV, Chapman HD, Niens M, Dunn R, Kehry MR, Driver JP, Haller MJ, Wasserfall C, Atkinson M. Loss of intra-islet CD20 expression may complicate efficacy of B-lymphocyte directed type 1 diabetes therapies. Diabetes. 2011;60:2914–2921. doi: 10.2337/db11-0705. [DOI] [PMC free article] [PubMed] [Google Scholar]
- 19.Chaudhuri J, Tian M, Khuong C, Chua K, Pinaud E, Alt FW. Transcription-targeted DNA deamination by the AID antibody diversification enzyme. Nature. 2003;422:726–730. doi: 10.1038/nature01574. [DOI] [PubMed] [Google Scholar]
- 20.McBride KM, Gazumyan A, Woo EM, Barreto VM, Robbiani DF, Chait BT, Nussenzweig MC. Regulation of hypermutation by activation-induced cytidine deaminase phosphorylation. Proceedings of the National Academy of Sciences of the United States of America. 2006;103:8798–8803. doi: 10.1073/pnas.0603272103. [DOI] [PMC free article] [PubMed] [Google Scholar]
- 21.Muramatsu M, Kinoshita K, Fagarasan S, Yamada S, Shinkai Y, Honjo T. Class switch recombination and hypermutation require activation-induced cytidine deaminase (AID), a potential RNA editing enzyme. Cell. 2000;102:553–563. doi: 10.1016/s0092-8674(00)00078-7. [DOI] [PubMed] [Google Scholar]
- 22.Hasham MG, Donghia NM, Coffey E, Maynard J, Snow KJ, Ames J, Wilpan RY, He Y, King BL, Mills KD. Widespread genomic breaks generated by activation-induced cytidine deaminase are prevented by homologous recombination. Nat Immunol. 2010;11:820–826. doi: 10.1038/ni.1909. [DOI] [PMC free article] [PubMed] [Google Scholar]
- 23.Lamont KR, Hasham MG, Donghia NM, Branca J, Chavaree M, Chase B, Breggia A, Hedlund J, Emery I, Cavallo F, Jasin M, Ruter J, Mills KD. Attenuating homologous recombination stimulates an AID-induced antileukemic effect. The Journal of experimental medicine. 2013;210:1021–1033. doi: 10.1084/jem.20121258. [DOI] [PMC free article] [PubMed] [Google Scholar]
- 24.Serreze DV, Leiter EH, Hanson MS, Christianson SW, Shultz LD, Hesselton R, Greiner DL. Emv30null NOD-scid mice: an improved host for adoptive transfer of autoimmune diabetes and growth of human lymphohematopoietic cells. Diabetes. 1995;44:1392–1398. doi: 10.2337/diab.44.12.1392. [DOI] [PubMed] [Google Scholar]
- 25.Hill JT, Demarest BL, Bisgrove BW, Su YC, Smith M, Yost HJ. Poly peak parser: Method and software for identification of unknown indels using sanger sequencing of polymerase chain reaction products. Dev Dyn. 2014;243:1632–1636. doi: 10.1002/dvdy.24183. [DOI] [PMC free article] [PubMed] [Google Scholar]
- 26.Morgan HD, Dean W, Coker HA, Reik W, Petersen-Mahrt SK. Activation-induced cytidine deaminase deaminates 5-methylcytosine in DNA and is expressed in pluripotent tissues: implications for epigenetic reprogramming. J Biol Chem. 2004;279:52353–52360. doi: 10.1074/jbc.M407695200. [DOI] [PubMed] [Google Scholar]
- 27.Cartwright R, Dunn AM, Simpson PJ, Tambini CE, Thacker J. Isolation of novel human and mouse genes of the recA/RAD51 recombination-repair gene family. Nucleic Acids Res. 1998;26:1653–1659. doi: 10.1093/nar/26.7.1653. [DOI] [PMC free article] [PubMed] [Google Scholar]
- 28.Johnson EA, Silveira P, Chapman HD, Leiter EH, Serreze DV. Inhibition of autoimmune diabetes in nonobese diabetic mice by transgenic restoration of H2-E MHC class II expression: additive, but unequal, involvement of multiple APC subtypes. J Immunol. 2001;167:2404–2410. doi: 10.4049/jimmunol.167.4.2404. [DOI] [PubMed] [Google Scholar]
- 29.Julius MH, Herzenberg LA. Isolation of antigen-binding cells from unprimed mice: demonstration of antibody-forming cell precursor activity and correlation between precursor and secreted antibody avidities. J Exp Med. 1974;140:904–920. doi: 10.1084/jem.140.4.904. [DOI] [PMC free article] [PubMed] [Google Scholar]
- 30.Silveira PA, Chapman HD, Stolp J, Johnson E, Cox SL, Hunter K, Wicker LS, Serreze DV. Genes within the Idd5 and Idd9/11 diabetes susceptibility loci affect the pathogenic activity of B cells in nonobese diabetic mice. J Immunol. 2006;177:7033–7041. doi: 10.4049/jimmunol.177.10.7033. [DOI] [PMC free article] [PubMed] [Google Scholar]
- 31.Christianson GJ, Brooks W, Vekasi S, Manolfi EA, Niles J, Roopenian SL, Roths JB, Rothlein R, Roopenian DC. Beta 2-microglobulin-deficient mice are protected from hypergammaglobulinemia and have defective antibody responses because of increased IgG catabolism. J Immunol. 1997;159:4781–4792. [PubMed] [Google Scholar]
- 32.Bonifacio E, Atkinson MA, Eisenbarth GS, Serreze DV, Kay TW, Lee-Chan E, Singh B. International Workshop on Lessons from Animal Models for Human Type 1 Diabetes: identification of insulin but not glutamic acid decarboxylase or IA-2 as specific autoantigens of humoral autoimmunity in nonobese diabetic mice. Diabetes. 2001;50:2451–2458. doi: 10.2337/diabetes.50.11.2451. [DOI] [PubMed] [Google Scholar]
- 33.Turchaninova MA, Davydov A, Britanova OV, Shugay M, Bikos V, Egorov ES, Kirgizova VI, Merzlyak EM, Staroverov DB, Bolotin DA, Mamedov IZ, Izraelson M, Logacheva MD, Kladova O, Plevova K, Pospisilova S, Chudakov DM. High-quality full-length immunoglobulin profiling with unique molecular barcoding. Nat Protoc. 2016;11:1599–1616. doi: 10.1038/nprot.2016.093. [DOI] [PubMed] [Google Scholar]
- 34.Shugay M, Britanova OV, Merzlyak EM, Turchaninova MA, Mamedov IZ, Tuganbaev TR, Bolotin DA, Staroverov DB, Putintseva EV, Plevova K, Linnemann C, Shagin D, Pospisilova S, Lukyanov S, Schumacher TN, Chudakov DM. Towards error-free profiling of immune repertoires. Nat Methods. 2014;11:653–655. doi: 10.1038/nmeth.2960. [DOI] [PubMed] [Google Scholar]
- 35.Bolotin DA, Poslavsky S, Mitrophanov I, Shugay M, Mamedov IZ, Putintseva EV, Chudakov DM. MiXCR: software for comprehensive adaptive immunity profiling. Nat Methods. 2015;12:380–381. doi: 10.1038/nmeth.3364. [DOI] [PubMed] [Google Scholar]
- 36.Shugay M, Bagaev DV, Turchaninova MA, Bolotin DA, Britanova OV, Putintseva EV, Pogorelyy MV, Nazarov VI, Zvyagin IV, Kirgizova VI, Kirgizov KI, Skorobogatova EV, Chudakov DM. VDJtools: Unifying Post-analysis of T Cell Receptor Repertoires. PLoS Comput Biol. 2015;11:e1004503. doi: 10.1371/journal.pcbi.1004503. [DOI] [PMC free article] [PubMed] [Google Scholar]
- 37.Luzina IG, Atamas SP, Storrer CE, daSilva LC, Kelsoe G, Papadimitriou JC, Handwerger BS. Spontaneous formation of germinal centers in autoimmune mice. J Leukoc Biol. 2001;70:578–584. [PubMed] [Google Scholar]
- 38.Petro JB, Gerstein RM, Lowe J, Carter RS, Shinners N, Khan WN. Transitional type 1 and 2 B lymphocyte subsets are differentially responsive to antigen receptor signaling. J Biol Chem. 2002;277:48009–48019. doi: 10.1074/jbc.M200305200. [DOI] [PubMed] [Google Scholar]
- 39.Su TT, Rawlings DJ. Transitional B lymphocyte subsets operate as distinct checkpoints in murine splenic B cell development. J Immunol. 2002;168:2101–2110. doi: 10.4049/jimmunol.168.5.2101. [DOI] [PubMed] [Google Scholar]
- 40.Kuraoka M, Holl TM, Liao D, Womble M, Cain DW, Reynolds AE, Kelsoe G. Activation-induced cytidine deaminase mediates central tolerance in B cells. Proc Natl Acad Sci U S A. 2011;108:11560–11565. doi: 10.1073/pnas.1102571108. [DOI] [PMC free article] [PubMed] [Google Scholar]
- 41.Dahlberg CI, He M, Visnes T, Torres ML, Cortizas EM, Verdun RE, Westerberg LS, Severinson E, Strom L. A novel mouse model for the hyper-IgM syndrome: a spontaneous activation-induced cytidine deaminase mutation leading to complete loss of Ig class switching and reduced somatic hypermutation. J Immunol. 2014;193:4732–4738. doi: 10.4049/jimmunol.1401242. [DOI] [PMC free article] [PubMed] [Google Scholar]
- 42.Tomayko MM, Steinel NC, Anderson SM, Shlomchik MJ. Cutting edge: Hierarchy of maturity of murine memory B cell subsets. J Immunol. 2010;185:7146–7150. doi: 10.4049/jimmunol.1002163. [DOI] [PMC free article] [PubMed] [Google Scholar]
- 43.Revy P, Muto T, Levy Y, Geissmann F, Plebani A, Sanal O, Catalan N, Forveille M, Dufourcq-Labelouse R, Gennery A, Tezcan I, Ersoy F, Kayserili H, Ugazio AG, Brousse N, Muramatsu M, Notarangelo LD, Kinoshita K, Honjo T, Fischer A, Durandy A. Activation-induced cytidine deaminase (AID) deficiency causes the autosomal recessive form of the Hyper-IgM syndrome (HIGM2) Cell. 2000;102:565–575. doi: 10.1016/s0092-8674(00)00079-9. [DOI] [PubMed] [Google Scholar]
- 44.Antonioli L, Pacher P, Vizi ES, Hasko G. CD39 and CD73 in immunity and inflammation. Trends Mol Med. 2013;19:355–367. doi: 10.1016/j.molmed.2013.03.005. [DOI] [PMC free article] [PubMed] [Google Scholar]
- 45.Cekic C, Linden J. Purinergic regulation of the immune system. Nat Rev Immunol. 2016;16:177–192. doi: 10.1038/nri.2016.4. [DOI] [PubMed] [Google Scholar]
- 46.Kaku H, Cheng KF, Al-Abed Y, Rothstein TL. A novel mechanism of B cell-mediated immune suppression through CD73 expression and adenosine production. J Immunol. 2014;193:5904–5913. doi: 10.4049/jimmunol.1400336. [DOI] [PMC free article] [PubMed] [Google Scholar]
- 47.Kleffel S, Vergani A, Tezza S, Ben Nasr M, Niewczas MA, Wong S, Bassi R, D'Addio F, Schatton T, Abdi R, Atkinson M, Sayegh MH, Wen L, Wasserfall CH, O'Connor KC, Fiorina P. Interleukin-10+ regulatory B cells arise within antigen-experienced CD40+ B cells to maintain tolerance to islet autoantigens. Diabetes. 2015;64:158–171. doi: 10.2337/db13-1639. [DOI] [PMC free article] [PubMed] [Google Scholar]
- 48.Colwell RK, Chao A, Gotelli NJ, Lin SY, Mao CX, Chazdon RL, Longino JT. Models and estimators linking individual-based and sample-based rarefaction, extrapolation and comparison of assemblages. Journal of Plant Ecology. 2012;5:3–21. [Google Scholar]
- 49.Britanova OV, Putintseva EV, Shugay M, Merzlyak EM, Turchaninova MA, Staroverov DB, Bolotin DA, Lukyanov S, Bogdanova EA, Mamedov IZ, Lebedev YB, Chudakov DM. Age-related decrease in TCR repertoire diversity measured with deep and normalized sequence profiling. J Immunol. 2014;192:2689–2698. doi: 10.4049/jimmunol.1302064. [DOI] [PubMed] [Google Scholar]
- 50.Bono MR, Fernandez D, Flores-Santibanez F, Rosemblatt M, Sauma D. CD73 and CD39 ectonucleotidases in T cell differentiation: Beyond immunosuppression. FEBS Lett. 2015;589:3454–3460. doi: 10.1016/j.febslet.2015.07.027. [DOI] [PubMed] [Google Scholar]
- 51.Mauri C, Bosma A. Immune regulatory function of B cells. Annu Rev Immunol. 2012;30:221–241. doi: 10.1146/annurev-immunol-020711-074934. [DOI] [PubMed] [Google Scholar]
- 52.Ray A, Basu S, Williams CB, Salzman NH, Dittel BN. A novel IL-10-independent regulatory role for B cells in suppressing autoimmunity by maintenance of regulatory T cells via GITR ligand. J Immunol. 2012;188:3188–3198. doi: 10.4049/jimmunol.1103354. [DOI] [PMC free article] [PubMed] [Google Scholar]
- 53.Berland R, Fernandez L, Kari E, Han JH, Lomakin I, Akira S, Wortis HH, Kearney JF, Ucci AA, Imanishi-Kari T. Toll-like receptor 7-dependent loss of B cell tolerance in pathogenic autoantibody knockin mice. Immunity. 2006;25:429–440. doi: 10.1016/j.immuni.2006.07.014. [DOI] [PubMed] [Google Scholar]
- 54.Meyers G, Ng YS, Bannock JM, Lavoie A, Walter JE, Notarangelo LD, Kilic SS, Aksu G, Debre M, Rieux-Laucat F, Conley ME, Cunningham-Rundles C, Durandy A, Meffre E. Activation-induced cytidine deaminase (AID) is required for B-cell tolerance in humans. Proc Natl Acad Sci U S A. 2011;108:11554–11559. doi: 10.1073/pnas.1102600108. [DOI] [PMC free article] [PubMed] [Google Scholar]
- 55.Henry-Bonami RA, Williams JM, Rachakonda AB, Karamali M, Kendall PL, Thomas JW. B lymphocyte “original sin” in the bone marrow enhances islet autoreactivity in type 1 diabetes-prone nonobese diabetic mice. Journal of Immunology. 2013;190:5992–6003. doi: 10.4049/jimmunol.1201359. [DOI] [PMC free article] [PubMed] [Google Scholar]
- 56.Wei M, Shinkura R, Doi Y, Maruya M, Fagarasan S, Honjo T. Mice carrying a knock-in mutation of Aicda resulting in a defect in somatic hypermutation have impaired gut homeostasis and compromised mucosal defense. Nat Immunol. 2011;12:264–270. doi: 10.1038/ni.1991. [DOI] [PubMed] [Google Scholar]
- 57.Kriegel MA, Sefik E, Hill JA, Wu HJ, Benoist C, Mathis D. Naturally transmitted segmented filamentous bacteria segregate with diabetes protection in nonobese diabetic mice. Proc Natl Acad Sci U S A. 2011;108:11548–11553. doi: 10.1073/pnas.1108924108. [DOI] [PMC free article] [PubMed] [Google Scholar]
- 58.Matsushita T, Yanaba K, Bouaziz JD, Fujimoto M, Tedder TF. Regulatory B cells inhibit EAE initiation in mice while other B cells promote disease progression. J Clin Invest. 2008;118:3420–3430. doi: 10.1172/JCI36030. [DOI] [PMC free article] [PubMed] [Google Scholar]
Associated Data
This section collects any data citations, data availability statements, or supplementary materials included in this article.