Significance
Arctic amplification is a robust feature of climate response to global warming, with large impacts on ecosystems and societies. A long-standing mystery is that a pronounced Arctic warming occurred during the early 20th century when the rate of interdecadal change in radiative forcing was much weaker than at present. Here, using observations and model experiments, we show that the combined effect of internally generated Pacific and Atlantic interdecadal variabilities intensified the Arctic land warming in the early 20th century. The synchronized Pacific–Atlantic warming drastically alters planetary-scale atmospheric circulations over the Northern Hemisphere that transport warm air into the Arctic. Our results highlight the importance of regional sea surface temperature changes for Arctic climate and constrain model projections in this important region.
Keywords: early 20th-century Arctic warming, Pacific decadal variability, Atlantic multidecadal variability, ocean–atmosphere interaction, climate variability
Abstract
With amplified warming and record sea ice loss, the Arctic is the canary of global warming. The historical Arctic warming is poorly understood, limiting our confidence in model projections. Specifically, Arctic surface air temperature increased rapidly over the early 20th century, at rates comparable to those of recent decades despite much weaker greenhouse gas forcing. Here, we show that the concurrent phase shift of Pacific and Atlantic interdecadal variability modes is the major driver for the rapid early 20th-century Arctic warming. Atmospheric model simulations successfully reproduce the early Arctic warming when the interdecadal variability of sea surface temperature (SST) is properly prescribed. The early 20th-century Arctic warming is associated with positive SST anomalies over the tropical and North Atlantic and a Pacific SST pattern reminiscent of the positive phase of the Pacific decadal oscillation. Atmospheric circulation changes are important for the early 20th-century Arctic warming. The equatorial Pacific warming deepens the Aleutian low, advecting warm air into the North American Arctic. The extratropical North Atlantic and North Pacific SST warming strengthens surface westerly winds over northern Eurasia, intensifying the warming there. Coupled ocean–atmosphere simulations support the constructive intensification of Arctic warming by a concurrent, negative-to-positive phase shift of the Pacific and Atlantic interdecadal modes. Our results aid attributing the historical Arctic warming and thereby constrain the amplified warming projected for this important region.
The Arctic has warmed faster than the global average by a factor of 2 or more since the mid-20th century, a phenomenon known as the Arctic amplification. The recent temperature warming over the Arctic is strongly linked to a drastic reduction in sea ice extent since the 1970s, contributing to the Arctic amplification through positive ice-albedo feedbacks (1–3). A similar rapid warming occurred in the Arctic during the early 20th century (4–8). Compared with the recent warming, the early 20th-century Arctic warming (hereafter referred to as the early Arctic warming) is mysterious as greenhouse gas (GHG) radiative forcing was three to four times weaker than at present (9) and changes in sea ice extent were small (10). The comparison of these two warming epochs suggests that mechanisms other than GHG forcing are important for the early Arctic warming.
Several hypotheses have been proposed for the early Arctic warming, including intensified natural forcing due to decreased volcanic aerosols and increased solar radiation (11, 12); increased cloud long-wave emissivity due to sulfate aerosols transported from Central Europe (6, 13); uncertain but possible reduction in the Arctic sea ice extent (4, 5, 14); variability of the North Atlantic ocean–ice–atmosphere system (15); and atmospheric internal variability (16). Neither coupled ocean–atmosphere models nor atmospheric models driven by historical radiative forcing and observed sea surface temperature (SST)/sea ice are yet able to simulate the observed early Arctic warming (5, 14, 16, 17), hampering the study of this important phenomenon. Overlooked is the possibility that interdecadal SST variations may be underestimated in reconstructed datasets (18), especially before 1950 when observations were sparse. In other words, the contribution of oceanic variability to the early Arctic warming could have been underestimated. We show that it is indeed the case; atmospheric model simulations capture the early 20th-century Arctic warming when interdecadal SST variations are properly prescribed. Our objective is to investigate the influence of oceanic internal variability on the early Arctic warming, with a particular focus on the Pacific and Atlantic interdecadal variability, and atmospheric circulations.
Results
Observed and Simulated Arctic Warming During the Early 20th Century.
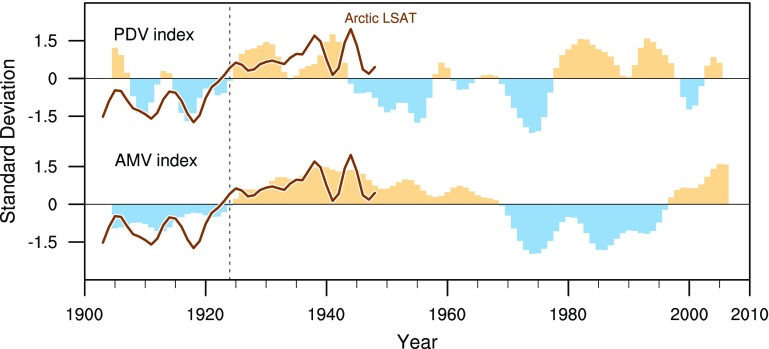
The Pacific decadal variability (PDV) and Atlantic multidecadal variability (AMV) are characterized by warm and cold anomalies of the Pacific and North Atlantic SST. Their dominant patterns are known as the Pacific Decadal Oscillation (PDO) (19) and Atlantic Multidecadal Oscillation (AMO) (20). We define the PDV index as the principal component of the first empirical orthogonal function (EOF) for detrended SST anomalies over the Pacific (120°E–70°W, 50°S–60°N) by taking account of its extension to the tropical and South Pacific (19, 21). The AMV index is defined as the SST anomaly averaged over the North Atlantic (60°W–0°, equator–70°N) (22). Supported by reconstructed SSTs and climate proxies (23–27), these two interdecadal modes shifted from the cold to warm phase about the same time in the mid-1920s, in sync with the Arctic warming (Fig. S1). This concurrent shift provides a unique opportunity to explore the combined influence of PDV and AMV on the Arctic climate. This section presents 35-y trend patterns for 1908–1942, a period when the Pacific, Atlantic, and Arctic mean land surface air temperature (LSAT) all drastically warmed (Fig. S1).
Fig. S1.
Observed time series of the normalized November–March mean (Top) Pacific decadal variability (PDV) and (Bottom) Atlantic multidecadal variability (AMV) indices (shaded bars). Solid brown line indicates the mean of observed Arctic land surface air temperature (LSAT) time series presented in Fig. 2A. The PDV index is defined as the principal component of the first empirical orthogonal function (EOF) for detrended, 8-y low-pass–filtered November–March mean sea surface temperature (SST) anomalies over the Pacific (120°E–70°W, 50°S–60°N). Using the same data, the AMV index is defined as the SST anomaly averaged over the North Atlantic (60°W–0°, equator–70°N). Vertical dashed line indicates the year 1924, around when the PDV and AMV indices concurrently shifted from their cold to warm phases.
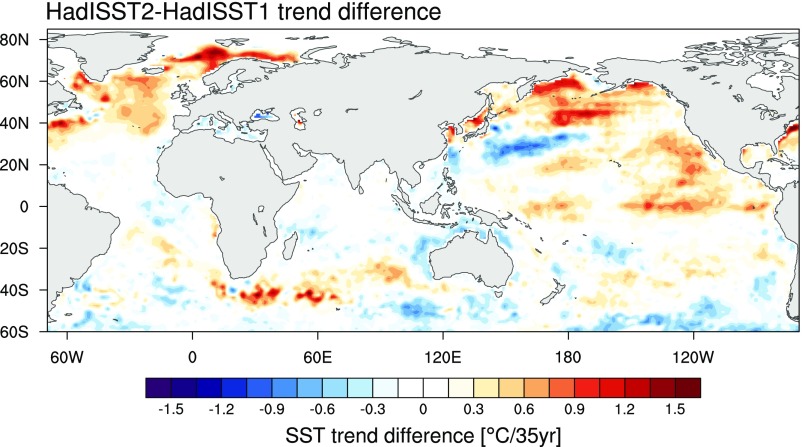
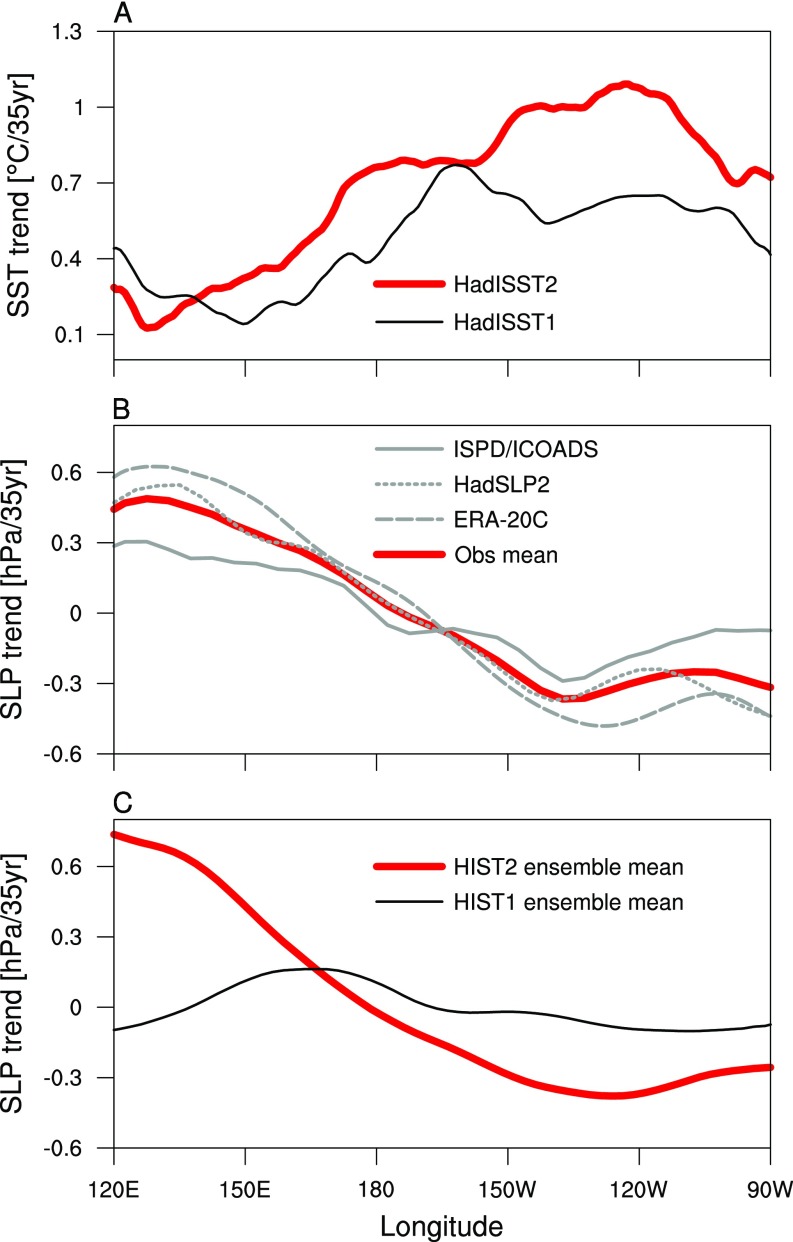
We first compare SST trend patterns from two different datasets: the European Centre for Medium-Range Weather Forecast 20th-Century Reanalysis (ERA-20C) (28) and the UK Met Office Hadley Centre Sea Ice and SST (HadISST), version 1 (29). The former is also known as the HadISST, version 2.1 (28, 30) (hereafter referred to as HadISST2), which incorporates several million more in situ observations than HadISST1, applies more comprehensive bias adjustments, and uses reconstruction methods that make use of every single observation (30). The HadISST2 trend pattern for 1908–1942 clearly exhibits the cold-to-warm phase shifts of PDO and AMO, with significant warming in the equatorial Pacific, the Bering Sea, the Gulf of Alaska, and the North Atlantic (Fig. 1A). Although the timing of phase shift and basin-scale patterns are similar, HadISST1 does not capture the amplitudes of zonally elongated equatorial Pacific warming and North Atlantic warming (Fig. 1B). Overall, larger warming trends of HadISST2 closely follow the patterns of positive SST anomalies associated with warm PDO and AMO (Fig. S2), contributing to a larger increase in the global mean SST. Furthermore, the HadISST2 trends show a basin-scale weakening of zonal gradient over the equatorial Pacific (130°E–130°W), physically consistent with that of observed sea level pressure (SLP) trends featuring a Walker circulation slowdown (Fig. S3 A and B).
Fig. 1.
Comparison of November–March mean SST trends for 1908–1942. (A) The UK Met Office Hadley Centre sea ice and SST, version 2 (HadISST2), and (B) version 1 (HadISST1). Stippling indicates trends exceeding the 90% confidence level.
Fig. S2.
SST trend difference between HadISST2 and HadISST1 for 1908–1942.
Fig. S3.
Comparison of November–March mean SST and sea level pressure (SLP) trends averaged over the tropical Pacific (10°S–10°N) for 1908–1942. (A) SST trends from HadISST2 (red) and HadISST1 (black), (B) observed SLP trends from the International Surface Pressure Databank/International Comprehensive Ocean–Atmosphere Data Set (ISPD/ICOADS; gray solid), the UK Met Office Hadley Centre mean SLP (HadSLP2; gray short dashed), the European Centre for Medium-Range Weather Forecast 20th-Century Reanalysis (ERA-20C; gray long dashed) and their mean (red), and (C) simulated SLP trends from the HIST2 (red) and HIST1 (black) experiments.
We evaluate the contribution by the concurrent phase shift of PDV and AMV modes to the early 20th-century Arctic warming by performing a set of 18-member ensemble experiments using the US National Oceanic and Atmospheric Administration (NOAA) Geophysical Fluid Dynamics Laboratory (GFDL) AM2.1 (31) atmospheric general circulation model (AGCM). The model is forced by HadISST2 (HIST2 experiment) and HadISST1 (HIST1 experiment), in which the observed monthly SSTs are prescribed in the global oceans. We also perform the “Tropical Ocean–Global Atmosphere” (HIST2-TOGA) and “no PDV/AMV mode” (HIST2-N) experiments using HadISST2. In the HIST2-TOGA experiments, the observed monthly SSTs are prescribed only in the tropics (20°N–20°S) with climatological SSTs poleward of 30° and linearly blended SSTs over the latitude band 20°–30° in both hemispheres. In the HIST2-N experiments, SST anomalies associated with the PDV and AMV patterns are removed based on the linear regression. Each ensemble member is integrated for 1899–1950 with the same historical radiative forcing and the same monthly sea ice concentration from HadISST2 (32) but begins from a slightly different initial atmospheric condition. The prescribed sea ice extent over the Northern Hemisphere shows no significant trend during the early 20th century (32) but is presumably subject to large uncertainty (4, 5, 14). For this reason, we discuss only SST effects in the present study.
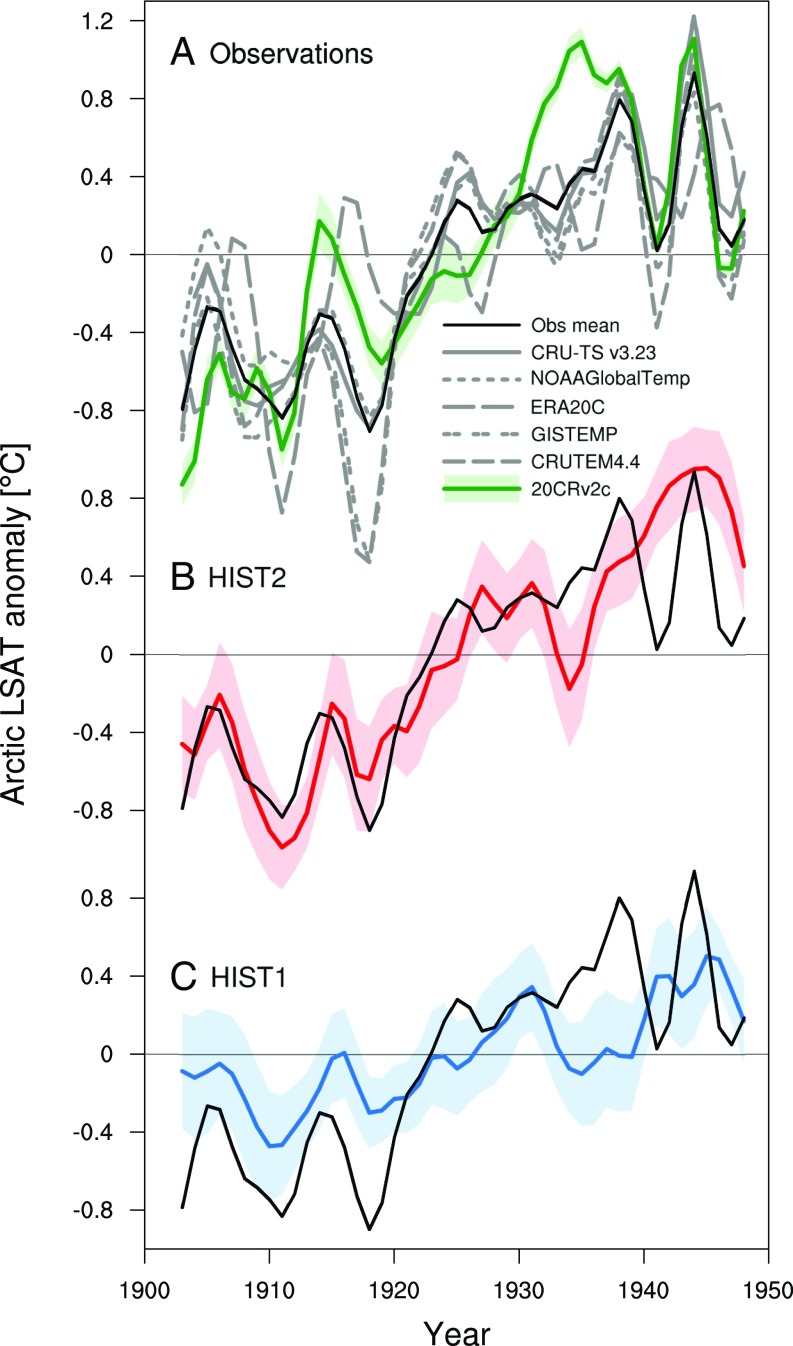
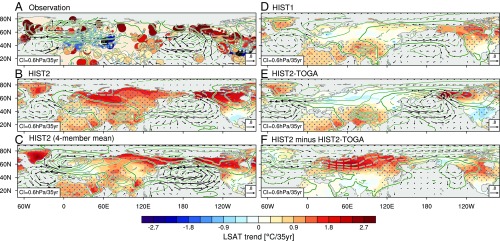
To obtain an observational mean of the Arctic LSAT time series, we use six datasets from the NOAA Merged Land Ocean Global Surface Temperature (NOAAGlobalTemp), version 4.0.1 (33); the US National Aeronautics and Space Administration/Goddard Institute for Space Studies surface temperature analysis (GISTEMP) with 250-km smoothing (34); the Climatic Research Unit (CRU) Temperature, version 4.4 (CRUTEM4.4) (35); the CRU time series, version 3.23 (CRU-TS v3.23) (36); ERA-20C (28); and the NOAA 20th-Century Reanalysis, version 2c (20CRv2c) (37). We also use the bias-corrected station data of the Global Historical Climatology Network-Monthly, version 3 (GHCN-M) (38), to capture the actual spatial distributions of LSAT trends. Figs. 2 and 3 compare observed and simulated Arctic LSAT trends in boreal winter (November–March), a season when the early Arctic warming was most pronounced (4, 39) (hereafter all figures show the same seasonal mean). The observed early Arctic warming is apparent in all LSAT datasets, with a rapid warming trend during the 1920s (Fig. 2A). Significant warming trends are detected at weather stations north of 60°N (Fig. 3A). Despite no significant trend in the prescribed sea ice extent (32), the HIST2 run successfully reproduces the temporal and spatial variations of the early Arctic warming (Figs. 2B and 3 B and C). It captures the seasonality as well, with a maximum warming in boreal winter and minimum in summer (Fig. S4). The HIST1 run also simulates the early Arctic warming within the range of observational uncertainty (Figs. 2C and 3D). However, it underestimates the warming trend with a magnitude 53% weaker than observations (Table S1), consistent with other AGCM simulations forced with earlier SST datasets (5, 14). The HIST2-N run reproduces only 57% of the observed Arctic warming (Fig. S5A and Table S1), suggesting that the intense early Arctic warming cannot be fully explained without the influence of PDV and AMV.
Fig. 2.
Comparison of observed and simulated Arctic mean LSAT variations (60°–90°N). Time series of November–March mean Arctic LSAT anomaly, based on (A) observations, (B) HIST2, and (C) HIST1 experiments. For observations, six datasets are obtained from CRU-TS, version 3.23 (36) (gray solid line); NOAAGlobalTemp (33) (gray dotted line); ERA-20C (28) (gray long-dashed line); GISTEMP (34) (gray double-dotted line); CRUTEM4.4 (35) (gray short dashed line); and 20CRv2c (37) (green line with shading). The observational mean is superimposed in black. Shading indicates the two-tailed 95% confidence interval for each ensemble mean. All time series are smoothed with a binomially weighted 5-y running average.
Fig. 3.
Observed and simulated trend patterns in LSAT and near-surface atmospheric circulation. Trends of LSAT (filled circles for A, shading for B–D), SLP (contour interval 0.6 hPa per 35 y), and marine surface wind (vectors; in meters per second per 35 y) for 1908–1942, based on (A) observations from GHCN-M (38) and the International Surface Pressure Databank (59)/International Comprehensive Ocean–Atmosphere Data Set (60), and simulations from (B) full HIST2, (C) four-member HIST2, (D) full HIST1, and (E) full HIST2-TOGA ensemble means. (F) HIST2 minus HIST2-TOGA difference. Larger circles in A and stippling in B–F indicate LSAT trends exceeding the 90% confidence level. Positive (negative) SLP trends are indicated by solid (dashed) contours, and zero contours thickened.
Fig. S4.
Seasonal trends of June–August (JJA), September–November (SON), December–February (DJF), and March–May (MAM) mean Arctic LSAT for 1908–1942. See legends inside the panel for meaning of symbols and lines. Error bars for simulated and 20CRv2c trends indicate the two-tailed 95% confidence interval for their ensemble mean.
Table S1.
Comparison of November–March mean Arctic LSAT trends for 1908–1942 between observations and AGCM experiments
| Experiment | Entire Arctic | North American Arctic | Eurasian Arctic |
| Observational mean | 1.402 | 1.704 | 1.214 |
| HIST2 | 1.619 ± 0.313 (1.15) | 1.832 ± 0.357 (1.07) | 1.477 ± 0.402 (1.22) |
| HIST2-TOGA | 0.606 ± 0.272 (0.43) | 1.528 ± 0.417 (0.90) | −0.007 ± 0.310 (−0.01) |
| HIST2 minus HIST2-TOGA | 1.012 ± 0.403 (0.72) | 0.303 ± 0.603 (0.18) | 1.484 ± 0.487 (1.22) |
| HIST1 | 0.654 ± 0.352 (0.47) | 1.138 ± 0.351 (0.67) | 0.332 ± 0.483 (0.27) |
| HIST2-N | 0.797 ± 0.237 (0.57) | 0.761 ± 0.265 (0.45) | 0.821 ± 0.303 (0.68) |
For AGCM experiments, the ensemble mean trend and its two-sided 95% confidence interval (in degrees Celsius per 35 y) are shown, with significant trends indicated in bold. Each value in parentheses is a rate against the observational mean of Arctic LSAT trend.
Fig. S5.
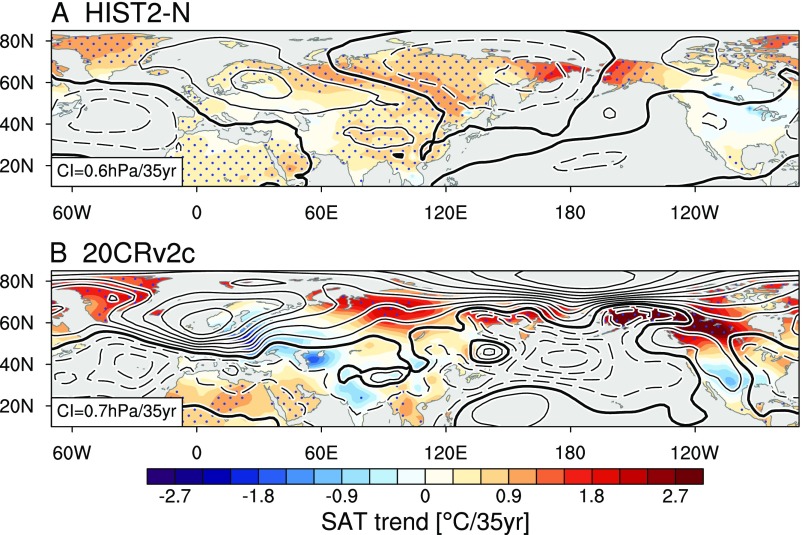
November–March mean LSAT (shading; in degrees Celsius per 35 y) and SLP (contour; in hectopascals per 35 y) trends for 1908–1942, based on (A) the HIST2-N experiment (contour interval, 0.6 hPa per 35 y) and (B) the NOAA 20th-Century Reanalysis, version 2c (20CRv2c) (37) (contour interval, 0.7 hPa per 35 y). Positive (negative) contours are solid (dashed) lines, and zero contours are thickened.
The near-surface atmospheric circulation change is important for the early Arctic warming. Characteristic of the cold-to-warm PDO shift (19, 40, 41), a Pacific/North America (PNA) pattern develops in response to enhanced atmospheric convection over the tropical western to central Pacific (Fig. S6A), with a deepened Aleutian low, increased SLPs over North America, and intensified cyclonic surface winds over the North Pacific (Fig. 3A). Intensified southeasterly winds along the coast of the Gulf of Alaska advect warm air from the Pacific into the North American Arctic. Over the North Atlantic, a northeast–southwest dipole pattern was observed in SLP. These SLP trend patterns are also captured by 20CRv2c with larger amplitudes (Fig. S5B). In the winter climatology, strong temperature gradients are generated between the warmer ice-free North Atlantic and colder adjacent land. Easterly-to-southeasterly wind trends around 60°N enhance warm advection of this climatological temperature gradient, warming Greenland and Iceland. A similar effect works for Eurasian Arctic warming. North of the Scandinavian peninsula, westerly-to-northwesterly winds intensify associated with the positive SLP trends over Europe, bringing warm air from ocean to land. In midlatitude Eurasia, easterly wind trends cause the cooling due to cold advection of the climatological westward LSAT gradient. Weak but similar patterns with opposite signs were also observed from the 1960s to the mid-1970s (Fig. S7), a period when the PDV and AMV indices concurrently shifted from the positive to negative phase (Fig. S1).
Fig. S6.
Observed and simulated precipitation trends for 1908–1942, calculated from November–March mean anomalies. (A) Observations from the University of East Anglia Climate Research Unit (58), and simulations from (B) HIST2, (C) HIST1, and (D) HIST2-TOGA. Stippling in B–D indicates trends exceeding the 90% confidence level. Red solid and blue dashed lines in A are the contours of ±20 mm⋅mo−1 per 35 y obtained from the HIST2 experiment.
Fig. S7.
Observed November–March mean trend patterns for 1960–1976. (A) LSAT (filled circles; in degrees Celsius per 17 y), SLP (contour interval, 1 hPa per 17 y), and marine surface wind (vectors; in meters per second per 17 y). Larger circles in A and stippling in B indicate LSAT and SST trends exceeding the 90% confidence level, respectively. Positive (negative) SLP trends are indicated by solid (dashed) contours, and zero contours thickened.
HIST2 simulates the observed changes in atmospheric circulation very well, including the PNA-like response over the North Pacific, and dipolar SLP trends over the North Atlantic (Fig. 3B). We note that both the weakening of zonal SLP gradient and the precipitation changes over the equatorial Pacific are reproduced in HIST2 (Figs. S3C and S6B). The full ensemble mean shows an excessive warming over Europe as the weaker anticyclonic circulation trend reduces cold advection compared with observations. We use the meridional difference in SLP trends between (50°–70°N, 0°–30°E) and (30°–90°N, 0°–30°E) to track the strength of anticyclonic trend over the Scandinavian peninsula. The ensemble mean and spread (1 SD of the intermember spread) are 0.336 ± 1.098 hPa/35 y, suggesting strong internal atmospheric variability in the region. If you choose four members of the HIST2 ensemble that feature the strongest anticyclonic trends, the subensemble mean simulates a similar SLP pattern to observations (Fig. 3C).
HIST1 simulates a weaker PNA-like response associated with moderate SST warming and suppressed atmospheric convection in the equatorial western Pacific (Figs. 1B and 3D, and Fig. S6C), reducing LSAT warming trends over the North American Arctic. In addition, the anticyclonic trends over Europe is displaced northeastward, leading to insignificant LSAT trends over most of the Eurasian Arctic. Similarly, HIST2-N does not simulate the observed changes in atmospheric circulation, leading to the reduced Arctic warming (Fig. S5A and Table S1). We stress that radiative and sea ice forcings are identical among our experiments, pointing to the importance of enhanced SST warming for atmospheric circulation changes.
The tropical SST forcing, especially from the tropical eastern Pacific, is important for the North American Arctic warming. The HIST2-TOGA experiment simulates the PNA-like SLP trend pattern that enhances poleward warm advection (Fig. 3E). Consistent with previous studies (42, 43), this atmospheric response is linked to enhanced atmospheric convection over the tropical western to central Pacific (Fig. S6D) that excites poleward-propagating Rossby wave trains that transport heat and water vapor into the Arctic region (44, 45). In HIST2 minus HIST2-TOGA, by contrast, such atmospheric patterns disappear, and instead, the Arctic polar vortex deepens with intensified meridional SLP gradient along the Arctic coast (Fig. 3F). The resultant surface westerly trends significantly warm the Eurasian Arctic due to enhanced warm advection (46), consistent with the atmospheric response to the Atlantic Meridional Overturning Circulation (AMOC) (47). HIST2-TOGA explains about 90% of the observed North American Arctic warming, but it does not contribute to the Eurasian Arctic warming at all (Table S1). On the other hand, HIST2 minus HIST2-TOGA explains most of the Eurasian Arctic warming, whereas it does not significantly contribute the North American Arctic warming. These tropical and extratropical forcings play different roles in driving atmospheric circulation, but they are both necessary to fully account for the pan-Arctic land warming.
Internally Generated Arctic LSAT Variability in Coupled Ocean–Atmosphere Models.
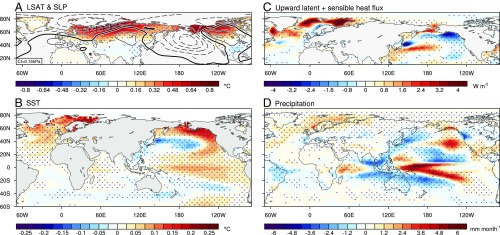
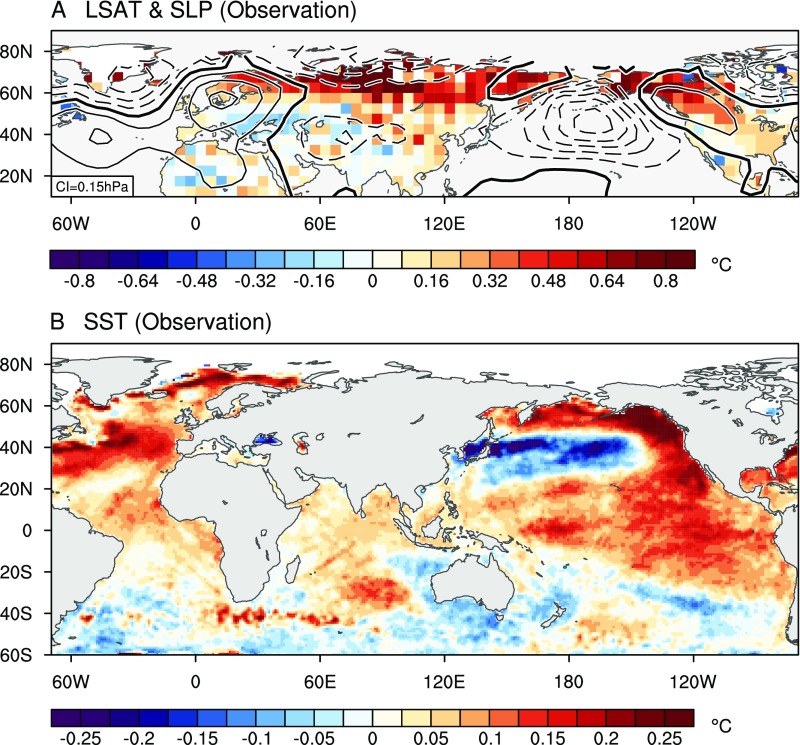
We turn to the Coupled Model Intercomparison Project Phase 5 (CMIP5) preindustrial control (piControl) simulations to address the question of what patterns of SST and atmospheric circulation variations are robustly associated with the Arctic warming. Here, we present the composite of 8-y low-pass–filtered November–March mean anomalies regressed onto the normalized Arctic LSAT anomaly, based on 37 CMIP5 coupled ocean–atmosphere models (Fig. 4). Compared with the observed LSAT regression from CRUTEM4.4 (Fig. S8A), CMIP5 models capture the amplitude of Arctic warming quite well (Fig. 4A) (observation: 0.441 °C; CMIP5 models: 0.425 ± 0.025 °C at the two-sided P = 0.05 level). An SST pattern with both PDO and AMO in positive phase emerges (Fig. 4B), bearing a striking resemblance to the observed SST pattern (Fig. S8B). The SLP patterns are also similar to the observation, including the deepened Aleutian low and intensified meridional SLP gradient over northern Eurasia (Fig. 4A and Fig. S8A). The precipitation composite exhibits enhanced atmospheric convection over the tropical western to central Pacific (Fig. 4D), further supporting the influence of tropical Pacific forcing on the Aleutian low.
Fig. 4.
Composite anomalies regressed onto the normalized Arctic mean LSAT anomaly, based on 37 CMIP5 piControl simulations. (A) LSAT (shading; in degrees Celsius) and SLP (contour interval, 0.15 hPa; zero contours thickened, positive solid, and negative dashed), (B) SST (in degrees Celsius), (C) upward latent and sensible heat fluxes (in watts per square meter), and (D) precipitation (in millimeters per month). Stippling indicates the composite regression anomalies exceeding the 95% confidence level.
Fig. S8.
Observed anomalies of (A) LSAT (shading; in degrees Celsius) and SLP (contour interval, 0.15 hPa; zero contours thickened, positive solid, and negative dashed), and (B) SST (in degrees Celsius) regressed onto the normalized Arctic mean LSAT anomaly for 1900–2000. LSAT, SLP, and SST are obtained from the Climatic Research Unit Temperature, version 4.4 (CRUTEM4.4); ICOADS/ISPD; and HadISST2, respectively. Detrended, 8-y low-pass–filtered November–March mean anomalies are used.
Although the extratropical North Pacific SST anomalies are largely a response to atmospheric teleconnection from the tropics, the North Atlantic shows signs of ocean-to-atmosphere feedback. The North Atlantic warms despite upward surface heat flux anomalies that occupy much of the extratropical basin (Fig. 4C), suggesting an ocean dynamical origin of the warming (e.g., the intensified Gulf stream and AMOC) (48). This is corroborated by precipitation increases along the Gulf stream to the Barents/Kara Sea (Fig. 4D). The oceanic forcing presumably intensifies the meridional SLP gradient over northern Eurasia, contributing to the Eurasian Arctic warming.
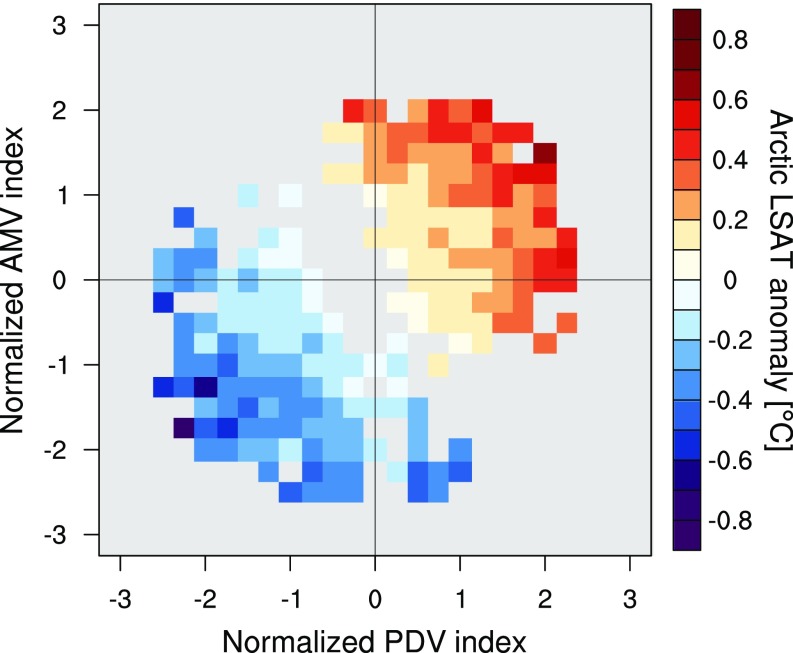
Fig. 5 shows the November–March mean composite anomalies of Arctic LSAT as a function of the normalized PDV and AMV indices. Strong positive and negative anomalies of Arctic LSAT are diagonally distributed between the first and third quadrants of the PDV/AMV plane, indicating that a coherent interdecadal variability of the Pacific and Atlantic intensifies the Arctic warming and cooling. A multivariate regression analysis supports the combined effect of the two interdecadal variabilities. The standard regression coefficients for the normalized PDV and AMV indices are 0.34 (58%) and 0.245 (42%), respectively, indicating comparable contributions from the Pacific and North Atlantic.
Fig. 5.
Composite anomalies of Arctic mean LSAT (in degrees Celsius) as a function of the normalized PDV and AMV indices, based on 37 CMIP5 piControl simulations. The PDV index is defined as the principal component of the first EOF for detrended, 8-y low-pass–filtered November–March mean SST anomalies over the Pacific (120°E–70°W, 50°S–60°N). Using the same data, the AMV index is defined as the SST anomaly averaged over the North Atlantic (60°W–0°, equator–70°N). Insignificant composite anomalies at the 95% confidence level are shaded in gray.
Summary and Discussion
We have shown that a concurrent phase shift of PDV and AMV modes is a major mechanism for the unusually intense early 20th-century Arctic warming, and that the atmospheric circulation change is important. Our AGCM experiments indicate constructive contributions of the tropical and extratropical SST forcings. The tropical Pacific warming excites a PNA-like circulation change while the extratropical SST warming strengthens meridional SLP gradient over northern Eurasia. The North Atlantic plays a key role in changing atmospheric circulation over the Eurasian Arctic. The Pacific/Atlantic SST warming in the early 20th century was underrepresented in previous reconstructed SST datasets. Our AGCM successfully reproduces the magnitude and spatial distribution of the early Arctic warming when the phase shift of PDV/AMV modes is properly represented. Long coupled model simulations confirm that concurrent PDV–AMV phase shifts affect Arctic temperature trends (Fig. 5), highlighting the importance of regional patterns of SST change. The sensitivity to SST also highlights the need for the reliable reconstruction of the historical evolution, especially before 1950.
The early 20th-century Arctic warming may be partly due to the increased GHGs, reduced volcanic aerosols, and solar irradiance changes (11, 12, 49–53). However, it remains challenging to quantify their contribution due to limited observations and uncertainties of model response (54). The majority of CMIP5 models forced with anthropogenic and natural radiative forcings substantially underestimate the early Arctic warming, suggesting a large contribution from internal variability (16, 54, 55). We have identified coupled internal variability of the Pacific and Atlantic as a major factor, in addition to the increase in radiative forcing. Although the relationship between PDV and AMV is a subject of active research (56, 57), our results show that their relative phase evolution has an important effect on temperature change over the Arctic. This has important implications given the high sensitivity of sea ice to climate warming and the fragile ecosystems that are dependent on Arctic ice.
Materials and Methods
SST, LSAT, and Precipitation.
For SST, we used HadISST1 (29) and the lower boundary condition for ERA-20C (28), also known as HadISST2 (30). For HadISST2, we used the 10-member ensemble mean. For gridded LSAT data, we used the NOAAGlobalTemp, version 4.0.1 (33); GISTEMP with 250-km smoothing (34); CRUTEM4.4 (35); CRU TS3.23 (36); ERA-20C (28); and 20CRv2c (37). All Arctic mean LSAT anomalies were averaged poleward of 60°N. For station-based LSAT, we analyzed bias-corrected data of GHCN-M (38). The 35-y trends of GHCN-M data were obtained using only stations with a long observational period. We selected such stations if the total number of 7-y segments with at least one November–March mean exceeds four (five at a maximum). For precipitation, we used rain gauge-based monthly mean gridded products available at the University of East Anglia Climate Research Unit (58).
SLP and Marine Surface Wind.
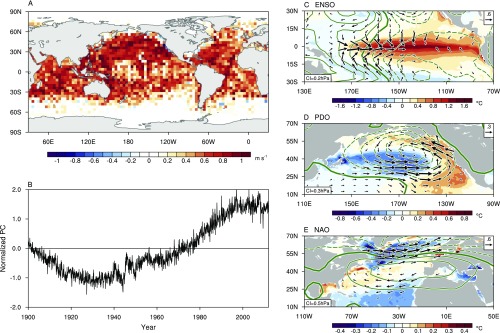
We reconstructed monthly mean SLP and marine surface wind anomaly datasets on a 5° latitude–longitude grid for 1900–2014, based on an EOF decomposition (SI Materials and Methods). For SLP, we merged terrestrial SLPs in the International Surface Pressure Databank, version 3.2.9 (ISPD) (59), and marine SLPs in the International Comprehensive Ocean–Atmosphere Data Set (ICOADS), Release 3.0 (60). Monthly mean SLP datasets from ERA-20C (28), HadSLP2 (61), and 20CRv2c (37) were also used for comparison. For marine surface wind, we used ICOADS3.0 by reducing time-varying biases in scalar wind speed (SI Materials and Methods) (Fig. S9 A and B). Our reconstructed SLP and marine wind anomalies capture major modes of climate variability such as the El Niño/Southern Oscillation (ENSO), PDO, and North Atlantic Oscillation (NAO), with physically consistent SST patterns (Fig. S9 C–E).
Fig. S9.
Reconstruction of SLP and marine surface wind anomalies used in the present study. (A) Spatial pattern (regressed anomaly in meters per second) and (B) principal components of the first EOF mode for uncorrected monthly mean scalar wind anomalies for 1900–2014. The first EOF mode accounts for 18.4% of the total variance. To reduce the time-varying biases, the scalar wind anomalies associated with the first EOF mode have been removed from the uncorrected data. (C–E) Regressed anomalies of SLP (contours; in hectopascals), bias-corrected marine surface wind (vectors; in meters per second), and SST (shading; in degrees Celsius) onto (C) the November–February Niño-3.4, (D) the November–March Pacific Decadal Oscillation (PDO), and (E) the December–March North Atlantic Oscillation (NAO) indices. The Niño-3.4 index is defined as SST anomaly averaged in the central equatorial Pacific (170°–120°W, 5°S–5°N). The PDO index is defined as the principal component of the first EOF mode for the North Pacific SST anomalies (120°E–100°W, 20°–60°N), whereas the NAO index is defined as the first EOF mode for the North Atlantic SLP anomalies (90°W–40°E, 20°–80°N). For the PDO and NAO indices, the 5-y running average is applied for detrended seasonal mean data. The contour interval for SLP anomalies is indicated at the Bottom Left of each panel, with positive (negative) contours solid (dashed), and zero contours thickened.
AGCM Experiments.
We used the NOAA GFDL AM2.1 (31) with a finite-volume grid of 2.5° × 2° and 24 vertical levels. A set of 18-member ensemble experiments were performed with different observed SST datasets of HadISST1 (HIST1) and HadISST2 (HIST2). The TOGA-type experiments were performed using HadISST2 (HIST2-TOGA), in which the observed monthly SSTs are prescribed only in the tropics (20°N–20°S) with climatological SSTs poleward of 30° and linearly blended SSTs over the latitude band 20°–30° in both hemispheres. The HIST2-N experiments were also forced with HadISST2, but SST anomalies associated with the PDV and AMV patterns were removed based on the linear regression. For each experiment, the model was integrated for 1899–1950 with the first year of integration discarded as a spin-up. Each ensemble member was forced with the same CMIP5 historical radiative forcing and the HadISST2 sea ice concentration (32), but began from a slightly different initial atmospheric condition.
CMIP5 piControl Simulations.
We analyzed the piControl simulations from 37 coupled climate models participating in CMIP5. The radiative forcing due to GHGs, aerosols, ozone, and solar irradiance is fixed at the preindustrial level, which allows us to analyze unforced climate variabilities. The models used are ACCESS1.0, ACCESS1.3, BCC-CSM1.1-m, BNU-ESM, CCSM4, CESM1-BGC, CESM1-CAM5, CESM1-FASTCHEM, CESM1-WACCM, CMCC-CESM, CMCC-CM, CMCC-CMS, CNRM-CM5, CSIRO-Mk3.6.0, CanESM2, FGOALS-g2, FGOALS-s2, FIO-ESM, GFDL-CM3, GFDL-ESM2G, GFDL-ESM2M, HadGEM2-CC, HadGEM2-ES, INMCM4, IPSL-CM5A-LR, IPSL-CM5A-MR, IPSL-CM5B-LR, MIROC-ESM, MIROC-ESM-CHEM, MIROC4h, MIROC5, MPI-ESM-LR, MPI-ESM-MR, MPI-ESM-P, MRI-CGCM3, NorESM1-M, and NorESM1-ME. For the regression composite of Fig. 4, we first calculated regressions onto the Arctic mean LSAT anomaly using each model output, and then averaged all models’ regression patterns of each variable.
Estimate of Trends.
We calculated linear trends using the least-squares method. Statistical significance for trends was estimated using Student’s t test and taking into account serial autocorrelation (62). Overall results remain similar even if nonparametric methods are used for the trend estimate and statistical significance test.
SI Materials and Methods
Observed Sea Level Pressure.
We reconstructed a monthly mean sea level pressure (SLP) anomaly dataset on a 5° latitude–longitude grid for 1900–2014 by merging terrestrial SLPs in the International Surface Pressure Databank, version 3.2.9 (ISPD) (59), and marine SLPs in the International Comprehensive Ocean–Atmosphere Data Set (ICOADS), Release 3.0 (60). The reconstruction was made through quality controls, construction of intermediate gridded anomaly data, and the empirical orthogonal function (EOF) analysis. First, the marine SLP data were quality controlled using the ICOADS enhanced monthly summary statistics that identifies potential outliers based on the climatological 4.5 SD limits. We applied almost the same quality control for the terrestrial SLP data of ISPD. Second, we constructed a 5-d mean SLP climatology on a 2° grid for 1950–2000 to obtain reliable monthly mean anomaly data. This 5-d mean climatology was smoothed with a spatiotemporal median filter for a cube of 5 × 5 × 5 grid points in time, latitude, and longitude, and then linearly interpolated at daily intervals. Anomalies of individual observations were obtained using bilinear interpolation of the smoothed daily climatology. We removed anomalies that exceed 2.5 SD of year-to-year variations in each calendar month. We then gridded the screened anomalies on a monthly 5° grid by a simple box average, and applied another spatiotemporal filter that removes outliers with an amplitude greater than 2.5 SD of a cube of 3 × 3 × 3 gridded anomalies in month, latitude, and longitude. These outliers were replaced with a median value in the cube. By using a spatial linear interpolation, we filled missing gaps where the number of consecutive “no data” grids does not exceed four in longitude and two in latitude. This interpolation was applied three times to obtain the intermediate gridded anomaly data. Finally, we reconstructed the monthly mean SLP anomaly field back to 1900, using spatial loadings of the EOF modes for 1950–2000 calculated from the intermediate gridded anomaly data. The time coefficients for 1900–2014 were determined by projecting intermediate anomalies onto the spatial loadings of EOF modes. Using combinations of the time coefficients and EOF spatial loadings that explain 70% of the total variance, we reconstructed the SLP anomaly field for the entire period. This EOF reconstruction was performed using only grid points whose monthly mean data coverage is higher than 70% of the total months for 1950–2000.
Observed Marine Surface Wind.
Following the same scheme as SLP, we reconstructed monthly mean marine surface wind anomalies from ICOADS3.0 (60). The only difference from the SLP reconstruction is a removal of nonnegligible time-varying biases in wind speed observed by ships (63, 64). From the late 19th to early 20th century, a major ship type shifted from sailing to steam ship, leading to decreasing trends of wind speed (65). By contrast, increased ship size and anemometer height caused spurious increasing trends after the mid-20th century (63, 64). These artifacts need to be removed before the climate trend analysis, but direct and consistent bias corrections for each measurement are impossible due to extremely limited ship metadata such as an anemometer height. Because of large variance of the time-varying biases, we applied the EOF decomposition for uncorrected monthly mean wind anomalies. The leading EOF mode features the time-varying bias, with positive loadings over the global ocean, and decreasing and increasing trends before and after the mid-20th century (Fig. S9 A and B). Assuming that the time-varying bias should be similar over the global ocean, the leading EOF can be regarded as the bias mode. We removed this wind anomaly component from individual scalar wind observations, and calculated zonal and meridional components from the corrected scalar wind and wind direction. Even after removing the bias mode, the reconstructed wind anomalies capture major modes of climate variability such as the El Niño/Southern Oscillation (ENSO), Pacific Decadal Oscillation (PDO), and North Atlantic Oscillation (NAO), with physically consistent sea surface temperature (SST) and SLP patterns (Fig. S9 C–E).
Acknowledgments
H.T. is supported by Japan Society for the Promotion of Science (JSPS) Grant-in-Aid for Research Activity Start-up 26887023 and Grant-in-Aid for Young Scientists (B) 16K17802, S.-P.X. by National Science Foundation Grant 1637450 and National Key Research and Development Program of China Grant 2016YFA0601804, and H.M. by JSPS Grant-in-Aid for Scientific Research (B) 26287115.
Footnotes
The authors declare no conflict of interest.
This article is a PNAS Direct Submission.
This article contains supporting information online at www.pnas.org/lookup/suppl/doi:10.1073/pnas.1615880114/-/DCSupplemental.
References
- 1.Serreze MC, Francis JA. The Arctic amplification debate. Clim Change. 2006;76:241–264. [Google Scholar]
- 2.Screen JA, Simmonds I. The central role of diminishing sea ice in recent Arctic temperature amplification. Nature. 2010;464:1334–1337. doi: 10.1038/nature09051. [DOI] [PubMed] [Google Scholar]
- 3.Taylor PC, et al. A decomposition of feedback contributions to polar warming amplification. J Clim. 2013;26:7023–7043. [Google Scholar]
- 4.Johannessen OM, et al. Arctic climate change: Observed and modelled temperature and sea-ice variability. Tellus A Dyn Meterol Oceanogr. 2004;56:328–341. [Google Scholar]
- 5.Bengtsson L, Semenov VA, Johannessen OM. The early twentieth-century warming in the Arctic—a possible mechanism. J Clim. 2004;17:4045–4057. [Google Scholar]
- 6.Grant AN, Bronnimann S, Ewen T, Griesser T, Stickler A. The early twentieth century warm period in the European Arctic. Meteorol Z. 2009;18:425–432. [Google Scholar]
- 7.Wood KR, Overland JE. Early 20th century Arctic warming in retrospect. Int J Climatol. 2010;30:1269–1279. [Google Scholar]
- 8.Yamanouchi T. Early 20th century warming in the Arctic: A review. Polar Sci. 2011;5:53–71. [Google Scholar]
- 9.Myhre G, et al. Anthropogenic and natural radiative forcing. In: Stocker TF, et al., editors. Climate Change 2013: The Physical Science Basis Contribution of Working Group I to the Fifth Assessment Report of the Intergovernmental Panel on Climate Change. Cambridge Univ Press; Cambridge, UK: 2013. pp. 659–740. [Google Scholar]
- 10.Vaughan DG, et al. Observations: Cryosphere. In: Stocker TF, et al., editors. Climate Change 2013: The Physical Science Basis Contribution of Working Group I to the Fifth Assessment Report of the Intergovernmental Panel on Climate Change. Cambridge Univ Press; Cambridge, UK: 2013. pp. 317–382. [Google Scholar]
- 11.Overpeck J, et al. Arctic environmental change of the last four centuries. Science. 1997;278:1251–1256. [Google Scholar]
- 12.Fyfe JC, et al. One hundred years of Arctic surface temperature variation due to anthropogenic influence. Sci Rep. 2013;3:2645. doi: 10.1038/srep02645. [DOI] [PMC free article] [PubMed] [Google Scholar]
- 13.Garrett TJ, Zhao C. Increased Arctic cloud longwave emissivity associated with pollution from mid-latitudes. Nature. 2006;440:787–789. doi: 10.1038/nature04636. [DOI] [PubMed] [Google Scholar]
- 14.Semenov VA, Latif M. The early twentieth century warming and winter Arctic sea ice. Cryosphere. 2012;6:1231–1237. [Google Scholar]
- 15.Beitsch A, Jungclaus JH, Zanchettin D. Patterns of decadal-scale Arctic warming events in simulated climate. Clim Dyn. 2014;43:1773–1789. [Google Scholar]
- 16.Wegmann M, Brönnimann S, Compo GP. Tropospheric circulation during the early twentieth century Arctic warming. Clim Dyn. 2017;48:2405–2418. [Google Scholar]
- 17.Jones GS, Stott PA, Christidis N. Attribution of observed historical near-surface temperature variations to anthropogenic and natural causes using CMIP5 simulations. J Geophys Res. 2013;118:4001–4024. [Google Scholar]
- 18.Tokinaga H, Xie S-P, Deser C, Kosaka Y, Okumura YM. Slowdown of the Walker circulation driven by tropical Indo-Pacific warming. Nature. 2012;491:439–443. doi: 10.1038/nature11576. [DOI] [PubMed] [Google Scholar]
- 19.Mantua NJ, Hare SR, Zhang Y, Wallace JM, Francis RC. A Pacific interdecadal climate oscillation with impacts on salmon production. Bull Am Meteorol Soc. 1997;78:1069–1079. [Google Scholar]
- 20.Schlesinger ME, Ramankutty N. An oscillation in the global climate system of period 65–70 years. Nature. 1994;367:723–726. [Google Scholar]
- 21.Power S, Casey T, Folland C, Colman A, Mehta V. Inter-decadal modulation of the impact of ENSO on Australia. Clim Dyn. 1999;15:319–324. [Google Scholar]
- 22.Enfield DB, Mestas-Nunez AM, Trimble PJ. The Atlantic multidecadal oscillation and its relation to rainfall and river flows in the continental US. Geophys Res Lett. 2001;28:2077–2080. [Google Scholar]
- 23.D’Arrigo R, Villalba R, Wiles G. Tree-ring estimates of Pacific decadal climate variability. Clim Dyn. 2001;18:219–224. [Google Scholar]
- 24.Gray ST, Graumlich LJ, Betancourt JL, Pederson GT. A tree-ring based reconstruction of the Atlantic Multidecadal Oscillation since 1567 AD. Geophys Res Lett. 2004;31:L12205. [Google Scholar]
- 25.Shen CM, Wang WC, Gong W, Hao ZX. A Pacific Decadal Oscillation record since 1470 AD reconstructed from proxy data of summer rainfall over eastern China. Geophys Res Lett. 2006;33:L03702. [Google Scholar]
- 26.Mann ME, et al. Global signatures and dynamical origins of the Little Ice Age and Medieval Climate Anomaly. Science. 2009;326:1256–1260. doi: 10.1126/science.1177303. [DOI] [PubMed] [Google Scholar]
- 27.Svendsen L, Hetzinger S, Keenlyside N, Gao YQ. Marine-based multiproxy reconstruction of Atlantic multidecadal variability. Geophys Res Lett. 2014;41:1295–1300. [Google Scholar]
- 28.Poli P, et al. ERA-20C: An atmospheric reanalysis of the twentieth century. J Clim. 2016;29:4083–4097. [Google Scholar]
- 29.Rayner NA, et al. Global analyses of sea surface temperature, sea ice, and night marine air temperature since the late nineteenth century. J Geophys Res. 2003;108:4407. [Google Scholar]
- 30.Kennedy J, Rayner NA, Saunby M, Millington SC. Geophys Res Abstr. Vol. 15. European Geosciences Union; Munich: 2013. Bringing together measurements of sea surface temperature made in situ with retrievals from satellite instruments to create a globally complete analysis for 1850 onwards, HadISST2; pp. EGU2013–9723. [Google Scholar]
- 31.Anderson JL, et al. The new GFDL global atmosphere and land model AM2-LM2: Evaluation with prescribed SST simulations. J Clim. 2004;17:4641–4673. [Google Scholar]
- 32.Titchner HA, Rayner NA. The Met Office Hadley Centre sea ice and sea surface temperature data set, version 2: 1. Sea ice concentrations. J Geophys Res. 2014;119:2864–2889. [Google Scholar]
- 33.Vose RS, et al. NOAA’s merged land-ocean surface temperature analysis. Bull Am Meteorol Soc. 2012;93:1677–1685. [Google Scholar]
- 34.Hansen J, Ruedy R, Sato M, Lo K. Global surface temperature change. Rev Geophys. 2010;48:RG4004. [Google Scholar]
- 35.Jones PD, et al. Hemispheric and large-scale land-surface air temperature variations: An extensive revision and an update to 2010. J Geophys Res. 2012;117:D05127. [Google Scholar]
- 36.Harris I, Jones PD, Osborn TJ, Lister DH. Updated high-resolution grids of monthly climatic observations—the CRU TS3.10 Dataset. Int J Climatol. 2014;34:623–642. [Google Scholar]
- 37.Compo GP, et al. The twentieth century reanalysis project. Q J R Meteorol Soc. 2011;137:1–28. [Google Scholar]
- 38.Lawrimore JH, et al. An overview of the Global Historical Climatology Network monthly mean temperature data set, version 3. J Geophys Res. 2011;116:D19121. [Google Scholar]
- 39.Polyakov IV, et al. Variability and trends of air temperature and pressure in the maritime Arctic, 1875–2000. J Clim. 2003;16:2067–2077. [Google Scholar]
- 40.Zhang Y, Wallace JM, Battisti DS. ENSO-like interdecadal variability: 1900–93. J Clim. 1997;10:1004–1020. [Google Scholar]
- 41.Deser C, Phillips AS, Hurrell JW. Pacific interdecadal climate variability: Linkages between the tropics and the North Pacific during boreal winter since 1900. J Clim. 2004;17:3109–3124. [Google Scholar]
- 42.Deser C, Phillips AS. Simulation of the 1976/77 climate transition over the North Pacific: Sensitivity to tropical forcing. J Clim. 2006;19:6170–6180. [Google Scholar]
- 43.Deser C, Phillips AS. Atmospheric circulation trends, 1950–2000: The relative roles of sea surface temperature forcing and direct atmospheric radiative forcing. J Clim. 2009;22:396–413. [Google Scholar]
- 44.Lee S, Gong TT, Johnson N, Feldstein SB, Pollard D. On the possible link between tropical convection and the Northern Hemisphere arctic surface air temperature change between 1958 and 2001. J Clim. 2011;24:4350–4367. [Google Scholar]
- 45.Feldstein SB, Lee S. The influence of tropical convection on Arctic climate variability. US CLIVAR Variations. 2014;12:6–9. [Google Scholar]
- 46.Thompson DWJ, Wallace JM. Annular modes in the extratropical circulation. Part I: Month-to-month variability. J Clim. 2000;13:1000–1016. [Google Scholar]
- 47.Liu W, Xie S-P, Liu Z, Zhu J. Overlooked possibility of a collapsed Atlantic Meridional Overturning Circulation in warming climate. Sci Adv. 2017;3:e1601666. doi: 10.1126/sciadv.1601666. [DOI] [PMC free article] [PubMed] [Google Scholar]
- 48.Zhang R, et al. Comment on “The Atlantic Multidecadal Oscillation without a role for ocean circulation.”. Science. 2016;352:1527. doi: 10.1126/science.aaf1660. [DOI] [PubMed] [Google Scholar]
- 49.Stott PA, Jones GS, Mitchell JFB. Do models underestimate the solar contribution to recent climate change? J Clim. 2003;16:4079–4093. [Google Scholar]
- 50.Hegerl GC, Crowley TJ, Baum SK, Kim KY, Hyde WT. Detection of volcanic, solar and greenhouse gas signals in paleo-reconstructions of Northern Hemispheric temperature. Geophys Res Lett. 2003;30:1242. [Google Scholar]
- 51.Nozawa T, Nagashima T, Shiogama H, Crooks SA. Detecting natural influence on surface air temperature change in the early twentieth century. Geophys Res Lett. 2005;32:L20719. [Google Scholar]
- 52.Shiogama H, Nagashima T, Yokohata T, Crooks SA, Nozawa T. Influence of volcanic activity and changes in solar irradiance on surface air temperatures in the early twentieth century. Geophys Res Lett. 2006;33:L09702. [Google Scholar]
- 53.Hegerl GC, et al. Detection of human influence on a new, validated 1500-year temperature reconstruction. J Clim. 2007;20:650–666. [Google Scholar]
- 54.Bindoff NL, et al. Detection and attribution of climate change: From global to regional. In: Stocker TF, et al., editors. Climate Change 2013: The Physical Science Basis Contribution of Working Group I to the Fifth Assessment Report of the Intergovernmental Panel on Climate Change. Cambridge Univ Press; Cambridge, UK: 2013. pp. 867–952. [Google Scholar]
- 55.Shindell D, Faluvegi G. Climate response to regional radiative forcing during the twentieth century. Nat Geosci. 2009;2:294–300. [Google Scholar]
- 56.McGregor S, et al. Recent Walker circulation strengthening and Pacific cooling amplified by Atlantic warming. Nat Clim Chang. 2014;4:888–892. [Google Scholar]
- 57.Li XC, Xie S-P, Gille ST, Yoo C. Atlantic-induced pan-tropical climate change over the past three decades. Nat Clim Chang. 2016;6:275–279. [Google Scholar]
- 58.Hulme M, Osborn TJ, Johns TC. Precipitation sensitivity to global warming: Comparison of observations with HadCM2 simulations. Geophys Res Lett. 1998;25:3379–3382. [Google Scholar]
- 59.Cram TA, et al. The International Surface Pressure Databank version 2. Geosci Data J. 2015;2:31–46. [Google Scholar]
- 60.Freeman E, et al. ICOADS Release 3.0: A major update to the historical marine climate record. Int J Climatol. 2017;37:2211–2232. [Google Scholar]
- 61.Allan R, Ansell T. A new globally complete monthly historical gridded mean sea level pressure dataset (HadSLP2): 1850–2004. J Clim. 2006;19:5816–5842. [Google Scholar]
- 62.Zwiers FW, von Storch H. Taking serial-correlation into account in tests of the mean. J Clim. 1995;8:336–351. [Google Scholar]
- 63.Thomas BR, Kent EC, Swail VR, Berry DI. Trends in ship wind speeds adjusted for observation method and height. Int J Climatol. 2008;28:747–763. [Google Scholar]
- 64.Tokinaga H, Xie S-P. Wave- and anemometer-based sea surface wind (WASWind) for climate change analysis. J Clim. 2011;24:267–285. [Google Scholar]
- 65.Ramage CR. Secular changes in reported surface wind speeds over the ocean. J Clim Appl Met. 1987;26:525–528. [Google Scholar]


