Significance
Our modeling study shows the crucial role of vegetation cover over the Sahara and reduced dust emission in altering tropical cyclone activity during the mid-Holocene (6,000 yBP). Our results also demonstrate how these regional changes in land cover and dust emission are able to affect areas far afield through changes of large-scale atmospheric circulation. Our study strongly suggests that an appropriate representation of land cover and dust emission is of paramount importance to be able to capture past—and potentially future—climate changes.
Keywords: hurricanes, mid-Holocene, dust emissions, vegetation changes, land cover changes
Abstract
Tropical cyclones (TCs) can have devastating socioeconomic impacts. Understanding the nature and causes of their variability is of paramount importance for society. However, historical records of TCs are too short to fully characterize such changes and paleo-sediment archives of Holocene TC activity are temporally and geographically sparse. Thus, it is of interest to apply physical modeling to understanding TC variability under different climate conditions. Here we investigate global TC activity during a warm climate state (mid-Holocene, 6,000 yBP) characterized by increased boreal summer insolation, a vegetated Sahara, and reduced dust emissions. We analyze a set of sensitivity experiments in which not only solar insolation changes are varied but also vegetation and dust concentrations. Our results show that the greening of the Sahara and reduced dust loadings lead to more favorable conditions for tropical cyclone development compared with the orbital forcing alone. In particular, the strengthening of the West African Monsoon induced by the Sahara greening triggers a change in atmospheric circulation that affects the entire tropics. Furthermore, whereas previous studies suggest lower TC activity despite stronger summer insolation and warmer sea surface temperature in the Northern Hemisphere, accounting for the Sahara greening and reduced dust concentrations leads instead to an increase of TC activity in both hemispheres, particularly over the Caribbean basin and East Coast of North America. Our study highlights the importance of regional changes in land cover and dust concentrations in affecting the potential intensity and genesis of past TCs and suggests that both factors may have appreciable influence on TC activity in a future warmer climate.
Tropical cyclones (TCs) can have serious environmental impacts and consequently devastating socioeconomics effects (1–3). During the last 40 y the intensity of TCs likely increased (4–6), and climate projections consistently indicate a shift toward more destructive storms due to global warming (7, 8) and changes in dust emissions (9, 10). Although there is no consensus among climate models, most simulations for the coming decades also suggest changes in precipitation in the subtropical regions—in particular an increase over the Sahel in northern Africa (11–13)—that can lead to a reduction of dust emission (10). Large changes in dust emissions (14, 15) and precipitation over the Sahel (16–18) have already occurred during the Holocene (i.e., the last 12,000 y) as shown by previous studies, and modifications in those parameters during warm climate periods of the past may offer useful insights into future climatic change (19). In particular, it may be feasible to better constrain future changes in TC activity by improving understanding of the relationships between the joint behavior of Sahel/Sahara vegetation cover, dust emissions from these regions, and tropical storminess during the Holocene Thermal Maximum (11,000–5,000 yBP).
Coastal sediments can provide proxy information on past TC activity, and such geological archives have opened new avenues for studying TC activity before the instrumental period. Such archives have so far provided information as far back as the mid-Holocene (MH; 7,000–4,000 yBP). Paleotempest records from the western North Atlantic have shown that the frequency of intense hurricanes may have fluctuated considerably during the last 7,000 y under varying climatic conditions (20–23). However, most of the proxy records span only a few millennia and are limited to specific locations where individual TCs happened to make landfall. Only a few are long enough to capture the climatic impacts associated with changes in Earth’s orbital parameters during the early- to mid-Holocene (12,000–4,000 yBP). This period was characterized by summer insolation that increased in the Northern Hemisphere (NH) and decreased in the Southern Hemisphere (SH), by more intense West African monsoons (WAM) and Indian Summer (ISM) monsoons (15, 17, 18, 24–26), and by changes in the amplitude of El Niño-Southern Oscillation (ENSO) variability relative to today (27–29).
Modeling studies investigating TC changes during the MH are limited (30, 31) and are based on the simulations performed under different phases of the Paleoclimate Modeling Intercomparison Project (PMIP), which assumes preindustrial (1850 AD) vegetation cover and dust concentrations (32) (Table 1). The primary goal of PMIP was to test model responses to changes in orbital forcing. However, proxy evidence has shown that the currently hyperarid Sahara was characterized by a mesic landscape during the MH (33–35) and that Sahara dust emissions were drastically reduced as a result (15). Previous modeling studies (30, 31) found that although the TC genesis potential during the MH decreased in the NH under stronger summer insolation, it increased in the SH under weaker summer insolation relative to the preindustrial (PI) climate. However, PMIP model simulations for the MH do not adequately reproduce the intensification and geographical expansion of the WAM (35) and ISM (36), as inferred from proxy archives, or the shift in the Intertropical Convergence Zone (ITCZ) position, which can have a pronounced influence on TC development (37). Recent modeling efforts have shown that accounting for extensive greening of the Sahara and the associated reduction of dust emissions allows for better simulation of the WAM strengthening (18, 38) and its teleconnections (39, 40). In particular, Muschitiello et al. (39) and Davies et al. (40) demonstrated the sensitivity of Arctic climate to Saharan vegetation during the termination of the African Humid Period. These studies highlight the important role played by vegetation cover and dust emission in shaping climate on both regional and global scales.
Table 1.
Boundary conditions for each modeling experiment
| Simulation | Orbital forcing | GHGs | Saharan vegetation | Saharan dust |
| PI | 1950 AD | 1850 AD | Desert | PI |
| MHPMIP | 6,000 yBP | 6,000 yBP | As PI | As PI |
| MHGS+RD | 6,000 yBP | 6,000 yBP | Shrub | Reduced |
| MHGS | 6,000 yBP | 6,000 yBP | Shrub | As PI |
| MHRD | 6,000 yBP | 6,000 yBP | As PI | Reduced |
The aim of this work is to investigate the effects of changes in Saharan vegetation and the associated reduction in dust emission on TC activity in addition to the insolation forcing (standard MH PMIP simulation) compared with the PI climate. The results of this study also provide insight into the possible influence of dust and vegetation changes on TC activity as the Earth warms in response to increasing CO2 concentrations.
As a reference experiment, we take the PI climate as simulated by an Earth System Model [EC-Earth version 3.1 (41)] with an atmospheric horizontal resolution of 1.125° × 1.125° and 62 vertical levels. We then analyze four sets of sensitivity experiments performed by Pausata et al. (38) (Methods). These four experiments are (i) the standard MHPMIP in which the MH insolation and greenhouse gas boundary conditions have been used following the PMIP protocol; (ii) the MHGS+RD where both the Sahara greening (GS) and the dust reduction (RD) are considered; (iii) the MHGS in which Saharan land cover is set to shrub and dust is kept at PI values as in MHPMIP; and (iv) the MHRD where the dust concentrations are reduced by as much as 80% [Table 1; also figures 1 and S1 in Pausata et al. (38)], whereas the Sahara land cover is set to PI as in MHPMIP (Table 1).
We use a dynamical downscaling technique (5) for simulating large numbers of TCs in each experiment (Methods). We also investigate the most important environmental factors (thermodynamic and kinematic) that affect TC genesis and track density (Methods) to better understand the causes of the changes in tropical storminess. For each experiment, we analyze a 30-y portion of the integration following an initial spin-up phase (Methods).
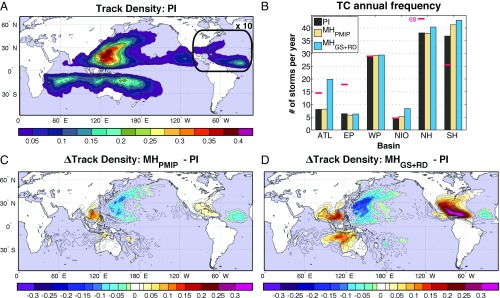
The global TC climatology in the PI simulation (Fig. 1A) is in excellent agreement with observations in both the Western Pacific and Northern Indian Oceans (Fig. S1). However, TCs are underestimated in the Eastern Pacific and particularly in the North Atlantic. Whereas the TCs are underestimated in the NH, they are overestimated in the SH. This could be in part related to the NH cold bias in our model (41). It is common for global models to underrepresent the activity of North Atlantic TCs, but the model used here has a larger bias than other climate models (5). However, the observed seasonal and interannual variabilities of Atlantic TCs are well captured by our model and by climate models in general (5). Furthermore, our analysis focuses on relative changes in TCs and environmental parameters favorable to TC genesis. An underlying assumption in our analysis is that the cold bias in the North Atlantic will not have a large effect on the predicted changes in tropical cyclone activity. Further investigation of the causes of this bias is needed.
Fig. 1.
(A) Climatological track density for the preindustrial simulation. (B) Tropical cyclone annual frequency for the Atlantic (ATL), Eastern (EP) and Western (WP) Pacific, Northern Indian Ocean (NIO), and Northern (NH) and Southern (SH) Hemispheres. The red horizontal bars show the observed climatological number of storms for the period 1980–2015. (C and D) Changes in track density for the MHPMIP (C) (orbital changes only) and the MHGS+RD (D) (orbital changes + green Sahara + reduced dust) experiments relative to the preindustrial. Only values that are significantly different at the 5% level using a local (grid-point) t test are shaded. The contour intervals (dashed, negative anomalies; solid, positive anomalies) follow the color bar scale. The box in A indicates the area where the track density and the number of storms per year have been scaled by a factor of 10. In this particular region, scaling is applied to the track density of all experiments to visually highlight its pattern and its changes over the North Atlantic due to the large model underestimation.
Fig. S1.
(A and B) Climatological track density from the 1980–2013 best-track data (A) and for EC-Earth model simulation for the period 1980–2005 (B). In B, results are scaled by a factor of 10 over the North Atlantic (Fig. 1A).
Our model experiments show that the orbital forcing changes alone lead to an increase of TC landfalls over South Asia and a widespread decrease of TCs offshore in the Western Pacific (MHPMIP, Fig. 1C). A similar pattern of an increase in TC density that occurs onshore toward the Caribbean Sea and a decrease offshore is simulated in the tropical North Atlantic (Fig. 1C). Over the entire NH the number of TCs is unchanged or slightly reduced in the MHPMIP simulation compared with the PI (Fig. 1B). In the SH the number of TCs increases, in overall agreement with previous studies (30, 31) that analyzed environmental factors favorable to TC development using PMIP simulations. Accounting for both the GS and RD (MHGS+RD) strengthens the anomaly pattern induced by the insolation change alone (Fig. 1D). In particular, the TC density increases markedly in the North Atlantic, especially in the Caribbean Basin and southeastern United States. In terms of hemispheric average behavior the changes in TC track density in the MHGS+RD simulation (relative to the PI) are dominated by the large intensification of TC activity in the Atlantic, South China Sea, and Gulf of Bengal (Fig. 1D). These increases more than compensate for the TC decrease simulated offshore in the western Pacific and central tropical Atlantic Ocean. The inclusion of changes in land cover and dust also leads to an additional enhancement of TC activity in the SH, especially off the coast of northwestern Australia (Fig. 1 B and D).
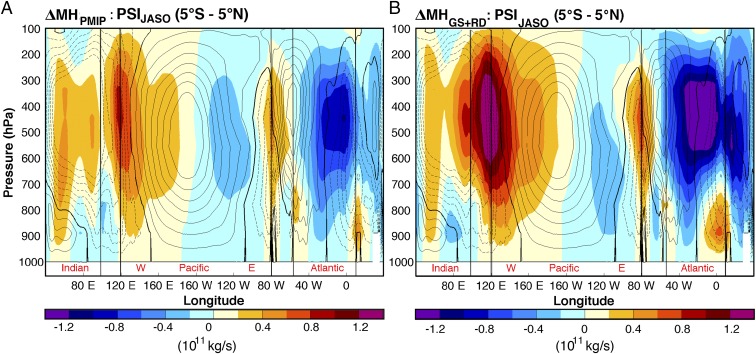
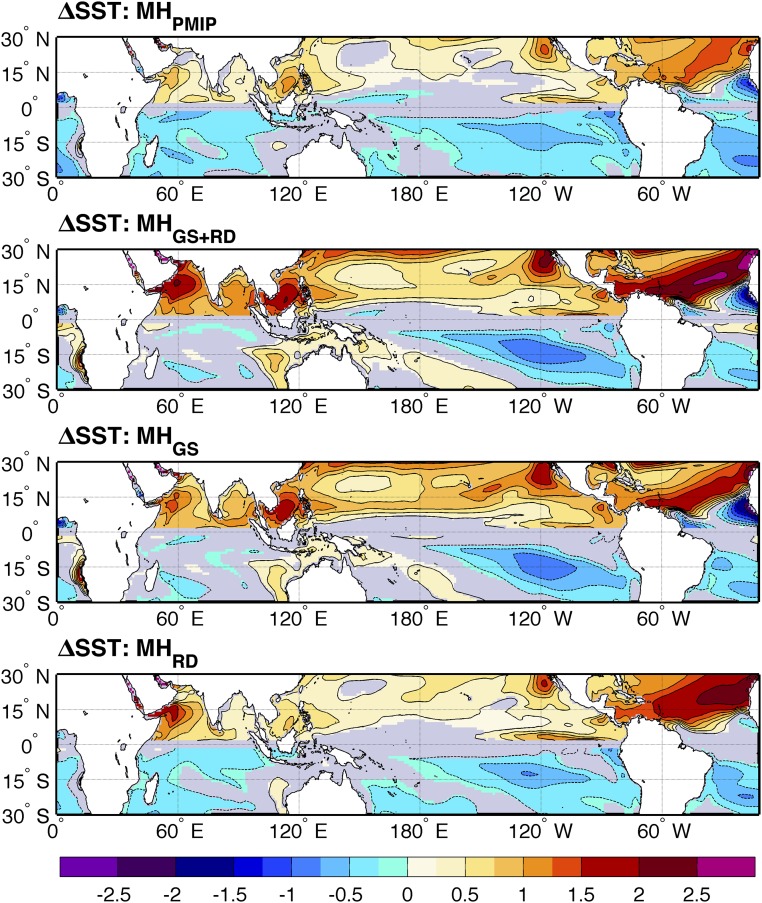
An analysis of the separate impacts of RD (MHRD) and GS (MHGS) reveals that compared with the orbital forcing alone (MHPMIP, Fig. 1C) the impact of dust is limited to the Atlantic region (compare Figs. 1C and 2B), whereas the effects of the GS are worldwide (compare Figs. 1C and 2A). The global effect seen in the MHGS simulation (relative to MHPMIP) is most likely related to the large changes in the WAM (38) and the Walker circulation (Fig. S2) induced by the GS. Alternately, the changes in the WAM and Walker circulation in the MHRD simulation are similar to those induced by the orbital forcing alone (38). Hence, the effect of RD alone under desert Sahara conditions (MHRD) affects only the Caribbean and eastern coastal regions of the United States. This is where dust reduction has a direct radiative effect, resulting in a pronounced warming of sea surface temperatures (SSTs) (Fig. S3).
Fig. 2.
(A and B) Changes in track density for the MHGS (A) (orbital changes + green Sahara) and the MHRD (B) (orbital changes + reduced dust) experiments relative to the MHPMIP. Only values that are significantly different at the 5% level using a local (grid-point) t test are shaded. The contour intervals (dashed, negative anomalies; solid, positive anomalies) follow the color bar scale. Results are scaled by a factor of 10 over the North Atlantic (Fig. 1A).
Fig. S2.
(A and B) PI climatological zonal stream function of the Walker circulation (contours: 0.2 × 10¹¹-kg/s interval from −1.4 to 1.4 × 10¹¹ kg/s; 0 line is bold contour line) and associated changes (shadings) in the MHPMIP (A) and MHGS+RD (B) experiments relative to the PI.
Fig. S3.
Changes in SST (°C) for each sensitivity experiment relative to the PI reference simulation for the TC season in the NH (JASO) and SH (JFMA). The contour intervals (dashed, negative anomalies; solid, positive anomalies) follow the color bar scale. Only values that are significantly different at the 5% level using a local (grid-point) k-s test are shaded. The 0-anomaly line is omitted for clarity.
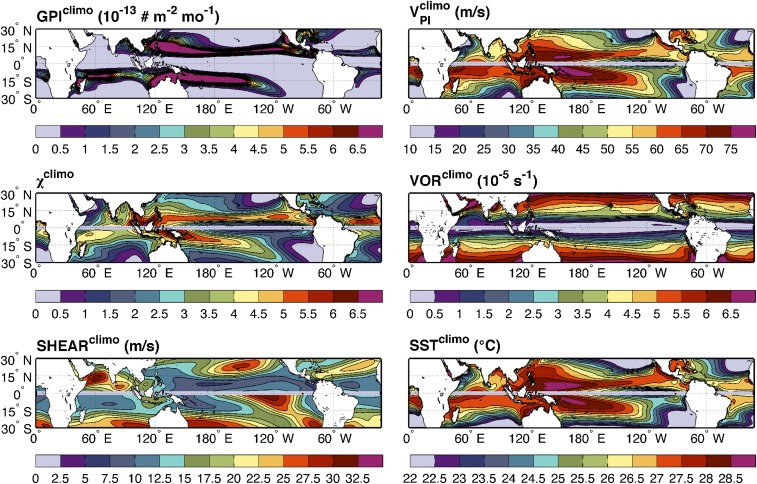
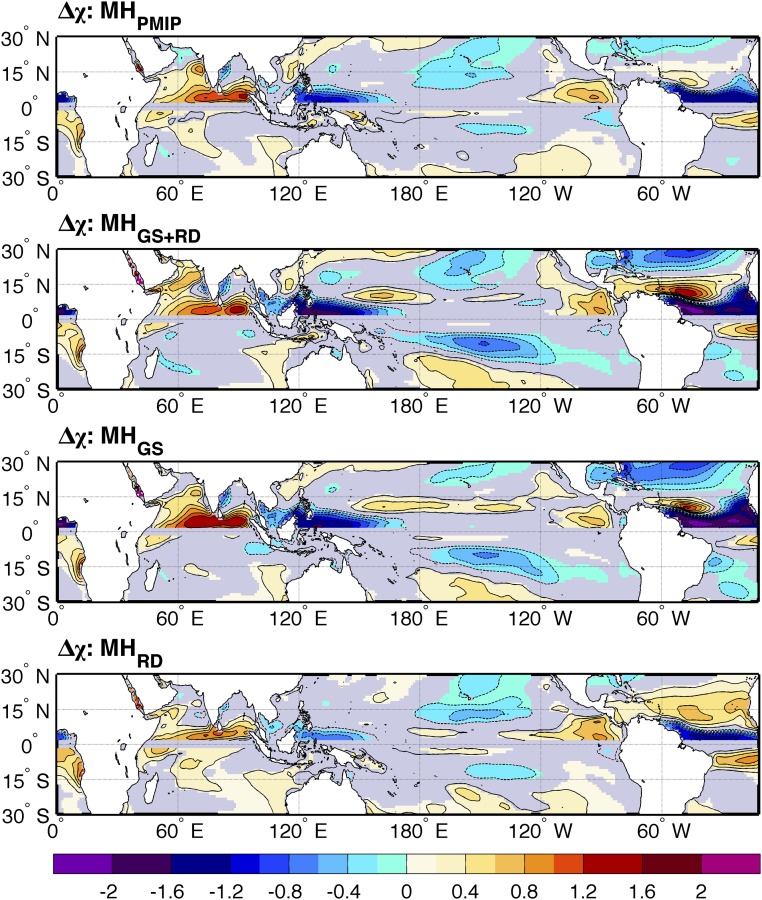
To better understand the causes behind the simulated changes in TC activity, we examine a genesis potential index (GPI) (Methods) and the environmental parameters that describe how favorable the climate state is for tropical cyclogenesis (Fig. S4). The GPI is a synthesis of kinematic (wind shear and absolute vorticity) and thermodynamic factors (potential intensity and moist entropy deficit) that affect tropical cyclogenesis. A description of the role of each environmental factor on the genesis of TCs is provided in Methods.
Fig. S4.
Climatological GPI, potential intensity (VPI), reciprocal of moist entropy (χ), vorticity (VOR), wind shear (SHEAR), and SST for the TC season in the NH (JASO) and SH (JFMA) in the PI simulation.
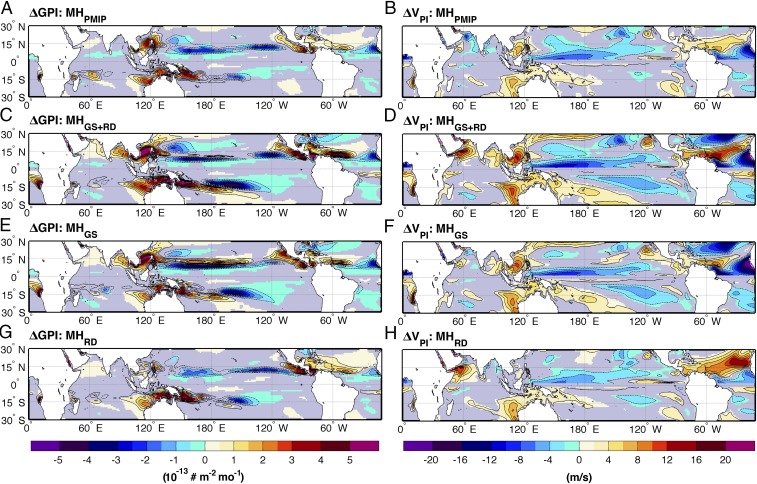
The GPI changes in the MHPMIP simulation indicate more favorable conditions for tropical cyclogenesis on the western and eastern coasts of Central America, in the South China Sea, and over most of the tropical regions in the SH (Fig. 3A). Less favorable conditions are simulated over most of the tropical Pacific and the eastern Atlantic Ocean. The changes in GPI relative to the PI simulation are in agreement with the changes in simulated TCs using the downscaling technique, suggesting that the GPI is a reliable measure of TC activity under both modern and MH climate conditions. The GPI anomalies in the MHPMIP simulation are also very similar to the ensemble mean changes in GPI estimated from 10 PMIP models (compare figures 3 and 9a in ref. 30).
Fig. 3.
Storm-season [June to October (JASO NH); January to April (JFMA SH)] changes in genesis potential index (GPI; A, C, E, and G) and potential intensity (VPI; B, D, F, and H) for each sensitivity experiment relative to the PI reference simulation. The contour intervals (dashed, negative anomalies; solid, positive anomalies) follow the color bar scale. Only values that are significantly different at the 5% level using a local (grid-point) k-s test are shaded. The zero-anomaly line is omitted for clarity.
Accounting for the combined effects of GS and RD (MHGS+RD) yields an anomaly pattern that is very similar to the one simulated in the MHPMIP, but substantially amplified (compare Fig. 3A with 3C). The GPI analysis confirms the global impacts of GS (Fig. 3E), whereas the effects of the RD are more limited to the tropical Atlantic (Fig. 3G).
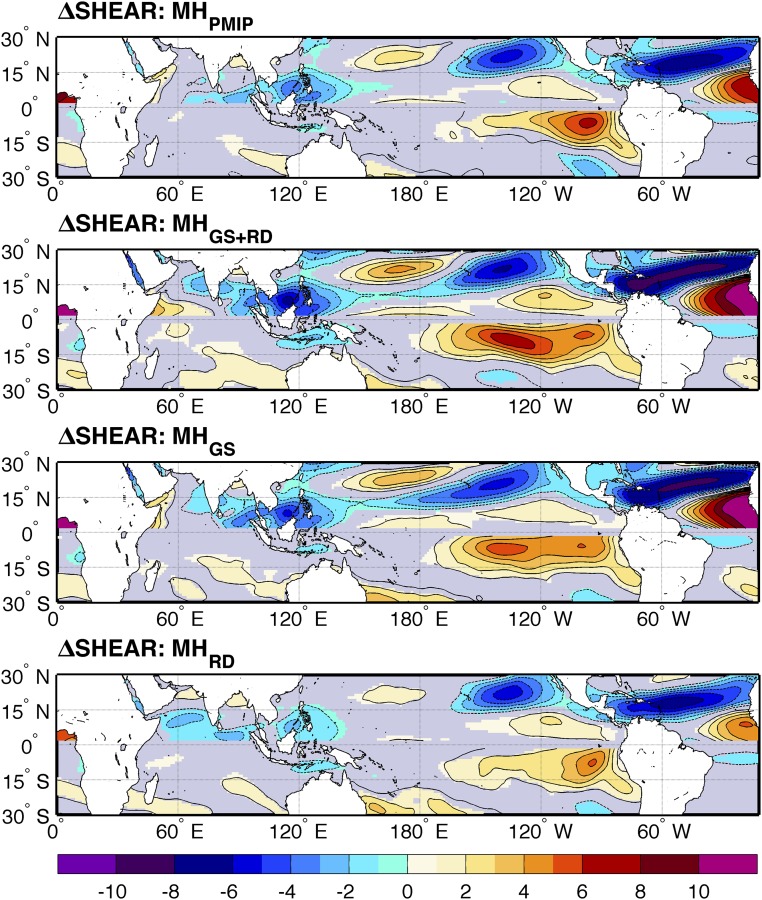
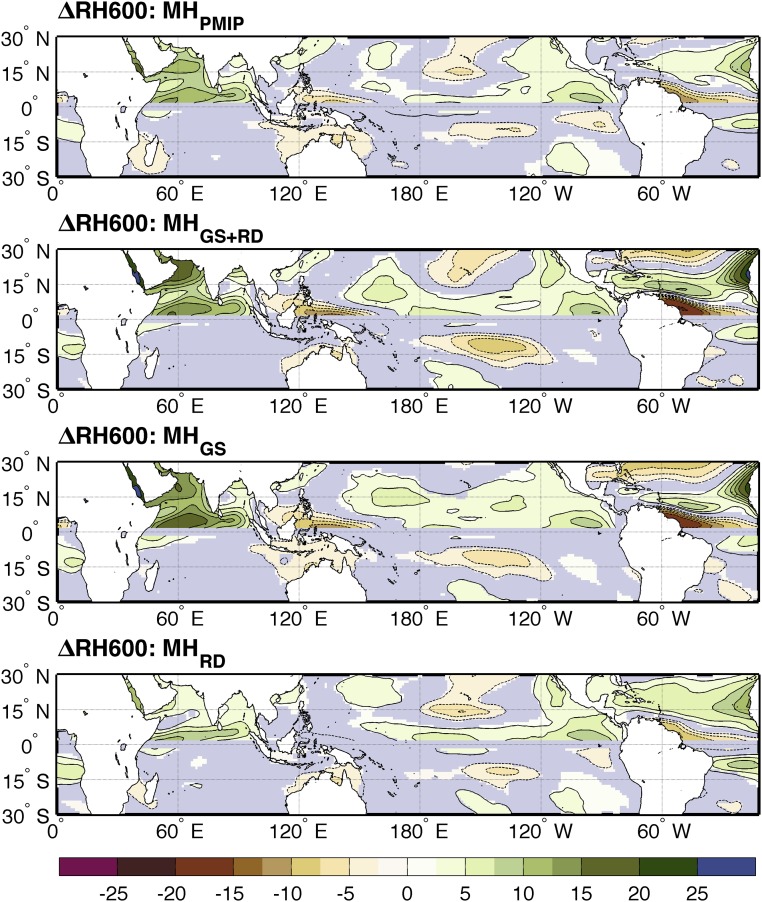
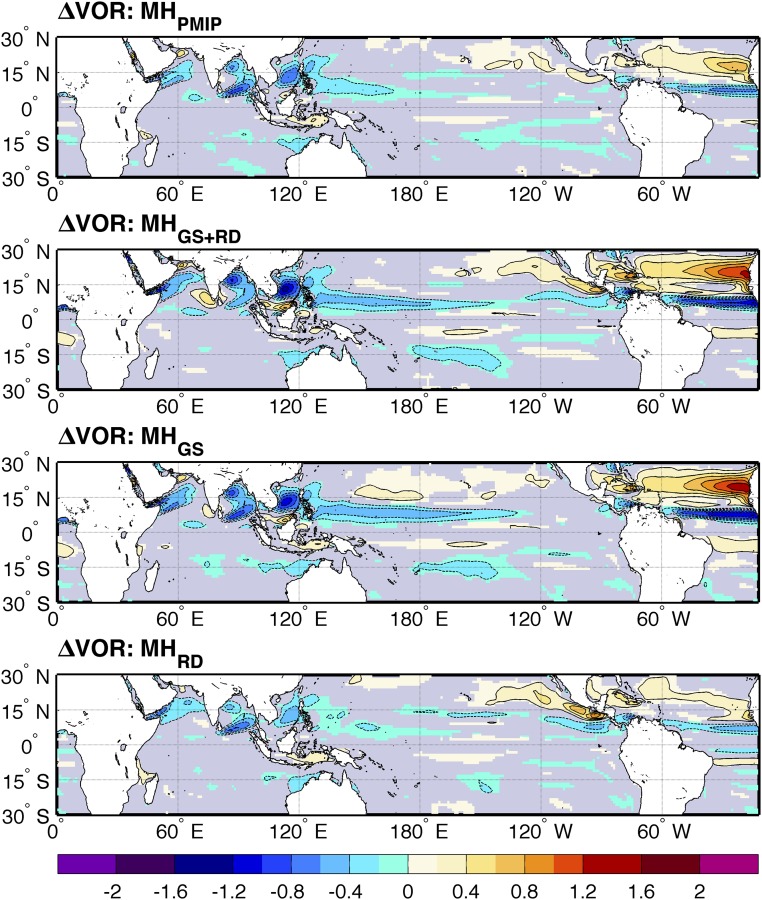
An in-depth analysis of each component characterizing the GPI reveals that, in general, the most important environmental factors driving the changes in TC activity in the MH simulations are the wind shear and the potential intensity (Fig. 3 and Fig. S5). The striking increase in TC density over the Caribbean Sea in the MHGS+RD simulation is most likely due to the combination of decreased wind shear and enhanced midlevel entropy content (i.e., humidity level closer to saturation) (Fig. 1D and Figs. S5–S7), in addition to the large potential intensity increase. The absolute vorticity also increases over the entire tropical Atlantic poleward of 10°N (Fig. S8). The combined effect of these factors, largely induced by the strengthening of the WAM, boosts the TC activity over the eastern tropical Atlantic in the MHGS+RD experiment relative to the PI simulation.
Fig. S5.
Changes in wind shear (m/s) for each sensitivity experiment relative to the PI reference simulation for the TC season in the NH (JASO) and SH (JFMA). The contour intervals (dashed, negative anomalies; solid, positive anomalies) follow the color bar scale. Only values that are significantly different at the 5% level using a local (grid-point) k-s test are shaded. The 0-anomaly line is omitted for clarity.
Fig. S7.
Changes in relative humidity (%) in the midtroposphere (600 hPa) for each sensitivity experiment relative to the PI reference simulation for the TC season in the NH (JASO) and SH (JFMA). Only values that are significantly different at the 5% level using a local (grid-point) k-s test are shaded. The 0-anomaly line is omitted for clarity.
Fig. S8.
Changes in absolute vorticity (10−5 s−1) for each sensitivity experiment relative to the PI reference simulation for the TC season in the NH (JASO) and SH (JFMA). The contour intervals (dashed, negative anomalies; solid, positive anomalies) follow the color bar scale. Only values that are significantly different at the 5% level using a local (grid-point) k-s test are shaded. The 0-anomaly line is omitted for clarity.
Fig. S6.
Changes in the reciprocal of the moist entropy parameter for each sensitivity experiment relative to the PI reference simulation for the TC season in the NH (JASO) and SH (JFMA). The contour intervals (dashed, negative anomalies; solid, positive anomalies) follow the color bar scale. Only values that are significantly different at the 5% level using a local (grid-point) k-s test are shaded. The 0-anomaly line is omitted for clarity. Increased values mean more favorable conditions for TC developments.
In the SH, the changes in potential intensity, and to lesser extent the entropy changes, play the most important roles (Fig. 3 and Fig. S8). We infer from this that the variations in available thermodynamic energy imparted from changes in both the SST and the atmospheric environment are crucial for increasing SH TC activity in the MH simulation, despite the large SST cooling relative to the PI. This result further demonstrates that SST by itself is an inadequate indicator of storm strength, as shown in previous work (42).
In summary, our results show that during the MH—a period characterized by increased NH summer insolation and extensive greening of the Sahara desert—TC activity may have been amplified globally, and in particular over the western Atlantic, compared with TC activity in the PI climate state. These results appear to be at variance with findings from previous studies of MH TCs obtained using PMIP simulations. The latter show slightly more favorable TC conditions in the SH but less favorable conditions in the NH. The apparent dissimilarity arises from the fact that only orbital changes were considered in previous studies of the MH climate (30, 31), whereas here we show that including the GS and the consequent reduction in dust emission are critical influences on TC activity.
Previous studies (30, 31) that investigated changes in TC genesis potential for past climate did not have access to the 6-h model output required for downscaling, so that it was not feasible to analyze simulated storms directly. Those previous studies were based exclusively on analysis of the indexes and environmental parameters that are favorable to TC development. The underlying assumption in such work is that the GPI, which reliably captures the net effect of the factors that influence TC genesis under modern climate conditions, also performs well under different climate states (30, 31). Our results show that this assumption may be reasonable: The GPI anomalies in the MH experiments closely match the simulated changes in TC density obtained using a downscaling model. This is in agreement with results from Camargo et al. (43), who showed that genesis indexes that take into account the saturation deficit and potential intensity (as in the case of the GPI) are best suited to capture changes in global TC frequency under different climate states.
Our simulations of the effects on tropical cyclones of enhanced vegetation cover and reduced dust emissions in the Sahara are difficult to test with existing paleotempest records. At present, such records do not yet provide a geographically and temporally complete view of Holocene storm activity for model evaluation. However, a reconstruction of TC activity from Vieques, Puerto Rico indicates increased intense TC activity during times when other proxy evidence suggests an intensified WAM over the last 5,500 y (20). Furthermore, one of the intervals with the highest TC activity in the Vieques reconstruction occurred between 2,500 y and 1,000 y BP, when the flux of Saharan dust was low compared with that in the subsequent millennium (44). Other evidence supportive of the results presented here includes a recent study (45) highlighting the link between reduced dust loading during the early and mid-Holocene and the northward expansion of the ITCZ, which in turn can intensify TC activity in the western North Atlantic (37). The message from these paleoclimatic studies is that the Saharan dust layer appears to suppress TC activity, consistent with the inverse relationship between Saharan dust emission and Atlantic TC activity found in instrumental records (9, 46). Our finding that a notable increase in TC activity in the North Atlantic is strongly associated with a reduction in airborne dust concentrations is therefore consistent with the physics of tropical climates and the known environmental history of the Sahara.
At present our model results cannot be directly substantiated by paleotempest records given their sparsity. Nevertheless, our study provides a testable prediction of the relationship between climatic conditions in the Sahara and the global behavior of TCs that can be empirically evaluated as more proxy reconstructions of TC activity become available. Additional modeling studies studying TC activity and accounting for vegetation and dust feedback are needed to supplement our findings. It would also be important to investigate TC behavior under future anthropogenic-induced climate change, in which the vegetation and dust feedbacks have been generally overlooked. The societal importance of this proposed relationship in the context of anthropogenic climate change should serve as a stimulus for obtaining additional proxy records, in particular over the tropical western North Atlantic and Pacific Oceans. Our work indicates, for example, that if future warming leads to a “regreening” of the Sahel/Sahara region and/or a reduction of dust fluxes over the tropical North Atlantic—as suggested in some recent studies (10–12, 47)—then the Caribbean, the Gulf of Mexico, and the eastern coast of the United States could become more susceptible to damage from severe TCs.
Methods
Experimental Design.
In the mid-Holocene control (MHPMIP) experiment the boundary conditions were set at preindustrial values—except for the orbital forcing and greenhouse gases—following the PMIP protocol (32). The changes in the Earth’s orbital parameters in the MH increase the amplitude of the seasonal cycle in NH insolation by ∼5% compared with present-day values. The MH sensitivity studies analyzed in this work in which we change in turn the vegetation over the Sahara domain (evergreen shrub: 11°–33°N and 15°W–35°E) and reduce the dust concentration by up to 80% are described in detail in Pausata et al. (38). The 80% RD was applied over a broad area around the Sahara desert from the nearby Atlantic Ocean to the Middle East and throughout the troposphere (up to 150 hPa). A smoothing filter was used to avoid excessively abrupt transitions in dust concentrations [figure S1 b, d, and f in in Pausata et al. (38)]. Above 150 hPa the dust reduction was more evenly applied due to the fact that aerosol particles are uniformly distributed at those elevations. The change in dust concentration, although based on available proxy records off the coast of northwestern Africa (14, 15), and vegetation cover are not meant to provide a faithful representation of the MH conditions over the Sahara and nearby regions, because no accurate vegetation reconstruction is available at the moment. They are instead designed to more easily disentangle the effects of land surface cover and dust loading on atmospheric circulation and specifically on TC activity.
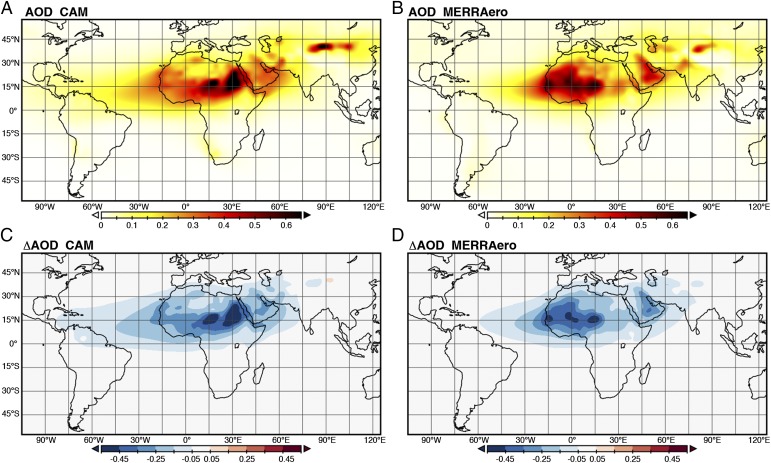
The dust distribution used in this study and in Pausata et al. (38) was taken from the Community Atmosphere Model (CAM) (48), which is used in the Coupled Model Intercomparison Project (CMIP) phase 5. However, the dust distribution shows very high concentrations over eastern Africa that are not present in observations, in which dust loading peaks over Chad and the western Sahara desert. To test our model results to the spatial pattern of the dust distribution we create new prescribed dust concentrations and distribution based on the long-term monthly mean (1980–2015) output from the MERRAero dataset, which assimilates satellite data (Fig. S9) (https://gmao.gsfc.nasa.gov/reanalysis/merra/MERRAero/). The changes in TC activity using the dust (and reduced) files inferred from MERRAero do not show appreciable differences from the case in which the CAM-derived dust is used (compare Fig. 1 and Fig. S10).
Fig. S9.
(A–D) Climatological dust aerosol optical depth (AOD) annual mean at 550 nm using CAM-derived dust-mixing ratio (A) and inferred using MERRAero dataset (B) and their respective changes (C and D) for the reduced-dust experiments.
Fig. S10.
(A and B) Climatological track density for the preindustrial experiment (A) and changes in track density for the MHGS+RD (orbital changes + green Sahara + reduced dust) experiments (B) relative to the preindustrial using the new dust reconstructions based on MERRAero. Only values that are significantly different at the 5% level using a local (grid-point) t test are shaded. The contour intervals (dashed, negative anomalies; solid, positive anomalies) follow the color bar scale.
The greening of the Sahara corresponds to a reduction in the surface albedo from 0.3 to 0.15 and an increase in the leaf area index from 0.2 to 2.6 (table 1 in ref. 38). The dust reduction leads to a decrease in the dust aerosol optical depth of almost 60% and in the global total aerosol optical depth of 0.02 [figure 1 in Pausata et al. (38)]. Initial conditions for the MH experiments were taken from the preindustrial spin-up run, and the simulations were then run until the climate reaches quasi-equilibrium after about 100–200 y, depending on the experiment. We focus on the equilibrium responses, and we analyze 30 y of each sensitivity experiment.
TC Dynamical Downscaling and Genesis Indexes.
Here we provide a brief overview of the TC dynamical downscaling technique adopted in this study; an extensive description can be found in Emanuel et al. (5). This technique incorporates both thermodynamic and kinematic statistics derived from the coupled-model simulations to drive a detailed, coupled ocean–atmosphere tropical cyclone model, producing a large number (∼103–104) of synthetic TCs. These are then used to characterize the TC climatology of each sensitivity experiment. The synthetic TCs are generated through the following three steps.
Genesis.
The genesis of the synthetic tropical cyclones is based on “random seeding”: The storms are initiated at points that are randomly distributed in space and time, under the following conditions of warm-core vortices with peak wind speeds of only 6 m/s and almost no midlevel humidity anomaly in their cores. These random “seeds” are distributed everywhere and at all times, except at the equator (±3° latitude). This technique does not account for potential initiating disturbances that can favor TC genesis, such as easterly waves. The algorithm includes a parameterization of the detrimental effect of environmental wind shear on TCs.
Tracks.
We use a “beta-and-advection” model to predict storm tracks using only the large-scale background wind fields. The beta-and-advection model uses synthetic wind time series at 850 hPa and 250 hPa, represented as Fourier series of random phase with the monthly means, variances, and covariances obtained using daily data from EC-Earth and a geostrophic turbulence power-law distribution of kinetic energy.
Intensity.
We use the “Coupled Hurricane Intensity Prediction System” (“CHIPS”), which is a coupled air–sea TC model to predict the wind field of each storm. This model has been largely used to produce skillful, real-time hurricane intensity forecasts. The model takes as inputs EC-Earth’s thermodynamic state and wind shear, as described in detail in Emanuel (49). CHIPS also account for the variable midtropospheric temperature and relative humidity, reading in EC-Earth’s monthly mean entropy at 600 hPa.
We also separately calculate the potential intensity (VPI), which is determined by the thermal structure of the atmosphere and is a proxy for the upper limit of thermodynamically achievable intensity for the mature phase of a TC. The VPI depends on the temperatures at the surface (SST) and the convective outflow level (T0),
where is the ratio of the exchange coefficients for enthalpy and drag and is the difference between the sea-surface saturation-specific enthalpy and that of the overlying marine boundary layer (k).
Finally we adopted the GPI to collectively take into account the most important environmental factors (thermodynamic and kinematic) that affect TC genesis. We adopted the GPI defined in Emanuel (50), with the exception that it incorporates the findings of Tippett et al. (51), who showed that vorticity does not appear to be rate limiting outside of very low latitudes. In doing so we are also consistent with previous paleoclimate studies on MH TCs (30, 31), in which they use the so-called “clipped vorticity,”
where is the absolute vorticity calculated at 850 hPa, is the 200- to 850-hPa wind shear value, is the moist entropy deficit, is the maximum potential intensity a TC can theoretically achieve, and b is an empirically derived normalization factor to calibrates the GPI to preindustrial values.
Role of Each GPI Component on TC Developments.
The wind shear and the absolute vorticity are the two kinematic factors included in the GPI: The wind shear is the vertical shear of the horizontal winds between 200 hPa and 850 hPa. High wind shear causes asymmetries in the developing cyclone that reduce the efficiency of drawing warm and moist air from the ocean and also allow inflow of relatively cooler and drier air from the top, which weakens cyclone formation. The vorticity acts as a spin-up mechanism that favors cyclone formation (43).
The potential intensity and the moist entropy deficit are the thermodynamic factors included in the GPI: The potential intensity indicates the maximum wind speed permissible by the thermodynamic environment. The moist entropy difference between the midtroposphere and the boundary layer provides information on the duration needed for an initial perturbation to moisten the middle troposphere before intensification occurs. Higher entropy difference signifies a longer duration. For clarity we have plotted in Model Description and Experiment Design the reciprocal of the entropy parameter, which means that higher values correspond to more favorable conditions for TC development.
Model Description and Experiment Design
We used version 3 of the climate model EC-Earth (52) to design numerical simulations of the preindustrial and mid-Holocene climates. The atmospheric model is based on the Integrated Forecast System (IFS cycle 36r4) developed by the European Centre for Medium-Range Weather Forecasts, including the H-TESSEL land model. The simulation is run at T159 horizontal spectral resolution (roughly 1.125° × 1.125°) with 62 vertical levels.
The ocean model is version 3.3.1 of the Ocean General Circulation Model–NEMO (53). It solves the primitive equations discretized on a curvilinear horizontal mesh with a horizontal resolution of about 1° × 1° and 46 vertical levels. At the surface, the model is coupled every model hour with the Louvain-la-Neuve Ice Model–LIM3 (54) that has the same horizontal resolution as NEMO. The coupling between the NEMO–LIM system and the atmospheric model IFS was carried out with the coupler OASIS3 (55).
EC-Earth has been extensively used for simulating past, historical, and future climate contributing to the Fifth Assessment Report of the Intergovernmental Panel on Climate Change (41) and to the Paleoclimate Modeling Intercomparison (56). EC-Earth has shown good skills in representing monsoonal precipitation both temporally and spatially in present-day climate (38, 56). The tropical variability over the Pacific is well captured; however, it is somewhat underestimated compared with observations [see figure 3 in Hazeleger et al. (52)].
Boundary conditions for the mid-Holocene control (MHPMIP), except for the orbital forcing and greenhouse gases, were set at preindustrial values according to PMIP/CMIP5 protocol (32). This includes land surface, aerosols, ice sheets, topography, and coastlines. The orbital forcing was set at 6,000-yBP values and computed internally using the method of Berger (57). For the greenhouse gases we changed methane concentration from 760 parts per million by volume (ppmv) PI value to 650 ppmv for MH according to PMIP/CMIP5 protocol and kept CO2 and other greenhouse gases the same as PI. A second set of experiments was carried out in which the vegetation type over the Sahara domain (11°–33°N and 15°W–35°E) is set to shrub (MHGS) and the PI dust amount is also reduced by up to 80% [figures 1 and S1 in Pausata et al. (36)], based on recent estimates of Saharan dust flux reduction during the MH (14, 15) (MHGS+RD).
Acknowledgments
F.S.R.P. acknowledges funding from the Swedish Research Council as part of the Joint Programming Initiative on Climate and the Belmont Forum for the project “PAlaeo-Constraints on Monsoon Evolution and Dynamics.” K.A.E. is grateful for support from the National Science Foundation (NSF) under Grant AGS-1461517. Q.Z. acknowledges funding from Swedish Research Council Vetenskapsrådet (VR) for the French–Swedish project Greenland In a Warming Arctic (GIWA). J.C.S. acknowledges funding by the US NSF (P2C2 Grant 1358362). J.P.D. acknowledge funding by the US NSF and support from the Dalio Family Foundation. The climate model simulations and analysis were performed on resources provided by the Swedish National Infrastructure for Computing at National Supercomputer Centre (NSC) and Cray XC30 HPC systems at European Centre for Medium-Range Weather Forecasts.
Footnotes
The authors declare no conflict of interest.
This article is a PNAS Direct Submission.
This article contains supporting information online at www.pnas.org/lookup/suppl/doi:10.1073/pnas.1619111114/-/DCSupplemental.
References
- 1.Holly G, Peter D, Catherine C. Hurricane impacts on coastal ecosystems. Estuaries Coasts. 2006;29:877–879. [Google Scholar]
- 2.Donnelly JP, Giosan L. Tempestuous highs and lows in the Gulf of Mexico. Geology. 2008;36:751–752. [Google Scholar]
- 3.Philpott SM, Lin BB, Jha S, Brines SJ. A multi-scale assessment of hurricane impacts on agricultural landscapes based on land use and topographic features. Agric Ecosyst Environ. 2008;128:12–20. [Google Scholar]
- 4.Emanuel K. Increasing destructiveness of tropical cyclones over the past 30 years. Nature. 2005;436:686–688. doi: 10.1038/nature03906. [DOI] [PubMed] [Google Scholar]
- 5.Emanuel K, et al. Hurricanes and global warming: Results from downscaling IPCC AR4 simulations. Bull Am Meteorol Soc. 2008;89:347–367. [Google Scholar]
- 6.Sobel AH, et al. Human influence on tropical cyclone intensity. Science. 2016;353:242–246. doi: 10.1126/science.aaf6574. [DOI] [PubMed] [Google Scholar]
- 7.Knutson TR, et al. Tropical cyclones and climate change. Nat Geosci. 2010;3:157–163. [Google Scholar]
- 8.Emanuel KA. Downscaling CMIP5 climate models shows increased tropical cyclone activity over the 21st century. Proc Natl Acad Sci USA. 2013;110:12219–12224. doi: 10.1073/pnas.1301293110. [DOI] [PMC free article] [PubMed] [Google Scholar]
- 9.Evan AT, Dunion J, Foley JA, Heidinger AK, Velden CS. New evidence for a relationship between Atlantic tropical cyclone activity and African dust outbreaks. Geophys Res Lett. 2006;33:L19813. [Google Scholar]
- 10.Evan AT, Flamant C, Gaetani M, Guichard F. The past, present and future of African dust. Nature. 2016;531:493–495. doi: 10.1038/nature17149. [DOI] [PubMed] [Google Scholar]
- 11.Biasutti M. Forced Sahel rainfall trends in the CMIP5 archive. J Geophys Res Atmos. 2013;118:1613–1623. [Google Scholar]
- 12.Monerie P-A, Biasutti M, Roucou P. On the projected increase of Sahel rainfall during the late rainy season. Int J Climatol. 2016;36:4373–4383. [Google Scholar]
- 13.Acosta Navarro JC, et al. Future response of temperature and precipitation to reduced aerosol emissions as compared with increased greenhouse gas concentrations. J Clim. 2017;30:939–954. [Google Scholar]
- 14.DeMenocal P, et al. Abrupt onset and termination of the African Humid Period. Quat Sci Rev. 2000;19:347–361. [Google Scholar]
- 15.McGee D, deMenocal PB, Winckler G, Stuut JBW, Bradtmiller LI. The magnitude, timing and abruptness of changes in North African dust deposition over the last 20,000 yr. Earth Planet Sci Lett. 2013;371–372:163–176. [Google Scholar]
- 16.Kropelin S, Verschuren D, Lezine A-M. Response to comment on “Climate-driven ecosystem succession in the Sahara: The past 6000 years”. Science. 2008;322:1326c–1326c. doi: 10.1126/science.1154913. [DOI] [PubMed] [Google Scholar]
- 17.Shanahan TM, et al. The time-transgressive termination of the African Humid Period. Nat Geosci. 2015;8:140–144. [Google Scholar]
- 18.Tierney JE, Pausata FSR, deMenocal PB. Rainfall regimes of the Green Sahara. Sci Adv. 2017;3:e1601503. doi: 10.1126/sciadv.1601503. [DOI] [PMC free article] [PubMed] [Google Scholar]
- 19.Broecker WS, Putnam AE. Hydrologic impacts of past shifts of Earth’s thermal equator offer insight into those to be produced by fossil fuel CO2. Proc Natl Acad Sci USA. 2013;110:16710–16715. doi: 10.1073/pnas.1301855110. [DOI] [PMC free article] [PubMed] [Google Scholar]
- 20.Donnelly JP, Woodruff JD. Intense hurricane activity over the past 5,000 years controlled by El Niño and the West African monsoon. Nature. 2007;447:465–468. doi: 10.1038/nature05834. [DOI] [PubMed] [Google Scholar]
- 21.Toomey MR, Curry WB, Donnelly JP, van Hengstum PJ. Reconstructing 7000 years of North Atlantic hurricane variability using deep-sea sediment cores from the western Great Bahama Bank. Paleoceanography. 2013;28:31–41. [Google Scholar]
- 22.McCloskey TA, Liu K-b. A 7000 year record of paleohurricane activity from a coastal wetland in Belize. Holocene. 2013;23:278–291. [Google Scholar]
- 23.Wallace DJ, Woodruff JD, Anderson JB, Donnelly JP. Palaeohurricane reconstructions from sedimentary archives along the Gulf of Mexico, Caribbean Sea and western North Atlantic Ocean margins. Geol Soc Lond Spec Publ. 2014;388:481–501. [Google Scholar]
- 24.Kröpelin S, et al. Climate-driven ecosystem succession in the Sahara: The past 6000 years. Science. 2008;320:765–768. doi: 10.1126/science.1154913. [DOI] [PubMed] [Google Scholar]
- 25.Fleitmann D, et al. Holocene forcing of the Indian monsoon recorded in a stalagmite from southern Oman. Science. 2003;300:1737–1739. doi: 10.1126/science.1083130. [DOI] [PubMed] [Google Scholar]
- 26.Saraswat R, Lea DW, Nigam R, Mackensen A, Naik DK. Deglaciation in the tropical Indian Ocean driven by interplay between the regional monsoon and global teleconnections. Earth Planet Sci Lett. 2013;375:166–175. [Google Scholar]
- 27.Moy CM, Seltzer GO, Rodbell DT, Anderson DM. Variability of El Niño/Southern Oscillation activity at millennial timescales during the Holocene epoch. Nature. 2002;420:162–165. doi: 10.1038/nature01194. [DOI] [PubMed] [Google Scholar]
- 28.Conroy JL, Overpeck JT, Cole JE, Shanahan TM, Steinitz-Kannan M. Holocene changes in eastern tropical Pacific climate inferred from a Galápagos lake sediment record. Quat Sci Rev. 2008;27:1166–1180. [Google Scholar]
- 29.Koutavas A, Joanides S. El Niño-Southern Oscillation extrema in the Holocene and Last Glacial Maximum. Paleoceanography. 2012;27:PA4210. [Google Scholar]
- 30.Korty RL, Camargo SJ, Galewsky J. Variations in tropical cyclone genesis factors in simulations of the Holocene epoch. J Clim. 2012;25:8196–8211. [Google Scholar]
- 31.Koh JH, Brierley CM. Tropical cyclone genesis potential across palaeoclimates. Clim Past. 2015;11:1433–1451. [Google Scholar]
- 32.Taylor KE, Stouffer RJ, Meehl GA. A summary of the CMIP5 experiment design. 2009 Available at cmip-pcmdi.llnl.gov/cmip5/docs/Taylor_CMIP5_design.pdf. Accessed December 9, 2014.
- 33.Lézine A-M, Hély C, Grenier C, Braconnot P, Krinner G. Sahara and Sahel vulnerability to climate changes, lessons from Holocene hydrological data. Quat Sci Rev. 2011;30:3001–3012. [Google Scholar]
- 34.Hély C, Lézine A-M. ADP Contributors Holocene changes in African vegetation: Tradeoff between climate and water availability. Clim Past. 2014;10:681–686. [Google Scholar]
- 35.Harrison SP, et al. Climate model benchmarking with glacial and mid-Holocene climates. Clim Dyn. 2014;43:671–688. [Google Scholar]
- 36.Bird BW, et al. A Tibetan lake sediment record of Holocene Indian summer monsoon variability. Earth Planet Sci Lett. 2014;399:92–102. [Google Scholar]
- 37.van Hengstum PJ, et al. The intertropical convergence zone modulates intense hurricane strikes on the western North Atlantic margin. Sci Rep. 2016;6:21728. doi: 10.1038/srep21728. [DOI] [PMC free article] [PubMed] [Google Scholar]
- 38.Pausata FSR, Messori G, Zhang Q. Impacts of dust reduction on the northward expansion of the African monsoon during the Green Sahara period. Earth Planet Sci Lett. 2016;434:298–307. [Google Scholar]
- 39.Muschitiello F, Zhang Q, Sundqvist HS, Davies FJ, Renssen H. Arctic climate response to the termination of the African Humid Period. Quat Sci Rev. 2015;125:91–97. [Google Scholar]
- 40.Davies FJ, Renssen H, Blaschek M, Muschitiello F. The impact of Sahara desertification on Arctic cooling during the Holocene. Clim Past. 2015;11:571–586. [Google Scholar]
- 41.Hazeleger W, et al. EC-Earth V2.2: Description and validation of a new seamless earth system prediction model. Clim Dyn. 2012;39:2611–2629. [Google Scholar]
- 42.Vecchi GA, Swanson KL, Soden BJ. Whither hurricane activity? Science. 2008;322:687–689. doi: 10.1126/science.1164396. [DOI] [PubMed] [Google Scholar]
- 43.Camargo SJ, Tippett MK, Sobel AH, Vecchi GA, Zhao M. Testing the performance of tropical cyclone genesis indices in future climates using the HiRAM model. J Clim. 2014;27:9171–9196. [Google Scholar]
- 44.Mulitza S, et al. Increase in African dust flux at the onset of commercial agriculture in the Sahel region. Nature. 2010;466:226–228. doi: 10.1038/nature09213. [DOI] [PubMed] [Google Scholar]
- 45.Williams RH, et al. Glacial to Holocene changes in trans-Atlantic Saharan dust transport and dust-climate feedbacks. Sci Adv. 2016;2:e1600445. doi: 10.1126/sciadv.1600445. [DOI] [PMC free article] [PubMed] [Google Scholar]
- 46.Dunion JP, Velden CS, Dunion JP, Velden CS. The impact of the Saharan air layer on Atlantic tropical cyclone activity. Bull Am Meteorol Soc. 2004;85:353–365. [Google Scholar]
- 47.Hoscilo A, et al. A conceptual model for assessing rainfall and vegetation trends in sub-Saharan Africa from satellite data. Int J Climatol. 2015;35:3582–3592. [Google Scholar]
- 48.Albani S, et al. Improved dust representation in the Community Atmosphere Model. J Adv Model Earth Syst. 2014;6:541–570. [Google Scholar]
- 49.Emanuel K. Climate and tropical cyclone activity: A new model downscaling approach. J Clim. 2006;19:4797–4802. [Google Scholar]
- 50.Emanuel K. Tropical cyclone activity downscaled from NOAA-CIRES reanalysis, 1908–1958. J Adv Model Earth Syst. 2010;2:1. [Google Scholar]
- 51.Tippett MK, Camargo SJ, Sobel AH. A Poisson regression index for tropical cyclone genesis and the role of large-scale vorticity in genesis. J Clim. 2011;24:2335–2357. [Google Scholar]
- 52.Hazeleger W, et al. EC-Earth: A seamless earth-system prediction approach in action. Bull Am Meteorol Soc. 2010;91:1357–1363. [Google Scholar]
- 53.Madec G. 2008. NEMO ocean engine, Note du Pole de Modélisation No. 27 (Institut Pierre-Simon Laplace, Paris)
- 54.Vancoppenolle M, et al. Simulating the mass balance and salinity of Arctic and Antarctic sea ice. 1. Model description and validation. Ocean Model. 2008;27:33–53. [Google Scholar]
- 55.Valcke S. 2006 OASIS3 User Guide (European Centre for Research and Advanced Training in Scientific Computation, Toulouse, France), PRISM Tech Rep 3. Available at www.prism.enes.org/Publications/Reports/oasis3_UserGuide_T3.pdf. Accessed April 4, 2015.
- 56.Bosmans JHC, et al. Monsoonal response to mid-holocene orbital forcing in a high resolution GCM. Clim Past. 2012;8:723–740. [Google Scholar]
- 57.Berger A. Long-term variations of daily insolation and quaternary climatic changes. Atmos Sci. 1978;35:2362–2367. [Google Scholar]


