Significance
Converting a visual input into a motor output is a fundamental computation that nervous systems have evolved to perform. In the context of saccadic eye movements, several brain areas have been identified that exhibit the effect of visuomotor computations. Nevertheless, because of dense interconnectivity between these areas, the contribution of a particular brain area to the visuomotor transformation process has not been clarified. By simultaneously recording from the local field potential (LFP) that is thought to reflect input to an area, and spiking activity that reflects its output activity, we showed that frontal eye field neurons perform the necessary visuomotor transformation to generate a saccade plan internally. We also identify specific components of the LFP such as gamma oscillations that may enable such a visual-to-motor transformation.
Keywords: oscillations, saccades, oculomotor, frontal cortex, sensorimotor
Abstract
The frontal eye field (FEF) is a key brain region to study visuomotor transformations because the primary input to FEF is visual in nature, whereas its output reflects the planning of behaviorally relevant saccadic eye movements. In this study, we used a memory-guided saccade task to temporally dissociate the visual epoch from the saccadic epoch through a delay epoch, and used the local field potential (LFP) along with simultaneously recorded spike data to study the visuomotor transformation process. We showed that visual latency of the LFP preceded spiking activity in the visual epoch, whereas spiking activity preceded LFP activity in the saccade epoch. We also found a spatially tuned elevation in gamma band activity (30–70 Hz), but not in the corresponding spiking activity, only during the delay epoch, whose activity predicted saccade reaction times and the cells’ saccade tuning. In contrast, beta band activity (13–30 Hz) showed a nonspatially selective suppression during the saccade epoch. Taken together, these results suggest that motor plans leading to saccades may be generated internally within the FEF from local activity represented by gamma activity.
The process of generating a motor plan from visual information entails a visuomotor transformation. The frontal eye field (FEF) is one of the cortical regions that contributes to the visuomotor transformation process by participating in critical events such as target selection (1–3) and saccade preparation (4–6). In addition to FEF, other oculomotor areas such as the lateral intraparietal cortex (7), the supplementary eye fields (8), the superior colliculus (9), and the dorsolateral prefrontal cortex (10) also possess neurons with similar properties as FEF neurons. Thus, a central question that remains unresolved is to what extent do the response properties of FEF neurons represent a cause versus a consequence of computations occurring elsewhere.
One approach to resolve this question of causation versus consequence, in the context of target selection, was the use of simultaneously recorded local field potentials (LFP) and spikes—making use of the idea that the LFP represents synchronized input coming into a brain area, as opposed to spiking activity, which is thought to represent output (11–15). Using this approach, Monosov et al. showed that FEF received spatially nonselective input through LFP earlier than spikes in the early visual epoch; however, in the consequent target selection epoch, spiking activity of FEF neurons evolved spatial selectivity and actively discriminated between the behaviorally relevant and the irrelevant stimuli earlier than the LFP (1). Such a temporal relationship between LFP and spikes during target selection in FEF has also been studied by others using simultaneously recorded LFP and spikes, converging to the same evidence (5, 16). However, whereas these studies suggest a causal role for FEF in visual selection, the causal role of FEF in saccade preparation has not yet been reported. In this study, we asked whether saccade related signals observed in FEF neurons were also generated internally or whether they represent a readout of the information brought in by other oculomotor areas. To answer this question, a temporal dissociation between visual and saccade events was necessary to analyze the signals in both epochs individually and, hence, we used a memory-guided saccade task.
Whereas simultaneous recording of spikes and LFP provide a useful approach to study input-output transformations (15), the frequency component of the LFP can also provide a complimentary approach to characterize the nature of transformations. Specifically, the role of gamma band activity (30–70 Hz) in the cerebral cortex has been a critical topic of discussion over the past decade because its activity has been correlated with cognitive roles such as attentional load (17–19), perceptual processes (20), and memory (21, 22). While the timing of gamma activity and its tuning properties make it a plausible candidate in mediating sensory-motor integration processes (23, 24), the link between saccade planning and gamma activity in FEF, is still unclear. In addition to gamma band activity, low frequency beta band (13–30 Hz) activity is also thought to play a role during movement preparation and execution (25). Beta activity is usually suppressed before a voluntary movement, gradually decreasing to reach a minima at the time of movement execution, followed by a phasic rebound (26, 27). Therefore, we also studied the relative contributions of different components of the LFP to understand their potential roles in the visuomotor transformation process within FEF.
Results
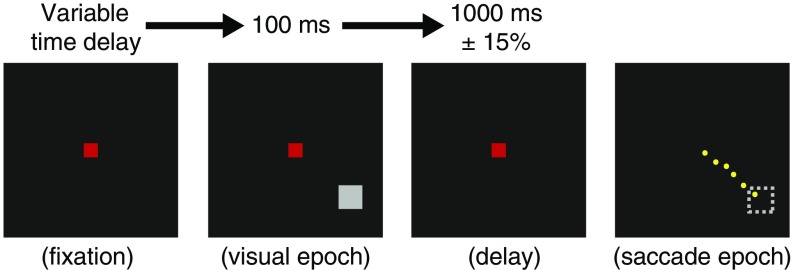
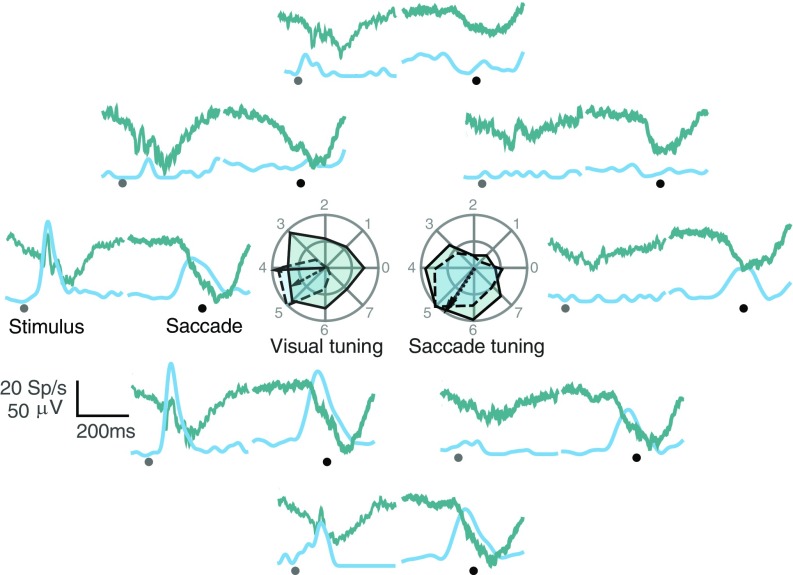
To compare the timing of visual and saccadic responses in the LFP and simultaneously recorded spikes, we trained two macaque monkeys to perform a memory-guided saccade task, to dissociate the visual and saccadic epochs (SI Materials and Methods and Fig. 1). Fig. 2 shows an example neural signal and simultaneously recorded LFP in one representative site having both visual and saccadic responses as a function of eight stimulus/saccade positions. The sensory-motor responses seen in both LFP and spikes were also spatially tuned (Fig. 2, Inset).
Fig. 1.
Memory-guided saccade task. The monkey fixated on a central (0.6° x 0.6°) red square fixation point on a dark background. Following a variable time delay, a peripheral gray target (1° x 1°) appeared on one of eight equally spaced positions on an imaginary circle of eccentricity 12°. The target was extinguished after 100 ms of its appearance. The monkey continued to fixate on the central fixation point for 1,000 ms (±15% jitter). When the central fixation spot was extinguished, the monkey made a single saccade (yellow trace) to the remembered target location (shown as an unfilled dashed gray square).
Fig. 2.
Representative LFP signal and simultaneously recorded neural spikes. Average LFP (green) and spike density functions (blue) from a representative recording site for all eight stimulus locations. The first epoch shows the signals aligned to stimulus onset (gray dot), and the second epoch shows the signals aligned to saccade onset (black dot). The tuning and the preferred direction of the LFP (solid line) and the spike averaged activity (dashed line) for both stimulus and saccade epochs in all eight positions are shown in the Inset.
Comparison of LFP and Spike Timing in the Visual Epoch.
In the first stage of a saccade plan, FEF receives visual information as an input from many brain regions through the dorsal and the ventral pathways. Earlier studies have shown that the LFP signals in FEF have visual response latencies (VRLs) significantly earlier than spikes, suggesting that the LFP reflected the visual input to FEF (1, 5). In this study, we first investigated the temporal relationship between the LFP and spikes in the visual epoch to confirm this result.
We calculated the VRL of LFP and spikes by performing a t test between the baseline and the signals in the visual epoch (SI Materials and Methods). Fig. S1 shows the result of this analysis for an example LFP site (Fig. S1A) and a simultaneously recorded neuron (Fig. S1B). For all 66 recorded sites, we found that the LFP showed VRL earlier than spikes (n = 66; P < 10−17), albeit with different latency differences between them. The VRL for the population of recorded LFP sites was 58.9 ± 1.6 ms and that of the spikes was 78.4 ± 1.2 ms. The mean difference between LFP and spike VRL was −19.5 ± 1.4 ms (Fig. S1C). This result suggests that the LFP has information regarding the location of the visual stimulus significantly earlier than the spikes in FEF, supporting previous studies (1, 28).
Fig. S1.
VRL for LFP and spikes. (A) VRL for a representative LFP site. Average LFP waveform aligned to stimulus onset, superimposed on the P value obtained by performing a t test between the baseline at each millisecond of the signal indicating the probability that the signal was not different from the baseline. VRL for this site was 70 ms (vertical dotted line). (B) VRL for a simultaneously recorded spiking activity of the neuron. Same format as above, but for spikes. The VRL for this neuron was 89 ms (vertical dotted line). (C) The distribution of VRLs for LFP and simultaneously recorded neural spikes sorted by LFP latency. The average VRLs for LFP (green circles) and simultaneously recorded neural spikes (blue triangle) are shown in Upper; t test, P < 10−16. Inset shows the distribution of differences between the VRLs of LFP and spikes. The mean of the differences was −19.29 ± 1.42 ms.
Comparison of LFP and Spike Timing in the Saccade Epoch.
We calculated the time of saccade plan onset (SPO) as the first point before the start of the saccade when the signal (LFP/spike) differed from baseline (SI Materials and Methods). Fig. 3 shows the result of this analysis for an example neuron (Fig. 3A) and the simultaneously recorded LFP (Fig. 3B). The SPOSPK was significantly earlier than the SPOLFP (n = 66; P < 10−21) in all the sessions. Also, whereas the SPOSPK showed a distributed range spanning a significant amount of the presaccadic epoch, the SPOLFP was distributed in a narrow epoch close to the start of the saccade. The mean SPOSPK for the population was −215.0 ± 7.0 ms and the mean SPOLFP was −84.4 ± 5.6 ms before the start of the saccade, with a mean difference (ΔSPO) of −130.6 ± 9.0 ms (Fig. 3C).
Fig. 3.
Saccade plan onset times for spikes and LFP. (A) SPO for a representative neuron. The average spike density function across all eight positions for the representative neuron (solid line) superimposed on the P value obtained from performing a t test indicating the probability that the signal was not different from the baseline (gray shaded region). The SPO for this neuron was −182 ms (vertical solid line). (B) SPO for the simultaneously recorded LFP signal. Same format as above. The SPOLFP for this site was −107 ms (vertical solid line). (C) (Bottom) SPOSPK (blue triangles) and SPOLFP (green circles) for all sessions sorted by SPOSPK times. Upper shows the mean SPOSPK and SPOLFP; t test, P < 10−21. Inset shows the distribution of ΔSPO between each SPK-LFP pair.
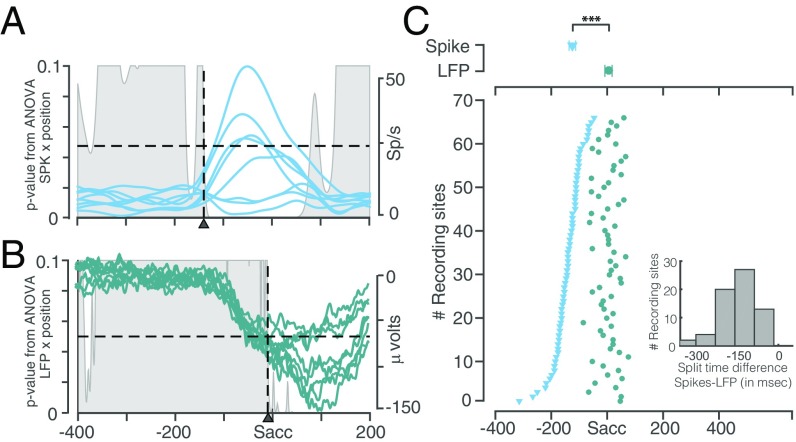
We also calculated the saccade plan specification (SPS) time as the first time point before the start of the saccade when the signals (LFP/spikes) in at least one of the eight spatial positions differed from others (SI Materials and Methods). Fig. 4 shows the result of this analysis for an example neuron (Fig. 4A) and simultaneously recorded LFP (Fig. 4B). SPSSPK was earlier than SPSLFP for all the sessions. For the population, the mean SPSSPK was −141.9 ± 6.2 ms and the mean SPSLFP was 3.2 ± 4.7 ms before the start of the saccade, with a difference (ΔSPS) of −145.1 ± 8.0 ms (Fig. 4C).
Fig. 4.
Saccade plan specification times for spikes and LFP. (A) SPS for a representative neuron. The average spike density function in each of the eight positions for the representative neuron (solid lines) superimposed on the P value obtained from ANOVA across the signals from eight positions, indicating the probability that the signals were not different from each other (gray shaded region). The SPS for this neuron was −141 ms (vertical dashed line). (B) SPS for the simultaneously recorded LFP signal. Same format as above. The SPSLFP for this site was −2 ms (vertical dashed line). (C) Bottom shows the SPSSPK (blue triangles) and SPSLFP (green circles) for all sessions sorted by SPSSPK times. Upper shows the mean SPSSPK SPSLFP; t test, P < 10−22. Inset shows the distribution of ΔSPS between each SPK-LFP pair.
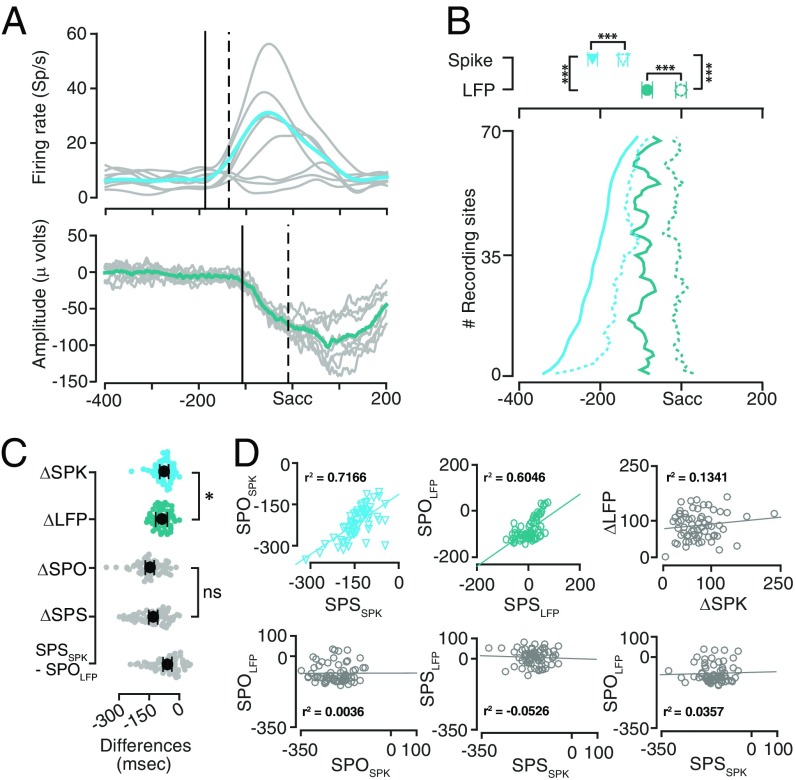
SPSSPK and SPSLFP showed a similar trend as the SPOSPK and SPOLFP times, but shifted in time (Fig. 5A). The LFP showed an onset only 57.5 ± 8.3 ms after the spikes specified the saccade plan. Spikes specified the saccade direction approximately 73.1 ± 5.0 ms after they showed onset and the LFP specified the saccade direction approximately 87.6 ± 4.6 ms after their onset, suggesting that the spikes took less time to specify the saccade direction after their onset compared with the LFP (P = 0.0148; Fig. 5 B and C).
Fig. 5.
Comparison of saccade plan onset and specification times for spikes and LFP. (A, Top) The average firing rate from a representative neuron in each of the eight positions (gray) superimposed with the average firing rate across all eight positions (green). SPO is shown as a solid line, and the SPS is shown as a dashed line. (A, Lower) Same format as Upper, but for LFP from a representative site. All traces were taken from Figs. 3 and 4. (B) The SPO (solid lines) and SPS (dashed lines) for LFP (green) and spikes (blue) for all of the sessions, sorted by SPOSPK. The plot is smoothened for ease of viewing. Upper shows the mean and SEM for the SPO and SPS for LFP and spikes. All traces were taken from Figs. 3 and 4. (C) Pairwise differences between the SPOSPK and SPSSPK (ΔSPK), SPOLFP and SPSLFP (ΔLFP). Pairwise differences between the SPOLFP and SPOSPK (ΔSPO) and the SPSLFP and SPSSPK (ΔSPS). Difference between SPOLFP and SPSSPK. The mean and the SEs are shown as superimposed black markers. (D) The SPO and SPS were well correlated within spike and LFP, but not across spike and LFP. Upper Left, scatter plot between the SPSSPK (abscissa) and SPOSPK (ordinate). Regression line is shown as a solid blue line. Upper Middle, similarly for LFP. Upper Right, time lag between SPO and SPS was not correlated between spikes and LFP. Lower, same format as above, but for SPOLFP vs. SPOSPK onset (Left); SPSLFP vs. SPSSPK (Middle); SPOLFP vs. SPSSPK (Right).
Furthermore, the SPOSPK correlated with the SPSSPK (r2 = 0.7166; P < 10−11) and so did their LFP counterparts (r2 = 0.6046; P < 10−8); however, and more importantly, the SPOSPK – SPSSPK latency did not correlate with the SPOLFP – SPSLFP latency (r2 = 0.134; P = 0.2830). Further, neither the SPOSPK correlated with the SPOLFP (r2 = 0.036; P = 0.9771) nor was the SPSSPK correlated with the SPSLFP (r2 = −0.0526; P = 0.6747). Finally, the SPOLFP did not correlate with the SPSSPK either (r2 = 0.0357; P = 0.7760), suggesting completely different origins for spikes and LFP in the saccade epoch (Fig. 5D). Taken together, these results suggest that in the saccade epoch, the plan for onset of saccade and the direction of saccade is specified in spikes significantly earlier than, and independent of, the LFP. We return to this point in our discussion where we suggest possible explanations for our observation.
Characterization of Gamma Band Activity in FEF.
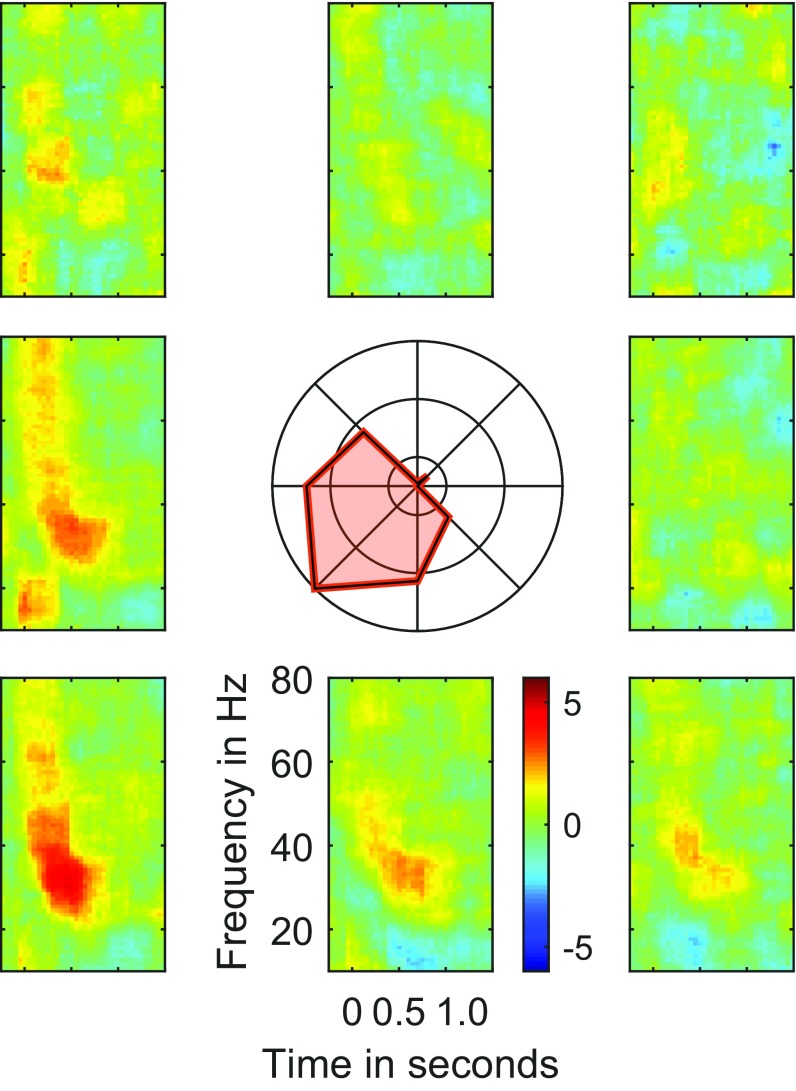
We investigated the functional role of two prominent frequency components of LFP, the gamma and the beta bands, in the visuomotor transformation process in FEF. The frequency domain information in the LFP signal was retrieved by using a Multi Taper analysis to obtain the power of each frequency component as a function of time (SI Materials and Methods). Fig. 6 shows a time-frequency spectrogram constructed from a representative LFP recording signal. The gamma power was spatially tuned in the delay period (Fig. S2) and showed elevated activity in the receptive field (RF) position (Fig. 6A, Left) which sustained in the delay period and returned to baseline in the saccadic epoch (Fig. 6A, Right). This effect, while still present, was less prevalent in the antireceptive field (aRF) position (Fig. 6B).
Fig. 6.
Time-frequency spectrogram for a representative LFP site. (A) Time-frequency spectrogram for the RF position aligned to stimulus onset (Left) and saccade onset (Right) showing an increase in gamma (30–70 Hz) power in the delay epoch and a decrease in beta (13–30 Hz) power before saccade. (B) Same format as A above, but for aRF, showing a low level of gamma increase and no change in beta decrease.
Fig. S2.
Gamma band tuning in delay epoch. Time-frequency spectrograms aligned to target onset for all eight target positions for one representative LFP site. Same format as Fig. 6. Inset shows the tuning of gamma band in the delay epoch.
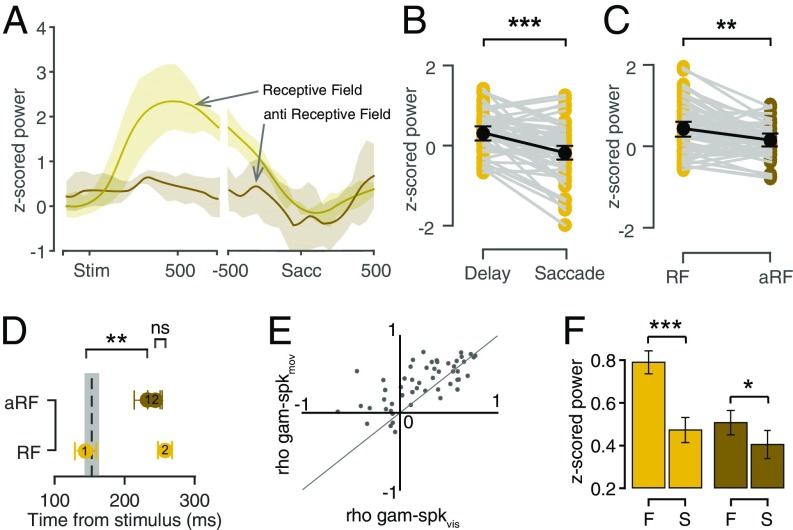
Fig. 7A shows average z-scored gamma power as a function of time in the RF and aRF positions for the representative LFP site. Gamma showed a significant elevation in activity from baseline (0.03 ± 0.03) only in the delay epoch (0.29 ± 0.06; n = 58, P = 0.001), after which it returned to the baseline and, hence, showed no significant modulation in the saccadic epoch (−0.20 ± 0.09; P = 0.129; Fig. 7B). The gamma activity was also spatially tuned in the delay epoch (RF: 0.44 ± 0.07, aRF: 0.15 ± 0.06; P = 0.01; Fig. 7C). Interestingly, although the rise time for gamma, from the baseline, in RF was significantly earlier than in aRF (RF: 143.2 ± 13.9 ms, aRF: 233.8 ± 18.9 ms; P = 0.008), the peak time was comparable (RF: 257.7 ± 6.6 ms, aRF: 243.9 ± 7.9 ms; P = 0.402). Hence, the time when gamma differed between RF and aRF (154.3 ± 17.3 ms) was close to the gamma rise time in the RF position (Fig. 7D).
Fig. 7.
Gamma band properties. (A) z-scored gamma power of a representative LFP site for RF (yellow) and aRF (brown) positions, aligned to stimulus onset (Left) and saccade onset (Right). Shading, standard deviation. (B) The average peak z-scored gamma power for the population of recorded LFP sites in the delay epoch, 150–350 ms after the visual stimulus presentation and in the saccade epoch, −300 to 100 ms from saccade onset; t test P < 10−5. (C) The average peak z-scored gamma power for the population of recorded LFP sites in the memory period in the RF (yellow) and aRF (brown). (D) Onset time for gamma power in RF (1, yellow) and in aRF (1, brown). The dotted line shows the first time when the gamma power in RF significantly differed from the gamma power in aRF position. Peak time for gamma power in RF (2, yellow) in aRF (2, brown). (E) A scatter plot between the r2 values obtained from correlating gamma tuning with visual tuning of spikes (x axis) and correlating gamma tuning with the saccadic tuning of spikes (y axis) showing that gamma tuning is more linked with saccade tuning. The thin solid line is the line of unity. (F) Gamma activity in the RF (Left) and the aRF (Right) positions for fast (F) and slow (S) RTs.
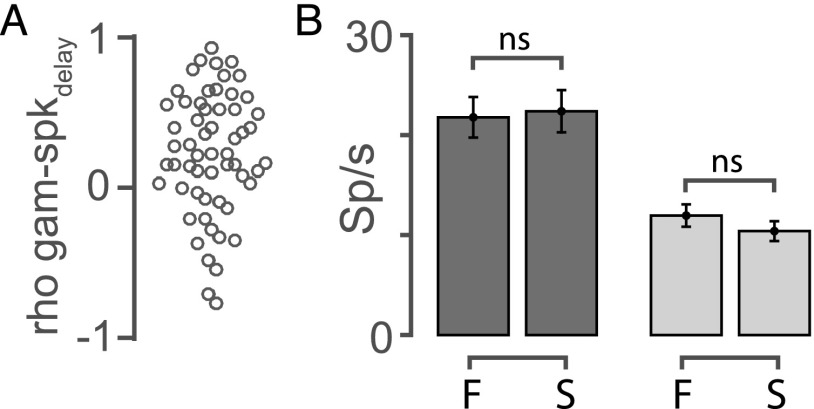
The above results characterize gamma activity as a spatially modulated oscillation in the delay epoch. We asked whether this activity profile of gamma could be linked with the sensory-motor integration processes (23, 24), especially because of its timing and spatial tuning properties. Because the neurons that were recorded simultaneously with the LFP also showed spatial tuning in both visual and saccadic epochs, we asked whether the gamma tuning was correlated with either of these neuronal tuning properties. Hence, we plotted the Spearman rho values of pairwise correlations between the saccade tuning and gamma tuning (ordinate) against the pairwise correlations of visual tuning and gamma tuning (abscissa), for each neuron. We found that the gamma activity’s tuning was more similar to the saccade tuning than the visual tuning of the neurons (Fig. 7E). To account for the possibility that the neural firing in the delay period might have an influence on the gamma activity, we also calculated the spike tuning in the memory epoch and correlated that with the gamma activity and found that none of the pairs were significantly correlated (spearman correlation; P > 0.05; Fig. S3A). Taken together, these results suggest that gamma activity could reflect the sensory to motor transformation.
Fig. S3.
Spike activity in the delay epoch. (A) Beeswarm plot of correlations between gamma activity and the neural activity in the delay epoch. None of the correlation values were significant (P > 0.05). (B) Trial by trial average neural activity in the delay period in the RF (dark gray) and aRF (light gray), separated based on fast (F) or slow (S) RT. ns, not significant.
To test this hypothesis further, we asked if gamma in FEF could predict the saccadic reaction times (RTs) of the animal. We calculated a trial-by-trial average of gamma activity in the delay period and estimated the RT as the time of the saccade onset from the “go” signal. We then classified the RT into four quantiles, and we took the first quantile as the “fast” group and the last quantile as the “slow” group to see the effects in the extreme ends. We also binned the average gamma activity based on these two RT groups. We found that the gamma in the delay period could predict the RT, with the effect being stronger in the RF positions (Fig. 7F; RF fast: 0.79 ± 0.05, RF slow: 0.47 ± 0.06; n = 58, P < 10−54; aRF fast: 0.51 ± 0.06, aRF slow: 0.40 ± 0.06; P < 10−14), but the spiking activity in the same epoch couldn’t (RF, P = 0.8375, aRF, P = 0.3032; Fig. S3B).
Characterization of Beta Band Activity in FEF.
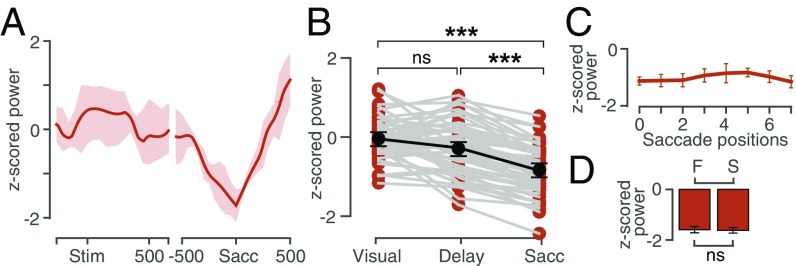
Beta band decreased in activity in the saccadic epoch (Fig. 6A, Right) with no spatial tuning (Fig. 6B, Right). Fig. 8A shows the average activity in the beta band for one representative LFP site averaged across all spatial positions. Unlike gamma activity, beta activity did not show any modulation in activity during the delay epoch but started to show a suppression in activity in the presaccadic epoch and attained a minima close to the saccade execution time.
Fig. 8.
Beta band properties. (A) Average z-scored beta power aligned to stimulus onset (Left) and saccade onset (Right) showing a decrease in beta power below the baseline level, during the saccade epoch. Shading: standard deviation (B) The average peak z-scored beta power for the population of recorded LFP sites in the visual epoch, delay epoch, and the saccade epoch. (C) The average z-scored beta power in all eight positions for the population of recorded LFP sites in the saccade epoch showing no significant tuning. (D) Population average beta activity for fast (F) and slow (S) RTs.
The beta activity in the visual (−0.02 ± 0.06) and the delay epochs (−0.25 ± 0.08) weren’t significantly different from each other (n = 58; P = 0.0672). However, the beta activity decreased significantly during the saccadic epoch (−0.82 ± 0.07) from the delay epoch (n = 58, P < 10−6). Furthermore, the baseline beta power (0.07 ± 0.05) was not significantly different from the visual epoch (P = 0.2192) but was significantly different from the saccadic epoch (P < 10−13). Therefore, beta showed suppression in activity only during the saccadic epoch (Fig. 8B). Also, the time of maximum beta suppression was 24.9 ± 20.0 ms after the saccade. This suppression of beta activity was not spatially tuned (Fig. 8C) and did not correlate with RT (fast: −1.59 ± 0.12, slow: −1.62 ± 0.11; n = 58, P = 0.9791; Fig. 8D). Although beta activity showed a distinct modulation in activity during the saccade preparation epoch, it lacked spatial tuning, did not predict the RT, and was temporally proximal to the saccade onset.
SI Materials and Methods
Data Collection.
For all experiments, TEMPO/VIDEOSYNC software (Reflective Computing) was used simultaneously with BLACKROCK Microsystems for data collection. BLACKROCK was used to collect raw neural data, sampled at 30 kHz. TEMPO/VIDEOSYNC displayed visual stimuli and stored the eye positions, which were sampled at 240 Hz with an infrared pupil tracker (ISCAN), interfaced with TEMPO software in real time. The stimuli were presented on a calibrated Sony Bravia LCD monitor (42 inches; 60 Hz refresh rate) placed 57 cm in front of the monkey. Neural signals were collected by using single tungsten microelectrodes (FHC), impedance: 2–4 MΩ from the frontal eye field on the right hemisphere through a permanently implanted recording chamber (Crist). All analyses were done offline in MATLAB (Mathworks) by using custom-made programs.
Task.
The monkeys were well trained to perform memory-guided saccades. Initially the monkeys fixated on a central (0.6° × 0.6°) red square fixation point (FP) on a dark background. Following a variable time delay (500 ms ± 30% jitter for 65% of the sessions and 300 ms ± 30% jitter for 35% of the sessions), a peripheral gray stimulus (1° × 1°), appeared on one of eight equally spaced positions on an imaginary circle of eccentricity 12°. The stimulus was extinguished after 100 ms of its appearance. The monkeys continued to fixate on the central FP for 1,000 ms ± 15% jitter following the appearance of initial stimulus. The disappearance of the central fixation spot served as a “GO signal” to execute the saccade to the remembered stimulus location. The monkeys had to fix their gaze within a 6° × 6° electronically drawn window centered on the FP/stimulus. In successful trials, the monkeys earned a reward with a drop of juice. Trials with artifacts including eye blinks, and saccades with reaction times less than 100 ms, were removed before further data analysis.
Signal Processing.
The raw neural signal was subsampled to 1,000 Hz, low pass filtered (from 0 to 150 Hz) to obtain LFP, and high pass filtered from 300 to 3,000 Hz to obtain spikes by using MATLAB’s ideal filter function. Line noise (50 Hz) was removed by using a notch filter (49.5–50.5 Hz), and the LFP signal was locally detrended by using a 1-s window with a 500-ms step size. This step removed the contribution of low frequency components that often distorted the signal (41, 42). Trials with LFP signals that differed by more than 50 μV between successive sample points were also removed. Spikes were digitized and spike timings were binned by using 1-ms bins after aligning them with specific events (visual stimulus or saccade) and then convolved with a Gaussian waveform of σ = 10 ms to obtain a continuous spike density function. The resulting smoothened spike density function not only reduced the potential of high frequency fluctuations to produce spurious and premature detections but also resulted in a response that reasonably matched the corresponding LFP signal in its overall frequency profile so that changes in timing could not be attributed to the effect of low pass filtering of the LFP signal per se. However, the use of a noncausal filter could be expected to shift reported timings from the spike density functions earlier. In principle, the maximum shift anticipated is 30 ms or 3 SDs of the Gaussian filter (see below). However, this shift in timing would not affect the reported relationship between the LFP and spikes in the saccade epoch that are well beyond the range of 30 ms (Table S1).
Table S1.
Visual latency, saccade onset, and specification times for individual monkeys
| Timings | Monkey J | Monkey G |
| VRL | LPF: 61.97 ± 2.14 ms*** | LPF: 54.60 ± 2.42 ms*** |
| Spikes: 79.87 ± 1.56 ms*** | Spikes: 76.36 ± 1.67 ms*** | |
| Mean difference: −17.89 ± 1.94 ms | Mean difference: −21.75 ± 1.87 ms | |
| SPO | LPF: −74.05 ± 7.90 ms*** | LPF: −97.62 ± 7.43 ms*** |
| Spikes: −233.57 ± 9.79 ms*** | Spikes: −191.34 ± 8.21 ms*** | |
| Mean difference: −159.51 ± 8.81 ms | Mean difference: −93.72 ± 7.08 ms | |
| SPS | LPF: 3.23 ± 4.67 ms*** | LPF: −0.03 ± 7.00 ms*** |
| Spikes: −141.88 ± 6.21 ms*** | Spikes: −131.27 ± 5.27 ms*** | |
| Mean difference: −145.11 ± 7.96 ms | Mean difference: −131.24 ± 5.80 ms |
P ≤ 0.001.
Statistics.
To check whether two independent distributions were significantly different from each other, we first performed a two-sided Lilliefors test to test for normality, then used an appropriate t test, or else a nonparametric Wilcoxon rank sum test. All values in this study, unless stated otherwise, are mean ± SEM.
Task Relevant Neurons and LFP Sites.
We regarded a neuron as visually responsive only if the neuron showed visual stimulus triggered activity (50 ms to 150 ms poststimulus presentation), which was significantly different from the baseline activity (−100 ms to 0 ms from stimulus presentation) (P < 0.05 Wilcoxon rank sum test). We regarded a neuron as saccade responsive only if its saccade triggered activity (−200 to 100 ms from saccade onset) was significantly different from the baseline (P < 0.05 Wilcoxon rank sum test). We performed the same analysis for the LFP waveform to identify task related LFP signals. We only used task relevant neurons and LFP sites for all further analyses. Hence, although we recorded a total of 97 cells/LFP signals from both monkeys, we could use 66 of them for further analyses.
Response Field.
Traditionally the response field or the receptive field of a neuron is defined as the spatial location eliciting robust spiking activity. Because many FEF neurons have both visual and movement activity, we characterized each neuron with two response fields (RFs): a visual RF (vRF) and a movement RF (mRF). To identify the vRF and the mRF, we measured the visual activity (VA) and movement activity (MA) of each neuron in each of the eight spatial positions. We then constructed a normalized polar plot and fitted a circular von Mises distribution function (43) for the VA and MA independently using the equation: f(x) = a.exp[b[cos(2(x − θ)) −1]], where the parameter θ is the preferred orientation, a determines the maximum, and b determines the width of the tuning curve. We used this curve fitting to further validate the identification of RFs and to quantify tuning properties.
Visual Response Latency.
We defined the VRL as the first time point when the signal significantly differed from the baseline (P < 0.05) continuously for at least the next 20 ms. To calculate the VRL, we performed a t test between the average baseline value and the signal from −100 ms to 350 ms from the stimulus presentation. This calculation gave a P value for every millisecond of the data indicating the probability, defending the null hypothesis that the signal did not significantly differ from the baseline. Hence, the first time point when the P value fell below 0.05 and remained below 0.05 continuously for the next 20 ms was the point when the null hypothesis failed and the signal differed significantly different from the baseline. Hence, we considered this point to be the VRL.
Saccade Plan Onset Time.
We defined the SPO time as the first time point when the signal significantly differed from the baseline (P < 0.05) continuously for at least the next 20 ms. In this study, we used the saccade plan onset time to find the time when the LFP or spike waveform started to show a decrease or increase in activity before saccade, respectively. To calculate SPO, we performed a t test between the average baseline value and the signal from −400 ms to 200 ms from the start of saccade and followed the same steps as mentioned above.
Saccade Plan Specification Time.
We defined the SPS time as the first time point when the signals in at least one of the eight positions significantly differed from each other. In this study, we used SPS time to find the time when the LFP or spike waveform significantly differed between the eight spatial positions in the saccade epoch. To calculate SPS, we computed a p-ANOVA (analysis of variance) between the signals across the eight spatial positions for every millisecond of the data from −400 ms to 200 ms from saccade onset and followed the same steps as mentioned above.
Spectrum and Spectrogram.
We primarily performed all LFP analyses by using the Chronux 2.0 toolbox (44) available at chronux.org as an open source. LFP spectra were computed by using mtspectrumc and spectrograms were constructed by using mtspecgramc functions in Chronux using the multitaper algorithm (45). We used five tapers for each analysis and a window length of 300 ms with step size 30 ms to calculate the spectrogram. Spectrograms calculated in this way were normalized by subtracting the log of each value with the log of the baseline power spectrum, in the respective frequency ranges, to get the change in power for each frequency component with respect to time. The spectrogram was constructed for the same signal in two ways: once aligned to stimulus onset and then aligned to saccade onset, for all eight spatial positions where the stimulus appeared. The frequency range from 13 to 30 Hz was taken as the beta band and the frequency range from 30 to 70 Hz was taken as the gamma band for all further analyses.
Discussion
By comparing the time course and frequency components of the LFP relative to spiking activity of FEF neurons, we report two main findings. First, the LFP showed visually evoked responses significantly earlier than the spikes (Fig. S1), but the spikes had information about the planned saccade (Fig. 3) and its direction (Fig. 4) significantly earlier than the LFP (Fig. 5). Second, gamma activity showed elevated activity with spatial selectivity in the delay epoch, after the visual stimulus presentation and well before the saccade epoch, with a tuning more similar to the neural saccadic tuning than the visual tuning. Gamma activity also predicted the RT, suggesting that it represents an important aspect of the local computation that represents the visuomotor transformation occurring within FEF (Fig. 7). In contrast, beta activity showed a nondirectionally selective suppression in activity just before saccade initiation (Fig. 8). Here, we discuss some important implications of our results.
Input Characteristics of FEF.
The VRL that we report is in agreement with the previously reported values by other groups (ref. 1; LFP, early: 51.7 ± 0.5 ms, late: 61.5 ± 0.8 ms; spike, early: 65.0 ± 3.3 ms, late: 79.0 ± 2.9 ms. Ref. 28; LFP: 56.5 ms and spike: 68.5 ms). We report a VRL of 58.9 ± 1.65 ms in LFP and 78.43 ± 1.16 ms in spikes (Table S1), which suggests that the LFP has information regarding the location of the visual stimulus significantly earlier than the spikes in FEF, supporting previous studies (1, 28).
The Role of FEF in Saccade Planning.
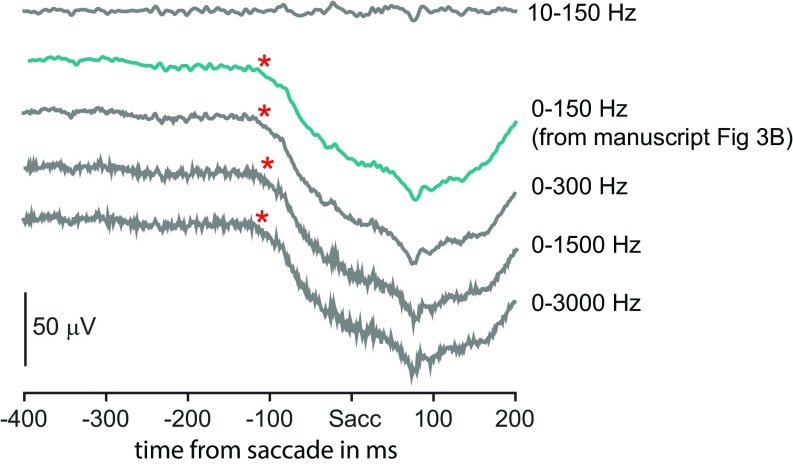
In this study, we show that although the LFP in FEF had an earlier visually evoked response in the saccade epoch, the spiking activity of FEF neurons possessed information about the planning of saccade and its direction earlier than the LFP by ∼130 ms for SPO and ∼145 ms for SPS across the two monkeys (Table S1). This reported relationship between LFP and spikes was not affected by the potential effects due to LFP or spike filtering (SI Materials and Methods and Fig. S4). Interestingly, saccade selectivity in LFP developed within a temporally narrow epoch, very close to the saccade execution time. Hence, if we interpret LFP selectivity to represent input and spiking selectivity to represent output, we infer that FEF generates saccade plans internally and may represent the first step where the critical visuomotor transformation occurs. We report markers for two phases of saccadic computation: SPO time, when the global plan for a saccade is initiated, and SPS time, when the direction of the saccade being planned is selected. We further showed that the relationship between spikes and LFP was similar in both these phases of computation.
Fig. S4.
Timings were not affected by the LFP filtering effects. The average raw LFP signal filtered between 0 and 150 Hz, aligned to saccade onset (taken from Fig. 3B) is shown in green. The raw LFP signal in the same epoch, filtered with several different ranges, are shown in gray. SPOLFP is shown as a red asterisk.
In this context, it is interesting to note that prior studies have shown that the lateral intraparietal area (LIP), which provides prominent input to FEF and also possess cells with visuomotor properties, shows the converse relation between LFP and spiking activity, where LFP has earlier and more robust information regarding the planning and execution of saccades than the spikes (21). These evidences taken together suggest that saccade plans are generated in FEF internally and relayed to LIP through their reciprocal feedback connections. These results are consistent with the notion that LIP is primarily a visual area playing an active role in visual selection but a more passive role in the visuomotor transformation process. Consistent with this interpretation, saccade countermanding or active online cancellation of saccades is readily observed in the activity of movement-related cells in the FEF but not in LIP (29).
If the SPSSPK time represents an intrinsic visuomotor transformation occurring within FEF, then what does the ensuing SPSLFP reflect? Because electrical stimulation of FEF requires at least 30–45 ms to elicit a saccade (30), one can assume that a signal, in FEF, showing a SPO or SPS less than 30–45 ms before saccade might not play a potential role in saccade generation. In this study, we report a SPOLFP of −84.4 ± 5.6 ms and a SPSLFP of 3.2 ± 4.7 ms relative to saccade onset, supporting our argument that the LFP in FEF might not be contributing to saccade preparation per se. However, it is known that FEF receives a saccade-related input from medial dorsal nucleus ∼96 ms before a saccade, which is thought to be a corollary discharge of the impending saccade plan from the superior colliculus (31, 32). A consequence of this corollary discharge is the shift of RF by FEF neurons before the onset of a saccade. FEF neurons shift their RF in a range from 100 ms before to 200 ms after the saccade initiation, with the average being ∼24 ms after saccade initiation (32). Thus, conforming to the idea that LFP might represent the synaptic input, one might expect LFP in the saccade epoch to represent this input information. The values we report for LFP in this study are in agreement with those results. More interestingly, we find a narrow range of SPOLFP and SPSLFP range that were not correlated with the spike counterparts, suggesting different origins of these two signals. Thus, our data raise the intriguing hypothesis that aspects of LFP might reflect this corollary discharge that FEF receives just before a saccade.
Gamma Band Activity Reflects the Visuomotor Transformation.
Previous studies in LIP have shown that in the delay epoch, a spatially tuned elevation in activity in the gamma band (30–70 Hz) might contribute to the maintenance of “memory fields,” which are important in working memory (21), whereas other studies have suggested that gamma activity could be involved in the sensory-motor integration process (23, 24). Our results indicate that these two roles might not be mutually exclusive. The gamma activity raised in power in a time frame that was much later than the initial visual response period in sensory-motor regions including FEF (33) and LIP (21) but also much earlier than the saccade epoch and, therefore, may represent an important intermediate step of visual selection that precedes saccades.
Visual selection is an important component of the visuomotor transformation process, necessary for planning of relevant saccades. It is also considered as the link between perceptual processes and action or execution (34). Monosov et al. showed that FEF neurons have visual selection times (105–133 ms) significantly earlier than the LFP (134–152 ms) and that the FEF neurons were the functionally active units that performed this computation from their visual input (LFP) from other brain regions. Hence, the later selection time noted in the LFP could be a reflection of local computation in FEF. Because we used a memory-guided saccade task in our study, it did not involve classical target selection due to the absence of distractors. Nevertheless, the time of gamma increase we report might be a signature of this covert visual attention process and goal selection for the upcoming saccade.
Whereas the spatial selectivity of gamma activity during the delay period (23, 24) implies a role in working memory of stimulus location, it is typically thought to reflect sensory memory, and like visual selection, is not expected to be correlated with RT (36). However, consistent with previous work, we showed that gamma activity, but not the corresponding spiking activity, was correlated with RT (23, 24). Additionally, the gamma activity in the delay epoch was more closely tuned to the saccadic tuning than the visual tuning of the cell. These results suggest that gamma oscillations may reflect intracortical processing within FEF that aids in transformation of sensory information into a saccade plan.
Beta Activity Represents Undifferentiated Neural Activity.
Beta suppression has been considered as an “undifferentiated reflection of neural activity” (26) because the amplitude of suppression is not clearly modulated by motor parameters like direction (36), speed (26), or duration (37). However, in oculomotor regions, it gets modulated in an epoch close to the initiation of the saccade but the modulation characteristics itself might differ between different cortical regions, from being a spatially invariant suppression of activity in regions like LIP before a saccade (21, 38) or a spatially selective elevation of activity in regions like the posterior parietal cortex before a coordinated reach and saccade (39). We investigated beta modulation in the FEF and characterized the properties of beta band activity in the visual, delay, and the saccadic epochs to check for any functional significance during the visuomotor transformation process.
In contrast to gamma activity, beta band activity was not spatially tuned and showed a suppression in activity close to saccade onset but did not correlate with RT. Because the beta band activity represented a gradual suppression in power, starting before the eye movement and was just not a transient phenomenon revealed solely at the time of saccade execution, we believe that it is unlikely to reflect an EOG signal artifact. Additionally, beta band power started to differ from baseline at a time point later than the saccade specification time of FEF and is therefore unlikely to reflect a direct role in saccade specification, similar to what has been shown in LIP (21, 38). Recent evidence however suggests that beta activity might be a reflection of motor preparation (40) and may be involved in other aspects of motor preparation such as eye-hand coordination (39) or a corollary discharge signal.
Materials and Methods
Two adult monkeys, J (male, Macaca radiata) and G (female, Macaca mullata) were used for the experiments. They were cared for in accordance with the Committee for the Purpose of Control and Supervision of Experiments of Animals, Government of India. Full details on the task design, physiology, and analysis can be found in the SI Materials and Methods.
Acknowledgments
We thank Dr. Supratim Ray, Vinay Shihatti, and Dr. Sumitash Jana for their initial help with data analyses. This work was supported by an Intensification of Research in High Priority Areas Grant from the Department of Science and Technology, Government of India; a Department of Biotechnology - Indian Institute of Science (DBT-IISc) partnership programme grant; and institutional support from the Ministry of Human Resource Development. N.S. was supported by Kishore Vaigyanik Protsahan Yojana Scholarship awarded by Department of Science and Technology, Government of India. We also thank Prof. Michael E. Goldberg (Columbia University) for intellectual inputs and financial support by National Eye Institute/National Institutes of Health (NIE/NIH) Grants 1 R01 EY017039-02 and 1P30 EY019007-01; the Mahoney Chair in Brain and Behavior Research of Columbia University; and Environmental Memory (a grant from the Zegar family foundation to N.S.) to present these findings in the Society For Neuroscience meeting, 2016 at San Diego.
Footnotes
The authors declare no conflict of interest.
This article is a PNAS Direct Submission.
This article contains supporting information online at www.pnas.org/lookup/suppl/doi:10.1073/pnas.1703809114/-/DCSupplemental.
References
- 1.Monosov IE, Trageser JC, Thompson KG. Measurements of simultaneously recorded spiking activity and local field potentials suggest that spatial selection emerges in the frontal eye field. Neuron. 2008;57:614–625. doi: 10.1016/j.neuron.2007.12.030. [DOI] [PMC free article] [PubMed] [Google Scholar]
- 2.Thompson KG, Biscoe KL, Sato TR. Neuronal basis of covert spatial attention in the frontal eye field. J Neurosci. 2005;25:9479–9487. doi: 10.1523/JNEUROSCI.0741-05.2005. [DOI] [PMC free article] [PubMed] [Google Scholar]
- 3.Bushnell MC, Goldberg ME, Robinson DL. Behavioral enhancement of visual responses in monkey cerebral cortex. I. Modulation in posterior parietal cortex related to selective visual attention. J Neurophysiol. 1981;46:755–772. doi: 10.1152/jn.1981.46.4.755. [DOI] [PubMed] [Google Scholar]
- 4.Bruce CJ, Goldberg ME. Primate frontal eye fields. I. Single neurons discharging before saccades. J Neurophysiol. 1985;53:603–635. doi: 10.1152/jn.1985.53.3.603. [DOI] [PubMed] [Google Scholar]
- 5.Purcell BA, Schall JD, Woodman GF. On the origin of event-related potentials indexing covert attentional selection during visual search: Timing of selection by macaque frontal eye field and event-related potentials during pop-out search. J Neurophysiol. 2013;109:557–569. doi: 10.1152/jn.00549.2012. [DOI] [PMC free article] [PubMed] [Google Scholar]
- 6.Schall JD. Neuronal activity related to visually guided saccades in the frontal eye fields of rhesus monkeys: Comparison with supplementary eye fields. J Neurophysiol. 1991;66:559–579. doi: 10.1152/jn.1991.66.2.559. [DOI] [PubMed] [Google Scholar]
- 7.Duhamel JR, Colby CL, Goldberg ME. The updating of the representation of visual space in parietal cortex by intended eye movements. Science. 1992;255:90–92. doi: 10.1126/science.1553535. [DOI] [PubMed] [Google Scholar]
- 8.Schall JD. Neuronal activity related to visually guided saccadic eye movements in the supplementary motor area of rhesus monkeys. J Neurophysiol. 1991;66:530–558. doi: 10.1152/jn.1991.66.2.530. [DOI] [PubMed] [Google Scholar]
- 9.Wurtz RH, Goldberg ME. Activity of superior colliculus in behaving monkey. 3. Cells discharging before eye movements. J Neurophysiol. 1972;35:575–586. doi: 10.1152/jn.1972.35.4.575. [DOI] [PubMed] [Google Scholar]
- 10.Kim J-N, Shadlen MN. Neural correlates of a decision in the dorsolateral prefrontal cortex of the macaque. Nat Neurosci. 1999;2:176–185. doi: 10.1038/5739. [DOI] [PubMed] [Google Scholar]
- 11.Mitzdorf U. Current source-density method and application in cat cerebral cortex: Investigation of evoked potentials and EEG phenomena. Physiol Rev. 1985;65:37–100. doi: 10.1152/physrev.1985.65.1.37. [DOI] [PubMed] [Google Scholar]
- 12.Chen C-M, et al. Functional anatomy and interaction of fast and slow visual pathways in macaque monkeys. Cereb Cortex. 2007;17:1561–1569. doi: 10.1093/cercor/bhl067. [DOI] [PubMed] [Google Scholar]
- 13.Buzsáki G, Anastassiou CA, Koch C. The origin of extracellular fields and currents–EEG, ECoG, LFP and spikes. Nat Rev Neurosci. 2012;13:407–420. doi: 10.1038/nrn3241. [DOI] [PMC free article] [PubMed] [Google Scholar]
- 14.Buzsaki G. Rhythms of the Brain. Oxford Univ Press; Oxford: 2006. [Google Scholar]
- 15.Khawaja FA, Tsui JMG, Pack CC. Pattern motion selectivity of spiking outputs and local field potentials in macaque visual cortex. J Neurosci. 2009;29:13702–13709. doi: 10.1523/JNEUROSCI.2844-09.2009. [DOI] [PMC free article] [PubMed] [Google Scholar]
- 16.Cohen JY, Heitz RP, Schall JD, Woodman GF. On the origin of event-related potentials indexing covert attentional selection during visual search. J Neurophysiol. 2009;102:2375–2386. doi: 10.1152/jn.00680.2009. [DOI] [PMC free article] [PubMed] [Google Scholar]
- 17.Fries P, Reynolds JH, Rorie AE, Desimone R. Modulation of oscillatory neuronal synchronization by selective visual attention. Science. 2001;291:1560–1563. doi: 10.1126/science.1055465. [DOI] [PubMed] [Google Scholar]
- 18.Womelsdorf T, et al. Modulation of neuronal interactions through neuronal synchronization. Science. 2007;316:1609–1612. doi: 10.1126/science.1139597. [DOI] [PubMed] [Google Scholar]
- 19.Gregoriou GG, Gotts SJ, Zhou H, Desimone R. High-frequency, long-range coupling between prefrontal and visual cortex during attention. Science. 2009;324:1207–1210. doi: 10.1126/science.1171402. [DOI] [PMC free article] [PubMed] [Google Scholar]
- 20.Melloni L, et al. Synchronization of neural activity across cortical areas correlates with conscious perception. J Neurosci. 2007;27:2858–2865. doi: 10.1523/JNEUROSCI.4623-06.2007. [DOI] [PMC free article] [PubMed] [Google Scholar]
- 21.Pesaran B, Pezaris JS, Sahani M, Mitra PP, Andersen RA. Temporal structure in neuronal activity during working memory in macaque parietal cortex. Nat Neurosci. 2002;5:805–811. doi: 10.1038/nn890. [DOI] [PubMed] [Google Scholar]
- 22.Lundqvist M, et al. Gamma and beta bursts underlie working memory. Neuron. 2016;90:152–164. doi: 10.1016/j.neuron.2016.02.028. [DOI] [PMC free article] [PubMed] [Google Scholar]
- 23.Fründ I, Busch NA, Schadow J, Körner U, Herrmann CS. From perception to action: Phase-locked gamma oscillations correlate with reaction times in a speeded response task. BMC Neurosci. 2007;8:27. doi: 10.1186/1471-2202-8-27. [DOI] [PMC free article] [PubMed] [Google Scholar]
- 24.Ghuman AS, et al. Dynamic encoding of face information in the human fusiform gyrus. Nat Commun. 2014;5:5672. doi: 10.1038/ncomms6672. [DOI] [PMC free article] [PubMed] [Google Scholar]
- 25.Jasper H, Penfield W. Electrocorticograms in man: Effect of voluntary movement upon the electrical activity of the precentral gyrus. Arch Psychiatr Nervenkr. 1949;183:163–174. [Google Scholar]
- 26.Stancák A, Jr, Pfurtscheller G. Event-related desynchronisation of central beta-rhythms during brisk and slow self-paced finger movements of dominant and nondominant hand. Brain Res Cogn Brain Res. 1996;4:171–183. doi: 10.1016/s0926-6410(96)00031-6. [DOI] [PubMed] [Google Scholar]
- 27.Sochůrková D, Rektor I, Jurák P, Stancák A. Intracerebral recording of cortical activity related to self-paced voluntary movements: A Bereitschaftspotential and event-related desynchronization/synchronization. SEEG study. Exp Brain Res. 2006;173:637–649. doi: 10.1007/s00221-006-0407-9. [DOI] [PubMed] [Google Scholar]
- 28.Purcell BA, Heitz RP, Cohen JY, Schall JD. Response variability of frontal eye field neurons modulates with sensory input and saccade preparation but not visual search salience. J Neurophysiol. 2012;108:2737–2750. doi: 10.1152/jn.00613.2012. [DOI] [PMC free article] [PubMed] [Google Scholar]
- 29.Paré M, Dorris MC. 2011. The role of posterior parietal cortex in the regulation of saccadic eye movements. The Oxford Handbook of Eye Movements, 257–278.
- 30.Bruce CJ, Goldberg ME, Bushnell MC, Stanton GB. Primate frontal eye fields. II. Physiological and anatomical correlates of electrically evoked eye movements. J Neurophysiol. 1985;54:714–734. doi: 10.1152/jn.1985.54.3.714. [DOI] [PubMed] [Google Scholar]
- 31.Sommer MA, Wurtz RH. What the brain stem tells the frontal cortex. I. Oculomotor signals sent from superior colliculus to frontal eye field via mediodorsal thalamus. J Neurophysiol. 2004;91:1381–1402. doi: 10.1152/jn.00738.2003. [DOI] [PubMed] [Google Scholar]
- 32.Sommer MA, Wurtz RH. Brain circuits for the internal monitoring of movements. Annu Rev Neurosci. 2008;31:317–338. doi: 10.1146/annurev.neuro.31.060407.125627. [DOI] [PMC free article] [PubMed] [Google Scholar]
- 33.Gregoriou GG, Gotts SJ, Desimone R. Cell-type-specific synchronization of neural activity in FEF with V4 during attention. Neuron. 2012;73:581–594. doi: 10.1016/j.neuron.2011.12.019. [DOI] [PMC free article] [PubMed] [Google Scholar]
- 34.Serences JT, Yantis S. Selective visual attention and perceptual coherence. Trends Cogn Sci. 2006;10:38–45. doi: 10.1016/j.tics.2005.11.008. [DOI] [PubMed] [Google Scholar]
- 35.Thompson KG, Bichot NP, Schall JD. Dissociation of visual discrimination from saccade programming in macaque frontal eye field. J Neurophysiol. 1997;77:1046–1050. doi: 10.1152/jn.1997.77.2.1046. [DOI] [PubMed] [Google Scholar]
- 36.Waldert S, et al. Hand movement direction decoded from MEG and EEG. J Neurosci. 2008;28:1000–1008. doi: 10.1523/JNEUROSCI.5171-07.2008. [DOI] [PMC free article] [PubMed] [Google Scholar]
- 37.Cassim F, et al. Brief and sustained movements: Differences in event-related (de)synchronization (ERD/ERS) patterns. Clin Neurophysiol. 2000;111:2032–2039. doi: 10.1016/s1388-2457(00)00455-7. [DOI] [PubMed] [Google Scholar]
- 38.Chen M, Wei L, Liu Y. Motor preparation attenuates neural variability and beta-band LFP in parietal cortex. Sci Rep. 2014;4:6809. doi: 10.1038/srep06809. [DOI] [PMC free article] [PubMed] [Google Scholar]
- 39.Dean HL, Hagan MA, Pesaran B. Only coherent spiking in posterior parietal cortex coordinates looking and reaching. Neuron. 2012;73:829–841. doi: 10.1016/j.neuron.2011.12.035. [DOI] [PMC free article] [PubMed] [Google Scholar]
- 40.Tzagarakis C, Ince NF, Leuthold AC, Pellizzer G. Beta-band activity during motor planning reflects response uncertainty. J Neurosci. 2010;30:11270–11277. doi: 10.1523/JNEUROSCI.6026-09.2010. [DOI] [PMC free article] [PubMed] [Google Scholar]
- 41.van der Meer MAA, Redish AD. Theta phase precession in rat ventral striatum links place and reward information. J Neurosci. 2011;31:2843–2854. doi: 10.1523/JNEUROSCI.4869-10.2011. [DOI] [PMC free article] [PubMed] [Google Scholar]
- 42.Terada S, Takahashi S. Oscillatory interaction between amygdala and hippocampus coordinates behavioral modulation based on reward expectation. Front Behav Neurosci. 2013;7:177. doi: 10.3389/fnbeh.2013.00177. [DOI] [PMC free article] [PubMed] [Google Scholar]
- 43.Fisher NI. Statistical Analysis of Circular Data. Cambridge Univ Press; Cambridge, UK: 1995. [Google Scholar]
- 44.Bokil H, Andrews P, Kulkarni JE, Mehta S, Mitra PP. Chronux: A platform for analyzing neural signals. J Neurosci Methods. 2010;192:146–151. doi: 10.1016/j.jneumeth.2010.06.020. [DOI] [PMC free article] [PubMed] [Google Scholar]
- 45.Thomson DJ. Spectrum Estimation and Harmonic Analysis. Proc IEEE. 1982;70:1055–1096. [Google Scholar]


