Significance
Muscle glycogen fuels exercising muscles to sustain endurance capacity. The brain also stores glycogen in astrocytes to produce lactate as an energy source transported to active neurons via the monocarboxylate transporter MCT2. Although physical exercise activates brain neurons and increases their energy demand, the energetic role of astrocytic glycogen in the exercising brain remains unknown. To address this issue, we used a rat model of prolonged exhaustive exercise, microwave irradiation of brains, metabolomics, and intracerebroventricular injection of inhibitors of glycogenolysis and MCT2. Our findings provide direct evidence that lactate derived from astrocytic glycogen fuels the prolonged-exercising brain to maintain endurance capacity. This new perspective on brain energetics during endurance exercise could lead to better strategies for endurance performance.
Keywords: brain glycogen, lactate transport, ATP, endurance capacity, metabolomics
Abstract
Brain glycogen stored in astrocytes provides lactate as an energy source to neurons through monocarboxylate transporters (MCTs) to maintain neuronal functions such as hippocampus-regulated memory formation. Although prolonged exhaustive exercise decreases brain glycogen, the role of this decrease and lactate transport in the exercising brain remains less clear. Because muscle glycogen fuels exercising muscles, we hypothesized that astrocytic glycogen plays an energetic role in the prolonged-exercising brain to maintain endurance capacity through lactate transport. To test this hypothesis, we used a rat model of exhaustive exercise and capillary electrophoresis-mass spectrometry–based metabolomics to observe comprehensive energetics of the brain (cortex and hippocampus) and muscle (plantaris). At exhaustion, muscle glycogen was depleted but brain glycogen was only decreased. The levels of MCT2, which takes up lactate in neurons, increased in the brain, as did muscle MCTs. Metabolomics revealed that brain, but not muscle, ATP was maintained with lactate and other glycogenolytic/glycolytic sources. Intracerebroventricular injection of the glycogen phosphorylase inhibitor 1,4-dideoxy-1,4-imino-d-arabinitol did not affect peripheral glycemic conditions but suppressed brain lactate production and decreased hippocampal ATP levels at exhaustion. An MCT2 inhibitor, α-cyano-4-hydroxy-cinnamate, triggered a similar response that resulted in lower endurance capacity. These findings provide direct evidence for the energetic role of astrocytic glycogen-derived lactate in the exhaustive-exercising brain, implicating the significance of brain glycogen level in endurance capacity. Glycogen-maintained ATP in the brain is a possible defense mechanism for neurons in the exhausted brain.
Glucose derived from blood is the primary energy source for generating ATP in the brain, but an important energy reserve is brain glycogen synthesized from glucose in astrocytes (1). Astrocytic glycogen is broken down through glycogenolysis/glycolysis to produce lactate as a neuronal energy substrate transported by monocarboxylate transporters (MCTs) (2). Indeed, brain glycogen decreases during memory tasks (3) and in some physiologically exhaustive conditions such as sleep deprivation (4) and hypoglycemia (5). The genetic/pharmacologic inhibitions of glycogenolysis and/or lactate transport impair neuronal survival under severe hypoglycemia, as well as axon transmission and hippocampus-related memory formation (6–8). Therefore, astrocytic glycogen-derived lactate is a critical energy source for meeting brain energy demands for neuronal functions and/or survival.
Although less than for exercising muscles, physical exercise activates brain neurons and increases brain energy demand (9). Blood glucose and lactate contribute to brain energetics during moderate or intense exercise (10, 11). Muscle glycogen is an important energy for maintaining muscle contraction during endurance exercise (12), however, the role of brain glycogen during exercise remains uncertain. We have reported a decrease in brain glycogen in the cortex, hippocampus, hypothalamus, cerebellum, and brainstem during prolonged exhaustive exercise associated with lactate elevation (13, 14). Furthermore, prolonged, but not exhaustive, exercise increases levels of hippocampal MCT2 (15), which transports lactate to neurons as MCT1 does to exercising muscles (16). Although untested, it is thus postulated that the lactate derived from astrocytic glycogen plays a role in brain energetics to maintain endurance capacity during prolonged exercise, as is the case for memory formation in the hippocampus (6).
Notably, brain glycogen decreases, but is not fully depleted, under exhaustive conditions such as sleep deprivation (4) and hypoglycemia (5). We observed the same phenomenon in the exercise-exhausted rat brain (13, 14), whereas muscle glycogen was almost fully depleted with ATP reduction (17). In contrast, insulin-induced severe hypoglycemia elicits depletion of brain glycogen and reduces brain ATP, resulting in neuronal death in the hippocampus (18). Epileptic seizures also induce neuronal death caused by brain ATP decrease (19), and lead to hippocampal-related memory dysfunction (20). Further, lactate plays a neuroprotective role against excitotoxic and ischemic damage through ATP production (21, 22). We thus hypothesized that the astrocytic glycogen-derived lactate acts to maintain brain ATP levels during exhaustive exercise, thereby contributing to endurance capacity.
To test this hypothesis, we used a rat model of prolonged exhaustive exercise and high-power microwave irradiation for accurate detection of brain metabolism (10 kW) (4, 14). First, glycogen and MCT proteins were measured in the brain and skeletal muscles of exhausted rats to confirm the validity of exhaustion. Next, we used metabolomics by capillary electrophoresis-mass spectrometry (CE-MS) to characterize metabolic profiles associated with ATP synthesis (glycolysis, TCA cycle, and purine metabolism) in the brain (hippocampus and cortex) and plantaris muscle. Finally, we examined the inhibitory effects of brain glycogen phosphorylase and lactate transport via MCT2 on brain ATP and endurance capacity during exhaustive exercise.
Results
Prolonged Exhaustive Exercise Decreases Glycogen and Increases MCT2 Protein in the Brain.
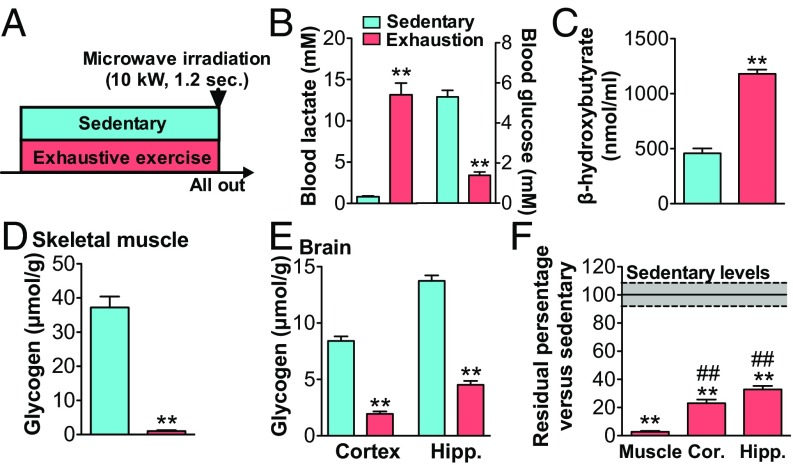
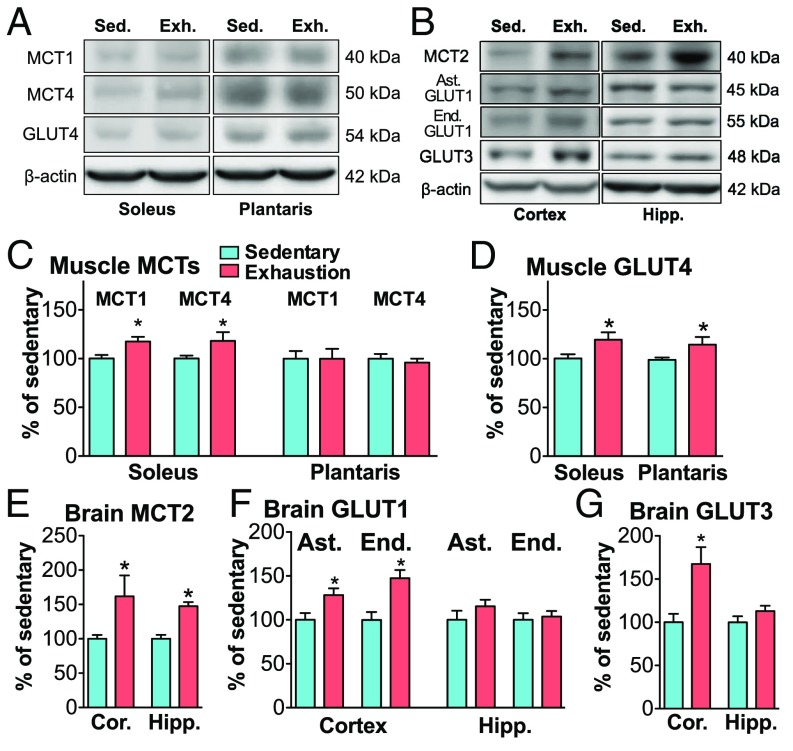
Rats were exercised on the treadmill until exhaustion (20 m/min; time to exhaustion 84.4 ± 2.9 min). Blood lactate was significantly increased and glucose levels were significantly decreased compared with the sedentary group (P < 0.01) (Fig. 1 A and B). Blood ketone body (β-hydroxybutyrate) levels increased (P < 0.01) (Fig. 1C). Exhaustive exercise also caused a depletion (decrease by 97.3%) of muscle glycogen levels (P < 0.01) (Fig. 1D). Brain glycogen levels in the cortex and hippocampus were decreased by 75.1 and 66.3%, respectively (P < 0.01) (Fig. 1E), but the depletion seen in skeletal muscle did not occur in the brain (Fig. 1F). Concomitantly, MCT2 protein levels in the cortex and hippocampus increased with exhaustive exercise (P < 0.05), similar to the increases in MCT proteins observed in skeletal muscle (Fig. 2 A–E). GLUT1 and 3 protein levels increased only in the cortex and GLUT4 increased in muscles (Fig. 2).
Fig. 1.
Prolonged exhaustive exercise completely depletes muscle glycogen but only decreases brain glycogen. (A) Experimental design for exhaustive prolonged exercise in rats. (B) Blood lactate and glucose. (C) Blood β-hydroxybutyrate. (D) Glycogen in the plantaris muscle. (E) Glycogen in the cortex (Cor.) and hippocampus (Hipp.). (F) Residual amount of glycogen in the muscle and brain. Data are expressed as mean ± SE (n = 5 per group). **P < 0.01 versus sedentary group; ##P < 0.01 versus muscle.
Fig. 2.
Exhaustive exercise increases MCT and GLUT protein in muscles and the brain. (A) Typical photos of Western blotting bands for MCT1, MCT4, GLUT4, and β-actin in muscles. Exh., exhaustion; Sed., sedentary. (B) Typical photos of Western blotting bands for MCT2, astrocytic (Ast.) GLUT1, endothelial (End.) GLUT1, GLUT3, and β-actin in the brain. (C) Muscle MCT protein. (D) Muscle GLUT4 protein. (E) Brain MCT2 protein in the cortex and hippocampus. (F) Brain GLUT1 protein. (G) Brain GLUT3 protein. Data are expressed as mean ± SE (n = 5 per group). *P < 0.05.
Lactate Increases in Prolonged Exercise-Exhausted Brains but Not in Muscle.
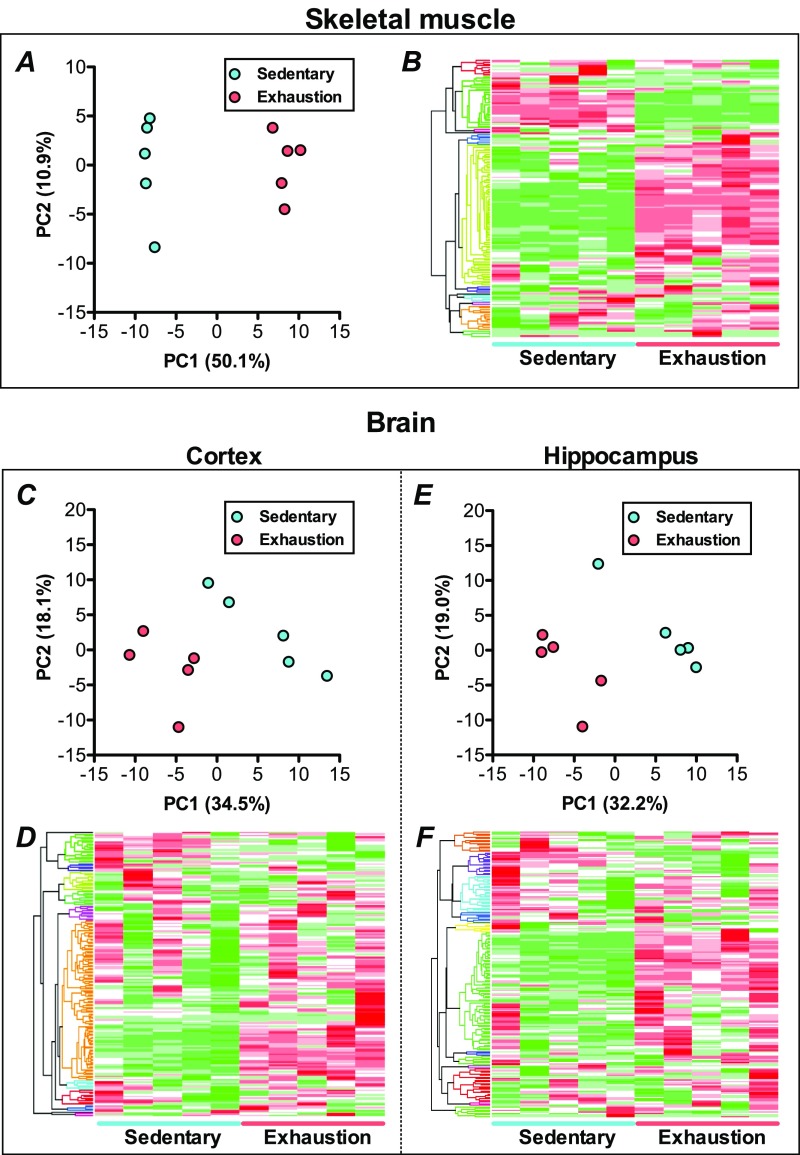
Metabolomics measured 159, 183, and 182 metabolites and revealed that 76, 79, and 72 metabolites were changed significantly in the plantaris muscle, cortex, and hippocampus, respectively, with exhaustive exercise. Principal component analysis and hierarchical cluster analysis clearly indicated the difference in metabolic profiles between sedentariness and exhaustion in all tissues (Fig. S1).
Fig. S1.
Changes in the metabolic profiles of muscle and the brain during exhaustive exercise. Principal component analysis of metabolomics in the plantaris muscle (A), cortex (C), and hippocampus (E). Hierarchical cluster analysis of metabolomics in the plantaris muscle (B), cortex (D), and hippocampus (F). Measured were 159, 183, and 182 metabolites, revealing that 76, 79, and 72 metabolites were changed significantly in the plantaris muscle, cortex, and hippocampus, respectively, with exhaustive exercise. PCA and HCA clearly indicated the difference of metabolic profiles between sedentariness and exhaustion in all tissues (Fig. 3).
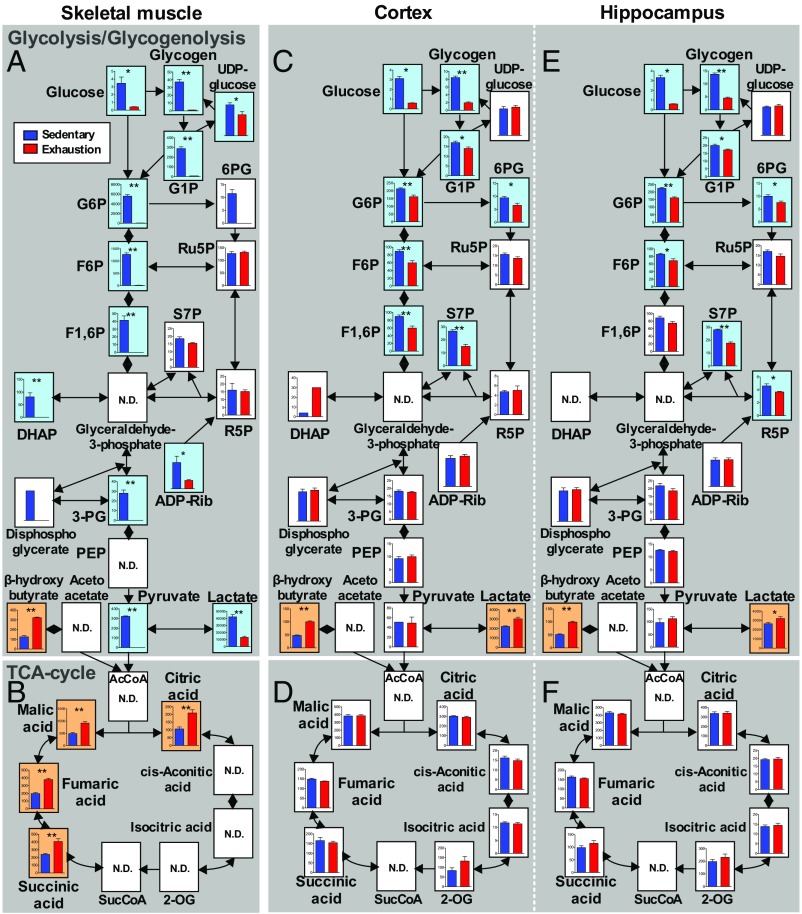
The glycolysis map of the plantaris muscle after exhaustive exercise showed depletion of glycogen and glucose and almost total depletion of glycolytic sources and lactate (P < 0.05) (Fig. 3A). However, TCA-cycle sources increased (P < 0.05) (Fig. 3B), suggesting the contribution of β-oxidation of lipids lacking in the brain. Maps of the cortex and hippocampus revealed a decrease in glycogen, glucose, and upstream glycolytic metabolites including fructose-1, 6-bisphosphate (F1-6P) (P < 0.05), but none of these metabolites were depleted. Downstream metabolites, such as F1-6P, together with TCA-cycle sources, were sustained and the lactate level was increased (P < 0.01) (Fig. 3 C–F).
Fig. 3.
Lactate increases in the brain but not in muscles during prolonged exhaustive exercise. Glycolytic pathways measured by metabolomics in the plantaris muscle (A), cortex (C), and hippocampus (E). TCA-cycle pathways in the plantaris muscle (B), cortex (D), and hippocampus (F). Glucose and glycogen results are inserted from results of glycogen assays. Data are expressed as mean ± SE (n = 5 per group). *P < 0.05, **P < 0.01 versus sedentary group (Student’s t test); N.D., not determined. Blue backgrounds indicate significantly decreased sources, and orange backgrounds imply significantly increased sources with exhaustive exercise. Graphs with a y axis show absolute detected amounts (nmol/g wet tissue), and graphs without a y axis show relative levels. The abbreviated metabolite names are defined in Table S1. The map of plantaris muscle after exhaustive exercise shows a depletion of glycogen and glucose and almost total depletions of glycolytic sources including lactate. Maps of the cortex and hippocampus revealed a decrease in glycogen and glucose and upstream glycolytic metabolites including F1-6P, but none of these metabolites were depleted. Downstream metabolites, such as 3-PG and pyruvate, together with TCA-cycle sources, were sustained and lactate was increased.
Table S1.
Metabolites
| Pathway map | Abbreviation | Compound name |
| Purine metabolism | ADP | Adenosine diphosphate |
| AMP | Adenosine monophosphate | |
| ATP | Adenosine triphosphate | |
| IMP | Inosine monophosphate | |
| Glycolysis/glycogenolysis | 3-PG | 3-Phosphoglyceric acid |
| 6-PG | 6-Phosphogluconic acid | |
| ADP-Rib | Adenosine diphosphate-ribose | |
| F1-6P | Fructose-1,6-diphosphate | |
| F6P | Fructose-6-phosphate | |
| G1P | Glucose-1-phosphate | |
| G6P | Glucose-6-phosphate | |
| PEP | Phosphoenolpyruvic acid | |
| R5P | Ribose-5-phosphate | |
| Ru5P | Ribulose-5-phosphate | |
| S7P | Sedoheptulose-7-phosphate | |
| TCA cycle | 2-OG | 2-Oxoglutaric acid |
| AcCoA | Acetyl-CoA | |
| SucCoA | Succinyl-CoA |
ATP Levels Are Maintained in Prolonged Exercise-Exhausted Brains but Not in Muscle.
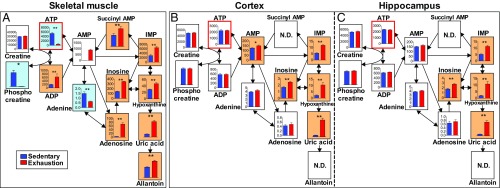
Metabolomics-produced purine/pyrimidine maps of the muscle and brain showed that ATP and phosphocreatine (PCr) decreased significantly in the exercise-exhausted group compared with the sedentary group (P < 0.05) (Fig. 4A) but that brain ATP and PCr levels were unchanged after exhaustive exercise (Fig. 4 B and C). Several downstream sources of purine metabolism, such as AMP, inosine, IMP, hypoxanthine, and uric acid, increased in both the muscle and brain of exercise-exhausted animals (P < 0.05) (Fig. 4). These data are direct evidence that ATP consumption is increased in both the brain and muscle but that only brain ATP levels are maintained during exhaustive exercise.
Fig. 4.
ATP is maintained in the brain but not in muscles during prolonged exhaustive exercise. Purine metabolism pathways measured by metabolomics in the plantaris muscle (A), cortex (B), and hippocampus (C). *P < 0.05, **P < 0.01 versus the sedentary group (Student’s t test). Blue backgrounds indicate significantly decreased sources, and orange backgrounds imply significantly increased sources following exhaustive exercise. Graphs with a y axis show absolute detected amounts (nmol/g wet tissue), and graphs without a y axis show relative levels. Data are expressed as mean ± SE (n = 5 per group). The abbreviated metabolite names are defined in Table S1. Muscle and brain maps show that ATP and PCr were decreased significantly in the exercise-exhausted group compared with the sedentary group (P < 0.05), but brain ATP and PCr were unchanged after exhaustive exercise. Several downstream sources of purine metabolism, such as AMP, inosine, IMP, hypoxanthine, and uric acid, were increased in both the muscle and brain of exercise-exhausted animals.
Blockade of Brain Glycogenolysis and MCT2 Decreases Brain ATP Levels.
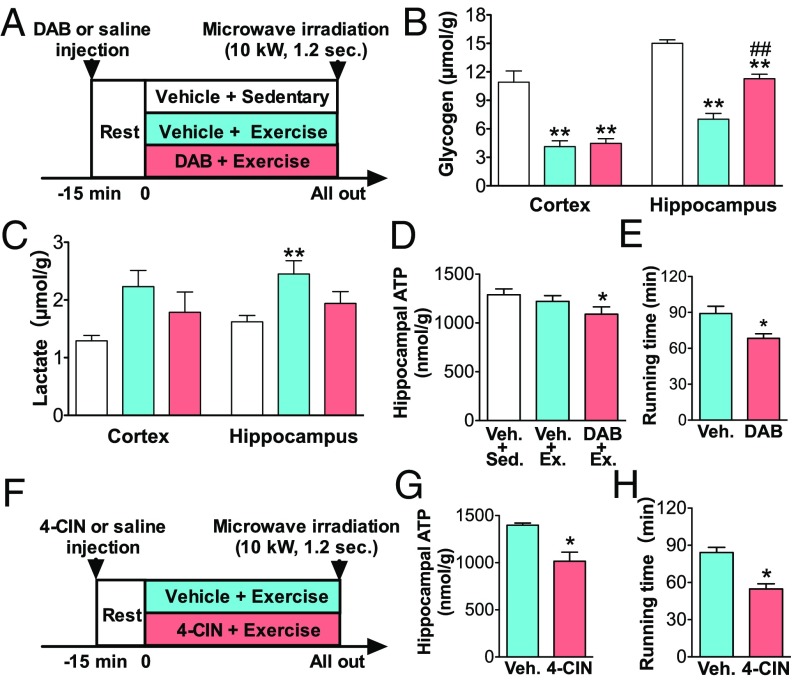
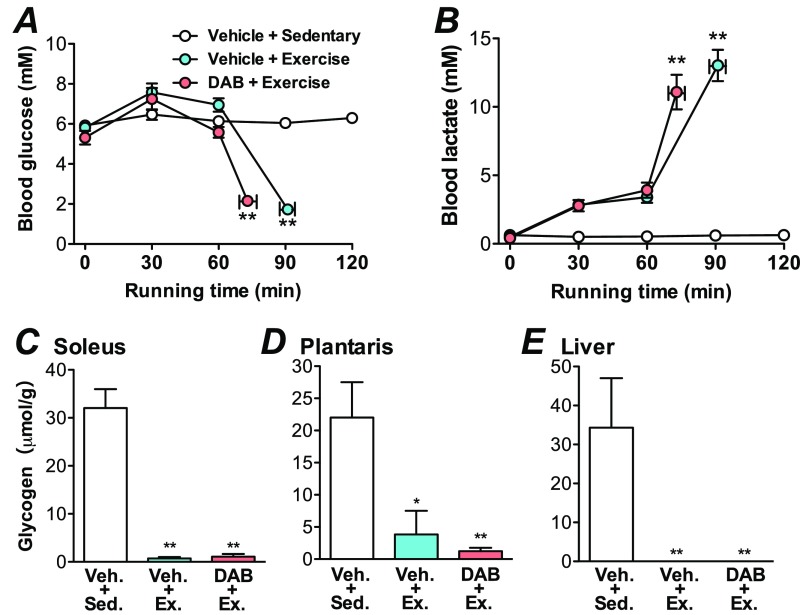
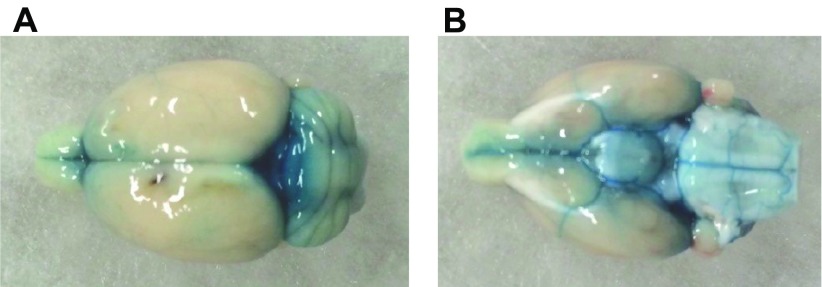
The intracerebroventricular (icv) injection of 1,4-dideoxy-1,4-imino-d-arabinitol (DAB) (Fig. 5A) did not affect peripheral glycemic conditions (Fig. S2). Concurrently, hippocampal glycogenolysis was inhibited, as well as in the hypothalamus, brainstem, and cerebellum (Fig. S3) but not in the cortex (Fig. 5B), likely due to the extent and pattern of DAB diffusion after icv injection (Fig. S4). Lactate production was significantly suppressed in the hippocampus (P < 0.05) but not in other brain regions (Fig. 5C and Fig. S3). DAB also decreased hippocampal ATP levels at exhaustion (P < 0.05) (Fig. 5D), and accelerated the onset of exhaustion by 20.6% compared with the vehicle group (P < 0.05) (Fig. 5E). Similar to DAB, the icv injection of α-cyano-4-hydroxy-cinnamate (4-CIN), an MCT2 inhibitor (7), decreased hippocampal ATP levels during prolonged exercise (P < 0.05) (Fig. 5 F and G) and accelerated the onset of exhaustion by 34.8% (P < 0.01) (Fig. 5H).
Fig. 5.
Blockade of brain glycogenolysis and MCT2 decreases endurance capacity associated with brain ATP. Data are expressed as mean ± SE (n = 5 to 7 per group). (A) Experimental design for exhaustive prolonged exercise with DAB icv injection in rats. (B and C) Glycogen (B) and lactate (C) in the cortex and hippocampus. **P < 0.01 versus vehicle (Veh.) + sedentary group; ##P < 0.01 versus Veh. + exercise (by one-way ANOVA with Tukey’s post hoc tests). (D) ATP in the hippocampus. (E) Running time to exhaustion with DAB icv injection. (F) Experimental design for exhaustive prolonged exercise with 4-CIN icv injection in rats. (G) ATP in the hippocampus. (H) Running time to exhaustion with 4-CIN icv injection. *P < 0.05 versus vehicle group (by Student’s t test).
Fig. S2.
Blockades of brain glycogenolysis and MCT2 do not affect blood glycemic conditions and peripheral glycogen immediately after exhaustive exercise. Data are expressed as mean ± SE (n = 5 to 7 per group). (A) Blood glucose. (B) Blood lactate. (C) Soleus muscle glycogen. (D) Plantaris muscle glycogen. (E) Liver glycogen. *P < 0.05, **P < 0.01 versus vehicle + sedentary group (one-way or two-way ANOVA with Tukey’s post hoc tests).
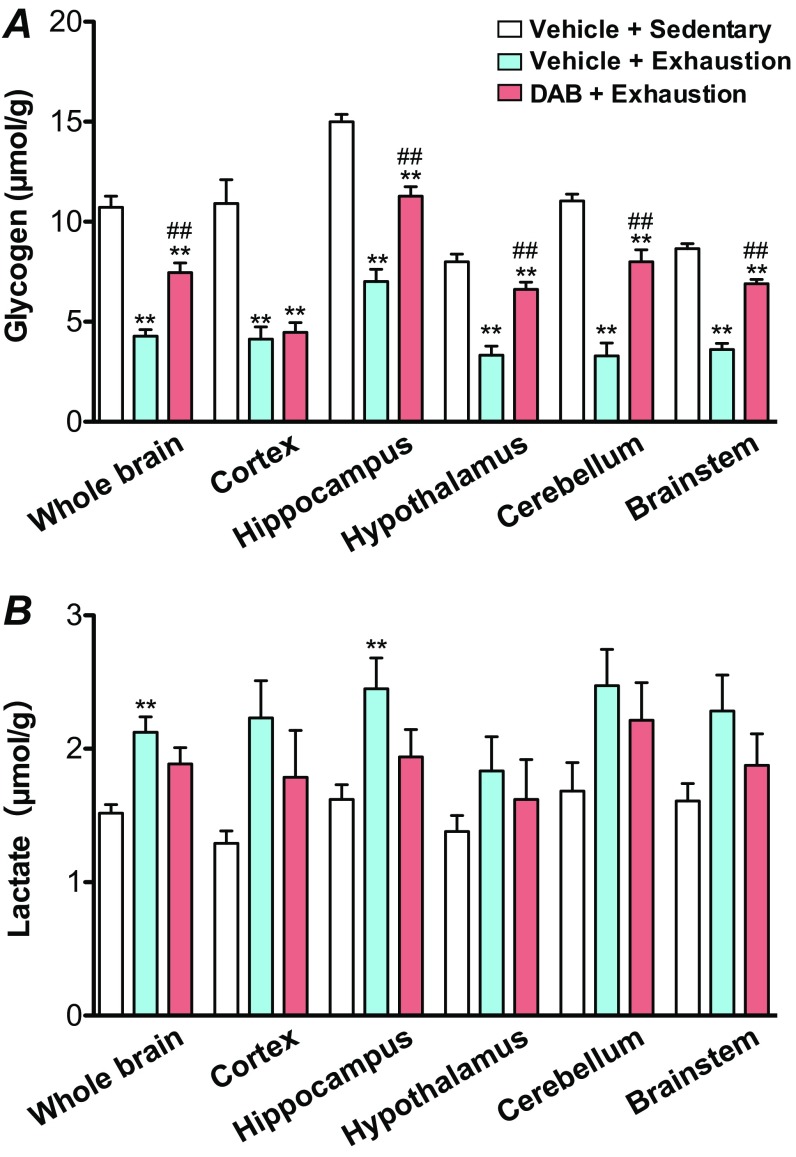
Fig. S3.
Effects of icv injection of DAB on brain glycogen and lactate. Data are expressed as mean ± SE (n = 5 to 7 per group). (A) Brain glycogen. (B) Brain lactate. The levels in whole brain were obtained by calculating the glycogen and lactate concentrations for all regions divided by the total weight of all regions. **P < 0.01 versus vehicle + sedentary group; ##P < 0.01 versus vehicle + exercise (one-way ANOVA with Tukey’s post hoc tests).
Fig. S4.
Diffusion of Chicago sky blue after icv injection. Rats were injected with 10 µL Chicago sky blue (1%) and euthanized 30 min after injection. (A) Dorsal whole brain. (B) Ventral whole brain.
Discussion
This study tests the hypothesis that astrocytic glycogen-derived lactate acts to maintain brain ATP levels during exhaustive exercise, thereby contributing to endurance capacity. Our metabolomics analysis in the exercise-exhausted rat model shows that brain ATP levels are maintained, along with increased MCT2 protein expression, lactate, and residual glycogen, during prolonged exhaustive exercise (Figs. 1–4). The hippocampus is a particularly sensitive brain region, particularly for memory (6, 7), and we also confirmed the decrease in hippocampal ATP by a targeted icv blockade of hippocampal glycogenolysis during exhaustive exercise (Fig. 5 A–E). Furthermore, targeted icv disruption of MCT2 also decreased hippocampal ATP and resulted in lowered endurance capacity (Fig. 5 F–H). These findings provide direct evidence that lactate derived from astrocytic glycogen plays an energetic role in the brain during prolonged exhaustive exercise. This mechanism contributes to endurance capacity and complements data showing that exhaustive exercise compromises working memory regulated by the hippocampus in humans (23).
Physiological Validity of the Rat Model for Exhaustive Exercise.
We confirmed hypoglycemia, hyperlactatemia, and muscle glycogen depletion in the rat model of exhaustive exercise used in the present study (Fig. 1 A–D). These are known fatigue factors established in rodents and humans (12–14, 24), confirming the development of exhaustion in our rat model.
Notably, ATP and PCr were significantly decreased in the exhausted plantaris muscle (Fig. 4). In general, muscle ATP levels are maintained during endurance exercise, and this represents a defense mechanism against muscle rigor and/or necrosis (25). However, short-duration (about a minute) exhaustive exercise induces declines in ATP and PCr levels of over 50 to 90% in type II (fast-twitch) fibers (26). The plantaris muscle consists of over 90% type II fibers (27). Thus, the decreases in ATP, PCr, and glycogen are due to the metabolic character of the plantaris muscle, indicating factors leading to the failure of muscle contraction (muscle fatigue) in type II fiber-enriched muscles.
Although muscle PCr decreased, free creatine did not increase (P = 0.10; Fig. 4A) and plasma free creatine did increase in exhausted rats (Table S2). Free creatine is a metabolite after dephosphorylation of PCr, and leaks from damaged muscles into the blood during hypodynamia of the heart muscle and during ultramarathons (28, 29). Plasma free creatine is also a biomarker of kidney function (glomerular filtration rate), which is lowered by protein waste (29). Thus, muscle-produced free creatine plasma levels increase due to the decline of glomerular filtration rate with protein wastes caused by muscle damage during exhaustive exercise.
Table S2.
Metabolic conditions after exhaustion followed by 6 h of recovery
| Tissues | Parameter | Sedentariness | Exhaustion | After 6 h of recovery |
| Blood | Glucose, mM | 4.3 ± 0.12 | 1.0 ± 0.13** | 4.1 ± 0.04 |
| Lactate, mM | 0.5 ± 0.03 | 9.3 ± 0.98** | 0.6 ± 0.05 | |
| Creatine, relative area | 0.13 ± 0.01 | 0.21 ± 0.02** | 0.13 ± 0.01 | |
| PCr, relative area | 0.00012 ± 0.00001 | 0.00053 ± 0.00010** | 0.00015 ± 0.00001 | |
| Muscle | ATP, nmol/g | 5369.6 ± 443.4 | 527.6 ± 284.1** | 5851.4 ± 180.5 |
| PCr, relative area | 0.089 ± 0.015 | 0.001 ± 0.001** | 0.122 ± 0.006 | |
| Creatine, relative area | 29529.2 ± 577.3 | 30781.4 ± 376.5* | 29761 ± 380.4 | |
| Glycogen, µmol/g | 37.2 ± 3.2 | 1.0 ± 0.2*** | 37.6 ± 1.7 |
Data are expressed as mean ± SE (n = 5 per group). *P < 0.05, **P < 0.01, ***P < 0.001 versus sedentary group.
We observed no muscle rigor or necrosis, and the decreased ATP, PCr, and glycogen recovered to basal levels after 6 h of rest (Table S2). Increased plasma free creatine returned to baseline after 6 h of rest (Table S2), whereas 5 d of rest are needed to recover after an ultramarathon (29). Therefore, our rat model of exhaustive exercise is milder than an ultramarathon, indicating its validity.
Energetic Role of Brain Glycogen During Exhaustive Exercise.
The reduction of brain ATP induces neuronal death (18, 19). However, we revealed with metabolomics that brain ATP, but not muscle ATP, levels are maintained with increased MCT2 protein expression, lactate, and residual glycogen during prolonged exhaustive exercise (Figs. 1–4). These findings indicate that the brain, rather than muscle, is protected energetically, likely to avoid neuronal death/dysfunction during exhaustive exercise, supporting the “selfish brain” theory regarding energy competition among organs (30).
A localized blockade of brain glycogen breakdown (glycogenolysis) inhibited the increases in hippocampal lactate, and decreased hippocampal ATP during exhaustive exercise (Fig. 5 A–D). A localized disruption of the MCT2 protein also disturbed the maintenance of hippocampal ATP (Fig. 5 F and G). These data indicate that glycogen-derived lactate transported by increased MCT2 is required for brain ATP maintenance during exhaustive exercise, at least in the hippocampus, which is direct evidence for the energetic importance of brain glycogen during endurance exercise. This evidence provides new insight into the strategies that promote/protect brain functions in animals relating to performance (e.g., endurance capacity and/or cognitive functions).
Astrocytic glycogen provides lactate to neurons but is also needed for ATP synthesis and/or K+ homeostasis in astrocytes during brain activation (31). Thus, glycogenolysis in the brain following exhaustive exercise could contribute to ATP synthesis and/or K+ homeostasis in astrocytes. However, blockade of brain glycogenolysis and of MCT2 had similar disrupting effects on hippocampal ATP levels during exhaustive exercise (Fig. 5G). Therefore, brain glycogen appears to function as a source of lactate for neurons in the exercising brain.
Other Possible Mechanisms of Brain ATP Maintenance.
Glutamate, a key excitatory neurotransmitter, increases protein levels of surface glucose transporter 3 (GLUT3) in neurons (32) and enhances glucose uptake and glycogen synthesis in cultured cortical astrocytes (33). In the present study, brain glutamate was maintained even during exhaustive exercise (Fig. S5). Further, GLUT3 and the astrocytic/endothelial glucose transporter (GLUT1) increased in the cortex, as also did GLUT4 in muscle (Fig. 2). Thus, glutamate may be involved in ATP maintenance by activation of glucose uptake via GLUTs and/or glycogen synthesis, particularly in the cortex.
Fig. S5.
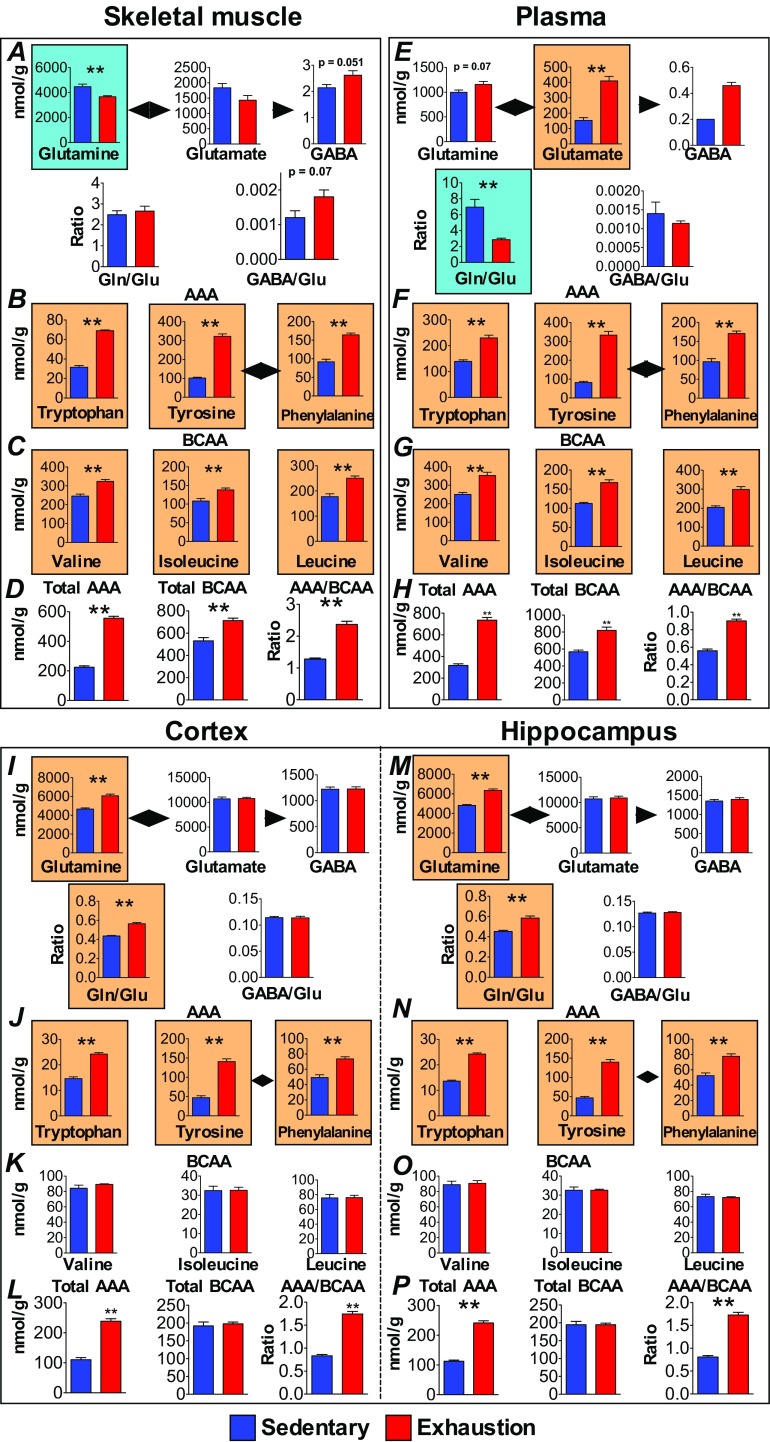
Metabolomics measurements of amino acids in the muscle, blood, and brain during exhaustive exercise. (A, E, I, and M) Glutamine, glutamate, GABA, and their ratios. (B, F, J, and N) Aromatic amino acids (AAAs). (C, G, K, and O) Branched-chain amino acids (BCAAs). (D, H, L, and P) Total AAAs and BCAAs, and ratios of AAA and BCAA levels. Data are expressed as mean ± SE (n = 5 per group). **P < 0.01 versus sedentary group (Student’s t test). Orange backgrounds indicate significantly increased sources following exhaustive exercise.
Neuronal MCT2 transports not only lactate but also ketone bodies (34). The ketone bodies are metabolized as a neuronal energy source during starvation (35), but their metabolism during exhaustive exercise has not been studied. The metabolomics of the present study revealed increased blood and brain levels of β-hydroxybutyrate during exhaustive exercise (Figs. 1 and 3). These data are consistent with the increases in hippocampal MCT2 and cortical β-hydroxybutyrate during prolonged, but not exhaustive, exercise (15). Blood ketone bodies, at least β-hydroxybutyrate, could be transported to neurons by increased MCT2 to spare brain glycogen in exercise-exhausted rats.
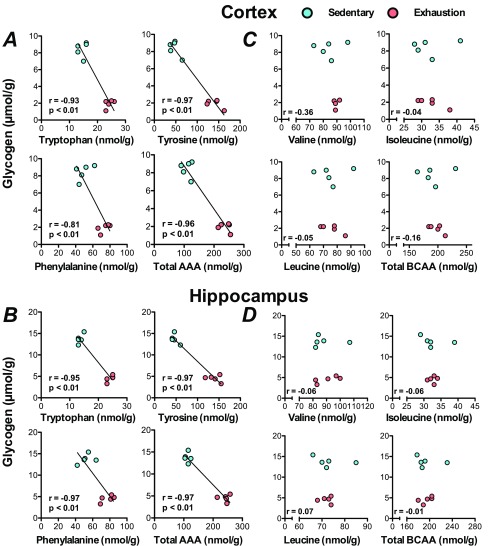
Although the mechanisms for increases in MCT2 protein are unclear, noradrenaline (NA) is an activator not only for astrocytic glycogenolysis (36) but also for MCT2 expression in neurons (37). NA neurons are activated during prolonged exercise (14). Metabolomics also revealed increases in brain tyrosine, a precursor of NA, which paralleled the decrease in brain glycogen (Figs. S5 and S6). These data point to NA as an inducer of MCT2 expression in the prolonged-exercising brain.
Fig. S6.
Increases of brain aromatic amino acids are associated with decreased brain glycogen at exhaustion. (A and B) Correlations between AAAs and glycogen in the cortex and hippocampus. (C and D) Correlations between BCAAs and glycogen in the cortex and hippocampus. Lines in scatterplots show significant correlation (P < 0.05) (Pearson’s product–moment correlation test).
Brain Glycogen and Endurance Capacity.
Blockade of brain glycogenolysis and lactate transport via MCT2 accelerated exhaustion during prolonged exercise (Fig. 5), supporting the hypothesis that brain lactate derived from astrocytic glycogen plays a role in endurance capacity because of its energetic contribution (11, 14, 24). Although DAB affected hippocampal glycogen content, it did not affect cortical glycogen with exhaustive exercise (Fig. 5B and Fig. S3). However, icv inhibition of glycogen phosphorylase blocked glycogen depletion in the hypothalamus, brainstem, and cerebellum, although it only significantly reduced lactate levels in the hippocampus, leaving open the question of which brain site(s) signals exhaustion.
DAB inhibited the decrease of glycogen in the hippocampus caused by exhaustive exercise (Fig. 5B). Because hippocampal glycogen-derived lactate acts in memory function (6), the decreased glycogen utilization in the exhausted hippocampus might be a cause of exercise-induced cognitive fatigue. However, there is methodological difficulty in detecting cognitive functions of exercise-fatigued animals because they cannot move for given memory tasks because of fatigue. In humans, exhaustive exercise decreases cognitive functions, including working memory (23), but it is unknown whether this reflects hippocampus-based cognitive decline. A new system for determining effects of moderate exercise on pattern separation, a dentate gyrus-specific ability (38), can be applied together with fMRI analysis for fatigue research on this important topic.
Hippocampal neurons also play an important role in the onset of locomotion and exhibit locomotion velocity-dependent firing with theta oscillation (39). Although untested, glycogen-derived lactate might be a contributor to locomotion-dependent hippocampal firing. This postulation could provide novel insight into the significance of the hippocampus not only for memory but also for exercise capacity, implicating the underlying positive relationship between aerobic fitness and cognitive function (40–42).
In addition, the glycogen decrease in the hypothalamus, cerebellum, and brainstem by exhaustive exercise was inhibited with DAB icv injection (Fig. S3). Hypothalamic lactate is an important factor in counterregulation during hypoglycemia (43), and brainstem lactate controls arousal by stimulating NA neurons (44). Therefore, blockade of brain glycogenolysis and lactate transport would result in a lower endurance capacity by suppression of brain region-specific functions (e.g., hippocampus: locomotion; hypothalamus: regulation of energy metabolism; cerebellum: motor control; brainstem: arousal control; etc.).
Biochemical Insight into the Development of Exhaustion and Central Fatigue During Prolonged Exercise.
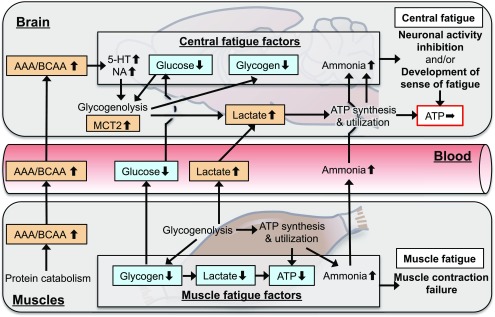
Fatigue induced by prolonged exercise is separated into muscle and central (brain) factors (24). Our metabolomics provides insight into the biochemistry behind fatigue during prolonged exercise (Fig. S7). In the muscles of exercise-exhausted rats, ATP, PCr, and glycogen are significantly decreased, whereas hypoxanthine levels increase due to purine metabolism (Figs. 3 and 4). These findings are consistent with studies on exhausted skeletal muscles (45). Although undetected in the present study, purine metabolism generates ammonia, which is a known muscle fatigue factor (46). Therefore, the depletion of energy sources and accumulation of inhibitors of muscle contraction (e.g., ammonia) are factors for muscle fatigue (failure of muscle contraction).
Fig. S7.
Schematic figure for muscle–brain coupling in the development of physiological fatigue during exhaustive exercise. In the exhausted skeletal muscle, ATP decrease is associated with glycogen depletion, whereas ammonia production via purine metabolism is increased. These are muscle fatigue factors for the failing muscle contraction. In the exhausted brain, increased uptake of muscle-derived tryptophan as a 5-HT precursor induces a sense of fatigue (tryptophan–serotonin hypothesis). Hypoglycemia induced together with muscle glycogen depletion causes a decrease in brain glycogen that is probably compounded by increased NA and 5-HT. In addition, although undetected in the present study, endogenous production of ammonia via purine metabolism in the muscles and brain is probably increased and contributes to inhibition of neuronal activity. Overall, physiological fatigue in the exhausted state is regulated via complex muscle–brain coupling, and serves primarily to maintain brain ATP as a biological outcome for neuronal protection.
In the brain, ammonia is essentially detoxified by astrocytes through the glutamate–glutamine cycle derived from muscle and/or the brain itself increases and also inhibits neuronal activity (24). The uptake of tryptophan is also increased due to the elevated ratio of branched-chain amino acids (BCAAs) and aromatic amino acids (AAAs) in the blood, which are precursors of NA and serotonin (5-hydroxytryptamine; 5-HT). Increased brain tryptophan induces elevated 5-HT levels, promoting a “sense of fatigue” and inhibiting neuronal activity (the tryptophan–serotonin hypothesis) (47). Further, hypoglycemia induced by depletion of liver and muscle glycogen creates a lack of energy that further inhibits neuronal activity. NA, 5-HT, and hypoglycemia are also strong activators of astrocytic glycogenolysis. Indeed, increased AAAs, which are likely converted to NA and 5-HT, correlated with decreased brain glycogen (Fig. S6). These factors are also induced not only during fatigue but also by sleep deprivation (48) and hypoglycemia (5, 49), conditions that decrease brain glycogen. Thus, the decrease in brain glycogen is a possible common mechanism for central fatigue.
Central fatigue factors such as ammonia, 5-HT, NA, and/or their precursors derive from muscles and reach the brain via the bloodstream. Ammonia and 5-HT appear to suppress ATP and glycogen consumption through the development of a sense of fatigue and neuronal inhibition. 5-HT and NA activate glycogenolysis and MCT expression for lactate synthesis/transport, thereby maintaining ATP synthesis. These factors would function to maintain brain ATP as the primary outcome through muscle–brain metabolic coupling in exhaustion, implicating central fatigue as a defense mechanism for brain neurons (Fig. S7).
Conclusion
Our findings provide evidence for the energetic role of lactate derived from astrocytic glycogen in the prolonged-exercising brain, thereby contributing to endurance capacity, in keeping with its known role in memory formation involving the hippocampus (6, 7). Shedding light on the mechanism of the positive relationship between endurance and memory, our metabolomics analysis also revealed that the decrease in brain glycogen is a possible factor for exercise-induced central fatigue, which involves muscle–brain metabolic cross-talk. Importantly, the ATP maintenance contributed by brain glycogen at exhaustion likely serves as a neuroprotective mechanism.
Materials and Methods
For a full description of all materials and methods, see SI Materials and Methods.
Animals.
Adult male Wistar rats (250 to 300 g) (SLC), housed and cared for in an animal facility, were fed a standard pellet diet (MF; Oriental Yeast) and given water ad libitum. Room temperature was maintained between 22 and 24 °C under a 12-h light–12-h dark cycle (lights on, 0700 to 1900 h). All experimental protocols were conducted in accordance with the guidelines of the University of Tsukuba Animal Experiment Committee. The rats were habituated to running on a treadmill (SN-460; Shinano) for five sessions over 6 d, 30 min/d. The running speed was gradually increased from 5 to 25 m/min (13, 14).
Prolonged Exhaustive Exercise.
Rats were fasted for 2 h before exercise to obtain stable metabolic conditions (n = 5 in each group). They were exercised to exhaustion on a treadmill at 20 m/min. Exhaustion was considered by the standard in previous studies (13, 14).
Inhibition of Glycogenolysis and Lactate Transport in the Brain.
A steel guide cannula was inserted into the lateral cerebral ventricle of rat brain (50). Rats were placed on the treadmill for at least 30 min, and randomly injected via an icv catheter with a glycogen phosphorylase inhibitor (DAB; 150 mM in 10 µL of 0.9% saline, pH 7.2) or dose-specific MCT2 inhibitor (4-CIN; 36 mM in 10 µL of 40% DMSO and 0.9% saline, pH 7.2) (Sigma-Aldrich). Fifteen minutes after the icv injection, rats were subjected to exhaustive exercise (n = 5 to 7 in each group).
Sample Collection.
Blood samples were collected during exercise through a catheter inserted into the jugular vein. Following the exhaustive exercise, the rats were killed using focused microwave irradiation (MI) (10 kW, 1.2 s; NJE-2603; New Japan Radio). After MI, brain tissues and skeletal muscles were collected. All samples were stored at −80 °C until analysis.
Blood Glucose and Lactate Assays.
Blood glucose and lactate levels were measured using an automated glucose/lactate analyzer (2300 Stat Plus; Yellow Springs Instruments).
Brain and Muscle Glycogen Assay.
The glycogen assay was performed in 96-well plates using a coupled-enzyme assay method modified from previous studies (13, 14).
Western Blot Analysis.
The tissues were lysed in urea-based lysis buffer, and sample proteins were loaded on an SDS/polyacrylamide gel. After electrophoresis, proteins were transferred to a polyvinylidene difluoride membrane, blocked, and then incubated with primary and secondary antibodies. Proteins were visualized and their signals were quantified with β-actin normalization using image analysis software (GE Healthcare Life Sciences).
Metabolomics.
Metabolomics was conducted by Human Metabolome Technologies (19). Each frozen sample was homogenized in methanol, and metabolites were extracted for analysis by CE-MS. CE-MS experiments were performed using Agilent CE systems equipped with a time-of-flight mass spectrometer and a built-in diode-array detector (Agilent Technologies). The identified metabolites were quantified by comparing their peak areas with those of authentic standards using ChemStation software (Agilent Technologies).
Brain Lactate and ATP Assay.
Lactate measurements were obtained according to the method described by Matsui et al. (14). ATP levels were analyzed using the ATPlite Kit with luciferin/luciferase activity (6016736, PerkinElmer), and luminescence was measured with a microplate reader (ARVO X4, PerkinElmer).
Statistical Analysis.
Data are expressed as mean ± SE and were analyzed by Student’s t test and a one-way ANOVA with Tukey’s post hoc tests using Prism 5 (MDF). Statistical significance was assumed at P values <0.05.
SI Materials and Methods
Animals.
Adult male Wistar rats (250 to 300 g) (SLC), housed and cared for in an animal facility, were fed a standard pellet diet (MF; Oriental Yeast) and given water ad libitum. Room temperature was maintained between 22 and 24 °C under a 12-h light–12-h dark cycle (lights on, 0700 to 1900 h). All experimental protocols were conducted in accordance with the guidelines of the University of Tsukuba Animal Experiment Committee.
Surgery for Intracerebroventricular Injection.
Before habituation to treadmill running, rats were anesthetized with isoflurane and placed in a stereotaxic frame. A stainless steel guide cannula (22-gauge) was inserted into the brain with the cap in the left lateral cerebral ventricle, and the guide cannula was fixed to the skull with two anchor screws and dental cement. The cannula was located 0.8 mm caudal to the bregma, 1.4 mm lateral to the midline, and 3.5 mm below the skull. The rats were then housed individually in transparent polycarbonate cages until the running tests. We confirmed that each cannula had successfully reached the cerebral ventricle by icv injection of angiotensin II and observation of an immediate desire to drink (50).
Habituation to Treadmill Running.
The rats were habituated to running on a treadmill (SN-460; Shinano) for five sessions over 6 d, 30 min/d. The running speed was gradually increased from 5 to 25 m/min (13, 14).
Surgery to Insert Jugular Catheter.
After habituation to treadmill running, the rats were anesthetized with isoflurane and a silicone catheter was inserted into the jugular vein and fixed with a silk thread suture (32 mm). The external distal end of the catheter was fixed at the nape of the neck. Subsequent experiments and analyses were carried out 2 d after surgery (13, 14).
Prolonged Exhaustive Exercise.
Rats were fasted for 2 h before exercise to obtain stable metabolic conditions. They were exercised to exhaustion on a treadmill at 20 m/min. A sedentary group of animals was placed on a stationary treadmill for 90 min. Exhaustion was considered to be achieved when the rat was no longer able to keep pace with the treadmill, lay flat on the treadmill, and stayed on the grid positioned at the back of the treadmill for a period of 30 s despite being gently pushed with sticks or breathed on (13, 14).
Inhibition of Glycogenolysis and Lactate Transport in the Brain.
On the day of the exhaustive exercise, rats were placed on the treadmill for at least 30 min and randomly injected via the icv catheter with a glycogen phosphorylase inhibitor (DAB; 150 mM in 10 µL of 0.9% saline, pH 7.2) or dose-specific MCT2 inhibitor (4-CIN; 36 mM in 10 µL of 40% DMSO and 0.9% saline, pH 7.2) (Sigma-Aldrich). DAB is a potent inhibitor of both the phosphorylated and nonphosphorylated forms of glycogen phosphorylase, whereas 4-CIN is recognized as a competitive, nontransportable inhibitor of MCTs. The icv injection requires a 100-fold higher dose than in vitro and/or local injections for similar drug efficacy (6, 7). The IC50 value (the concentration of drug required to reduce lactate transport by one-half) is 425 µM for MCT1, 900 µM for MCT4, and 24 µM for MCT2 in cultured cells. Thus, an icv injection of 36 mM 4-CIN should not inhibit monocarboxylate transport by MCT1 and MCT4 but would eliminate monocarboxylate transport by MCT2 (36 mM 4-CIN is approximately 15 times the IC50 for MCT2). Fifteen minutes after the icv injection, rats were subjected to exhaustive exercise.
Sacrifice of Animals and Tissue Extraction.
Following the exhaustive exercise, the rats were anesthetized with isoflurane in a bell jar for less than 1 min and killed using focused microwave irradiation (MI) (10 kW, 1.2 s; NJE-2603; New Japan Radio). We previously confirmed that brain glycogen levels are unchanged by this duration of isoflurane challenge (4, 14). After MI, brain tissues (cortex, hippocampus, hypothalamus, cerebellum, and brainstem) were collected. Skeletal muscles (soleus and plantaris) and blood were also collected. All samples were stored at −80 °C until analysis.
Blood Glucose and Lactate Assays.
Blood glucose and lactate levels were measured using an automated glucose/lactate analyzer (2300 Stat Plus; Yellow Springs Instruments).
Glycogen Assay.
Tissues were homogenized with a bead homogenizer (MS-100R; TOMY) in ice-cold 6% perchloric acid (PA) containing 1 mM EDTA. The glycogen contained in 100-µL aliquots of homogenate was hydrolyzed to glucose by incubation for 3 h at 37 °C with 1 mL 0.2 M sodium acetate, 20 µL 1.0 M KHCO3, and 20 U/mL amyloglucosidase. Addition of 0.5 mL PA stopped the reaction. After centrifugation (14,000 × g for 10 min at 4 °C), the supernatant was neutralized with a solution consisting of 3 M KOH, 0.3 M imidazole, and 0.4 M KCl. The sample was then centrifuged (16,000 × g for 10 min at 4 °C) and the supernatant was assayed for glucose content. Nonhydrolyzed samples were used to measure endogenous glucose levels; these samples were homogenized and centrifuged (14,000 × g for 10 min at 4 °C) and the pH of the supernatants was adjusted to 6 to 8 with KOH solution. The neutralized samples were mixed thoroughly, centrifuged (16,000 × g for 10 min at 4 °C), and assayed for endogenous glucose levels. The glucose assay was performed in 96-well plates using a coupled-enzyme assay method modified from previous studies (13, 14).
Western Blot Analysis.
The tissues were first ground to a fine powder in liquid nitrogen and lysed in urea-based lysis buffer. The tissue homogenate was centrifuged at 18,000 × g for 15 min at 20 °C and the supernatant was collected. Protein concentration was determined with a Bio-Rad Protein Assay Kit. Sample proteins were loaded on a 5 to 20% gradient SDS/polyacrylamide gel (E-R520L; ATTO). After electrophoresis, proteins were transferred to a polyvinylidene difluoride membrane (RPN2020F; GE Healthcare). The membrane was blocked in 5% nonfat milk for 1 h at room temperature and then incubated overnight with primary antibodies against MCT1 (sc-50325), MCT2 (sc-50325), MCT4 (sc-50329), GLUT1 (sc-7903), GLUT3 (sc-30107), and GLUT4 (sc-7938) (1:1,000; Santa Cruz). After washing, the membrane was incubated with secondary antibodies—goat anti-mouse IgG (sc-2005) or goat anti-rabbit IgG (sc-2004) (1:5,000; Santa Cruz), as appropriate—for 1 h at room temperature, and the bound antibody was detected using an enhanced chemiluminescence detection kit (02230; Nacalai Tesque). The signals were digitally scanned and then quantified using image analysis software (GE Healthcare Life Sciences). For the gel loading control, membranes were reprobed with a monoclonal anti–β-actin antibody (1:50,000; Sigma). The protein levels in the exhaustion group were expressed as a percentage of sedentary values. GLUT1 protein levels in astrocytes and endothelial cells were separated by the size of the protein molecule.
Metabolomics by Capillary Electrophoresis–Time-of-Flight Mass Spectrometry.
This process was conducted by Human Metabolome Technologies (19). Each frozen sample was homogenized in methanol (500 mL per 100 mg tissue) using a bead homogenizer (Micro Smash MS-100R; TOMY), followed by the addition of an equal volume of chloroform and 0.4× the volume of Milli-Q water. After centrifugation (three cycles at 5,000 × g for 60 s), the aqueous phases were ultrafiltered using an ultrafiltration tube (Ultrafree-MC, UFC3 LCC; Millipore) and the filtrates were dried. The dried residues were redissolved in 50 mL of Milli-Q water and used for CE-MS. CE-MS experiments were performed using Agilent CE systems equipped with a time-of-flight mass spectrometer and a built-in diode-array detector (Agilent Technologies). Cationic metabolites were analyzed with a fused-silica capillary (50 mm i.d., 680 cm total length) with cation buffer solution (Human Metabolome Technologies) as the electrolyte. The samples were injected at a pressure of 5.0 kPa for 10 s (∼10 nL). The applied voltage was set at 30 kV. Electrospray ionization mass spectrometry (ESI-MS) was conducted in positive ion mode, and the capillary voltage was set at 4,000 V. The spectrometer was scanned from m/z 50 to 1,000. Other conditions were the same as in the cation analysis. Anionic metabolites were analyzed with a fused-silica capillary (50 mm i.d., 680 cm total length) with anion buffer solution (Human Metabolome Technologies) as the electrolyte. The samples were injected at a pressure of 5.0 kPa for 25 s (∼25 nL). The applied voltage was set at 30 kV. ESI-MS was conducted in negative ion mode, and the capillary voltage was set at 3,500 V. The sample in the spectrometer was scanned from m/z 50 to 1,000. Other conditions were the same as described for the anion analysis. Metabolites in the samples were identified by comparing the migration time and m/z ratio with authentic standards, and differences of 60.5 min and 610 ppm, respectively, were permitted. The identified metabolites were quantified by comparing their peak areas with those of authentic standards using ChemStation software (Agilent Technologies).
The metabolomics data were adopted for principal component analysis (PCA) and hierarchical cluster analysis (HCA) using software (Human Metabolome Technologies). Data were also visualized on a metabolome-wide pathway map for glycolysis and the TCA cycle supported by VANTED software (https://immersive-analytics.infotech.monash.edu/vanted/).
Brain Lactate Assay.
Lactate measurements were obtained according to the method described by Matsui et al. (14). The average hypothalamic lactate level in sedentary animals was 1.1 μmol/g, which corresponds well with previous findings from microdialysis studies of extracellular fluid in the hypothalamus.
ATP Assay.
ATP levels were analyzed using the ATPlite Kit with luciferin/luciferase activity (6016736, PerkinElmer), and luminescence was measured with a microplate reader (Arvo X4; PerkinElmer).
Statistical Analysis.
Data are expressed as mean ± SE and were analyzed using Prism 5 (MDF). Comparisons of two groups were performed using Student’s t test for unpaired data. Group comparisons were performed using a one-way ANOVA with Tukey’s post hoc tests. Correlations were calculated using Pearson’s product–moment correlations. Statistical significance was assumed at P values <0.05.
Acknowledgments
This research was supported in part by special funds of Education and Research of the Ministry of Education, Culture, Sports, Science and Technology (MEXT) granted to the “Human High Performance (HHP) Research Project”; the Team “Nippon” Multi-Support project; grants of the Japan Society for the Promotion of Science (JSPS) for the “Global Initiative for Sports Neuroscience (GISN): For Development of Exercise Prescription Enhancing Cognitive Functions”; and JSPS Grants-in-Aid for Scientific Research A, Challenging Exploratory Research, JSPS Fellow (Superlative Post-Doc), and Young Scientist A.
Footnotes
The authors declare no conflict of interest.
This article contains supporting information online at www.pnas.org/lookup/suppl/doi:10.1073/pnas.1702739114/-/DCSupplemental.
References
- 1.Bélanger M, Allaman I, Magistretti PJ. Brain energy metabolism: Focus on astrocyte-neuron metabolic cooperation. Cell Metab. 2011;14:724–738. doi: 10.1016/j.cmet.2011.08.016. [DOI] [PubMed] [Google Scholar]
- 2.Mächler P, et al. In vivo evidence for a lactate gradient from astrocytes to neurons. Cell Metab. 2016;23:94–102. doi: 10.1016/j.cmet.2015.10.010. [DOI] [PubMed] [Google Scholar]
- 3.O’Dowd BS, Gibbs ME, Ng KT, Hertz E, Hertz L. Astrocytic glycogenolysis energizes memory processes in neonate chicks. Brain Res Dev Brain Res. 1994;78:137–141. doi: 10.1016/0165-3806(94)90018-3. [DOI] [PubMed] [Google Scholar]
- 4.Kong J, et al. Brain glycogen decreases with increased periods of wakefulness: Implications for homeostatic drive to sleep. J Neurosci. 2002;22:5581–5587. doi: 10.1523/JNEUROSCI.22-13-05581.2002. [DOI] [PMC free article] [PubMed] [Google Scholar]
- 5.Herzog RI, et al. Effect of acute and recurrent hypoglycemia on changes in brain glycogen concentration. Endocrinology. 2008;149:1499–1504. doi: 10.1210/en.2007-1252. [DOI] [PMC free article] [PubMed] [Google Scholar]
- 6.Suzuki A, et al. Astrocyte-neuron lactate transport is required for long-term memory formation. Cell. 2011;144:810–823. doi: 10.1016/j.cell.2011.02.018. [DOI] [PMC free article] [PubMed] [Google Scholar]
- 7.Newman LA, Korol DL, Gold PE. Lactate produced by glycogenolysis in astrocytes regulates memory processing. PLoS One. 2011;6:e28427. doi: 10.1371/journal.pone.0028427. [DOI] [PMC free article] [PubMed] [Google Scholar]
- 8.Swanson RA, Choi DW. Glial glycogen stores affect neuronal survival during glucose deprivation in vitro. J Cereb Blood Flow Metab. 1993;13:162–169. doi: 10.1038/jcbfm.1993.19. [DOI] [PubMed] [Google Scholar]
- 9.Secher NH, Seifert T, Van Lieshout JJ. Cerebral blood flow and metabolism during exercise: Implications for fatigue. J Appl Physiol (1985) 2008;104:306–314. doi: 10.1152/japplphysiol.00853.2007. [DOI] [PubMed] [Google Scholar]
- 10.Vissing J, Andersen M, Diemer NH. Exercise-induced changes in local cerebral glucose utilization in the rat. J Cereb Blood Flow Metab. 1996;16:729–736. doi: 10.1097/00004647-199607000-00025. [DOI] [PubMed] [Google Scholar]
- 11.Larsen TS, Rasmussen P, Overgaard M, Secher NH, Nielsen HB. Non-selective beta-adrenergic blockade prevents reduction of the cerebral metabolic ratio during exhaustive exercise in humans. J Physiol. 2008;586:2807–2815. doi: 10.1113/jphysiol.2008.151449. [DOI] [PMC free article] [PubMed] [Google Scholar]
- 12.Gollnick PD, Piehl K, Saltin B. Selective glycogen depletion pattern in human muscle fibres after exercise of varying intensity and at varying pedalling rates. J Physiol. 1974;241:45–57. doi: 10.1113/jphysiol.1974.sp010639. [DOI] [PMC free article] [PubMed] [Google Scholar]
- 13.Matsui T, et al. Brain glycogen supercompensation following exhaustive exercise. J Physiol. 2012;590:607–616. doi: 10.1113/jphysiol.2011.217919. [DOI] [PMC free article] [PubMed] [Google Scholar]
- 14.Matsui T, et al. Brain glycogen decreases during prolonged exercise. J Physiol. 2011;589:3383–3393. doi: 10.1113/jphysiol.2011.203570. [DOI] [PMC free article] [PubMed] [Google Scholar]
- 15.Takimoto M, Hamada T. Acute exercise increases brain region-specific expression of MCT1, MCT2, MCT4, GLUT1, and COX IV proteins. J Appl Physiol. 2014;116:1238–1250. doi: 10.1152/japplphysiol.01288.2013. [DOI] [PubMed] [Google Scholar]
- 16.Coles L, Litt J, Hatta H, Bonen A. Exercise rapidly increases expression of the monocarboxylate transporters MCT1 and MCT4 in rat muscle. J Physiol. 2004;561:253–261. doi: 10.1113/jphysiol.2004.073478. [DOI] [PMC free article] [PubMed] [Google Scholar]
- 17.de Haan A, Koudijs JC. A linear relationship between ATP degradation and fatigue during high-intensity dynamic exercise in rat skeletal muscle. Exp Physiol. 1994;79:865–868. doi: 10.1113/expphysiol.1994.sp003814. [DOI] [PubMed] [Google Scholar]
- 18.Suh SW, Hamby AM, Swanson RA. Hypoglycemia, brain energetics, and hypoglycemic neuronal death. Glia. 2007;55:1280–1286. doi: 10.1002/glia.20440. [DOI] [PubMed] [Google Scholar]
- 19.Sugiura Y, Taguchi R, Setou M. Visualization of spatiotemporal energy dynamics of hippocampal neurons by mass spectrometry during a kainate-induced seizure. PLoS One. 2011;6:e17952. doi: 10.1371/journal.pone.0017952. [DOI] [PMC free article] [PubMed] [Google Scholar]
- 20.Inostroza M, Brotons-Mas JR, Laurent F, Cid E, de la Prida LM. Specific impairment of “what-where-when” episodic-like memory in experimental models of temporal lobe epilepsy. J Neurosci. 2013;33:17749–17762. doi: 10.1523/JNEUROSCI.0957-13.2013. [DOI] [PMC free article] [PubMed] [Google Scholar]
- 21.Berthet C, et al. Neuroprotective role of lactate after cerebral ischemia. J Cereb Blood Flow Metab. 2009;29:1780–1789. doi: 10.1038/jcbfm.2009.97. [DOI] [PubMed] [Google Scholar]
- 22.Jourdain P, et al. L-lactate protects neurons against excitotoxicity: Implication of an ATP-mediated signaling cascade. Sci Rep. 2016;6:21250. doi: 10.1038/srep21250. [DOI] [PMC free article] [PubMed] [Google Scholar]
- 23.Perciavalle V, Maci T, Perciavalle V, Massimino S, Coco M. Working memory and blood lactate levels. Neurol Sci. 2015;36:2129–2136. doi: 10.1007/s10072-015-2329-4. [DOI] [PubMed] [Google Scholar]
- 24.Nybo L, Secher NH. Cerebral perturbations provoked by prolonged exercise. Prog Neurobiol. 2004;72:223–261. doi: 10.1016/j.pneurobio.2004.03.005. [DOI] [PubMed] [Google Scholar]
- 25.Myburgh KH. Protecting muscle ATP: Positive roles for peripheral defense mechanisms—Introduction. Med Sci Sports Exerc. 2004;36:16–19. doi: 10.1249/01.MSS.0000106280.19491.B5. [DOI] [PubMed] [Google Scholar]
- 26.Sant’Ana Pereira JA, Sargeant AJ, Rademaker AC, de Haan A, van Mechelen W. Myosin heavy chain isoform expression and high energy phosphate content in human muscle fibres at rest and post-exercise. J Physiol. 1996;496:583–588. doi: 10.1113/jphysiol.1996.sp021709. [DOI] [PMC free article] [PubMed] [Google Scholar]
- 27.Enoki T, Yoshida Y, Lally J, Hatta H, Bonen A. Testosterone increases lactate transport, monocarboxylate transporter (MCT) 1 and MCT4 in rat skeletal muscle. J Physiol. 2006;577:433–443. doi: 10.1113/jphysiol.2006.115436. [DOI] [PMC free article] [PubMed] [Google Scholar]
- 28.Ventura-Clapier R, Vassort G. The hypodynamic state of the frog heart. Further evidence for a phosphocreatine-creatine pathway. J Physiol (Paris) 1980;76:583–589. [PubMed] [Google Scholar]
- 29.Arakawa K, et al. Changes in blood biochemical markers before, during, and after a 2-day ultramarathon. Open Access J Sports Med. 2016;7:43–50. doi: 10.2147/OAJSM.S97468. [DOI] [PMC free article] [PubMed] [Google Scholar]
- 30.Peters A, et al. The selfish brain: Competition for energy resources. Neurosci Biobehav Rev. 2004;28:143–180. doi: 10.1016/j.neubiorev.2004.03.002. [DOI] [PubMed] [Google Scholar]
- 31.Mangia S, Giove F, Dinuzzo M. K+ homeostasis in the brain: A new role for glycogenolysis. Neurochem Res. 2013;38:470–471. doi: 10.1007/s11064-012-0962-3. [DOI] [PubMed] [Google Scholar]
- 32.Ferreira JM, Burnett AL, Rameau GA. Activity-dependent regulation of surface glucose transporter-3. J Neurosci. 2011;31:1991–1999. doi: 10.1523/JNEUROSCI.1850-09.2011. [DOI] [PMC free article] [PubMed] [Google Scholar]
- 33.Hamai M, Minokoshi Y, Shimazu T. L-glutamate and insulin enhance glycogen synthesis in cultured astrocytes from the rat brain through different intracellular mechanisms. J Neurochem. 1999;73:400–407. doi: 10.1046/j.1471-4159.1999.0730400.x. [DOI] [PubMed] [Google Scholar]
- 34.Koehler-Stec EM, Simpson IA, Vannucci SJ, Landschulz KT, Landschulz WH. Monocarboxylate transporter expression in mouse brain. Am J Physiol. 1998;275:E516–E524. doi: 10.1152/ajpendo.1998.275.3.E516. [DOI] [PubMed] [Google Scholar]
- 35.Owen OE, et al. Brain metabolism during fasting. J Clin Invest. 1967;46:1589–1595. doi: 10.1172/JCI105650. [DOI] [PMC free article] [PubMed] [Google Scholar]
- 36.Sorg O, Magistretti PJ. Vasoactive intestinal peptide and noradrenaline exert long-term control on glycogen levels in astrocytes: Blockade by protein synthesis inhibition. J Neurosci. 1992;12:4923–4931. doi: 10.1523/JNEUROSCI.12-12-04923.1992. [DOI] [PMC free article] [PubMed] [Google Scholar]
- 37.Pierre K, Debernardi R, Magistretti PJ, Pellerin L. Noradrenaline enhances monocarboxylate transporter 2 expression in cultured mouse cortical neurons via a translational regulation. J Neurochem. 2003;86:1468–1476. doi: 10.1046/j.1471-4159.2003.01964.x. [DOI] [PubMed] [Google Scholar]
- 38.Suwabe K, et al. Acute moderate exercise improves mnemonic discrimination in young adults. Hippocampus. 2017;27:229–234. doi: 10.1002/hipo.22695. [DOI] [PMC free article] [PubMed] [Google Scholar]
- 39.Fuhrmann F, et al. Locomotion, theta oscillations, and the speed-correlated firing of hippocampal neurons are controlled by a medial septal glutamatergic circuit. Neuron. 2015;86:1253–1264. doi: 10.1016/j.neuron.2015.05.001. [DOI] [PubMed] [Google Scholar]
- 40.Erickson KI, et al. Aerobic fitness is associated with hippocampal volume in elderly humans. Hippocampus. 2009;19:1030–1039. doi: 10.1002/hipo.20547. [DOI] [PMC free article] [PubMed] [Google Scholar]
- 41.Hyodo K, et al. The association between aerobic fitness and cognitive function in older men mediated by frontal lateralization. Neuroimage. 2016;125:291–300. doi: 10.1016/j.neuroimage.2015.09.062. [DOI] [PubMed] [Google Scholar]
- 42.Kramer AF, et al. Ageing, fitness and neurocognitive function. Nature. 1999;400:418–419. doi: 10.1038/22682. [DOI] [PubMed] [Google Scholar]
- 43.Chan O, Paranjape SA, Horblitt A, Zhu W, Sherwin RS. Lactate-induced release of GABA in the ventromedial hypothalamus contributes to counterregulatory failure in recurrent hypoglycemia and diabetes. Diabetes. 2013;62:4239–4246. doi: 10.2337/db13-0770. [DOI] [PMC free article] [PubMed] [Google Scholar]
- 44.Tang F, et al. Lactate-mediated glia-neuronal signalling in the mammalian brain. Nat Commun. 2014;5:3284. doi: 10.1038/ncomms4284. [DOI] [PMC free article] [PubMed] [Google Scholar]
- 45.Sahlin K, Tonkonogi M, Söderlund K. Plasma hypoxanthine and ammonia in humans during prolonged exercise. Eur J Appl Physiol Occup Physiol. 1999;80:417–422. doi: 10.1007/s004210050613. [DOI] [PubMed] [Google Scholar]
- 46.Broberg S, Sahlin K. Adenine nucleotide degradation in human skeletal muscle during prolonged exercise. J Appl Physiol. 1989;67:116–122. doi: 10.1152/jappl.1989.67.1.116. [DOI] [PubMed] [Google Scholar]
- 47.Cotel F, Exley R, Cragg SJ, Perrier JF. Serotonin spillover onto the axon initial segment of motoneurons induces central fatigue by inhibiting action potential initiation. Proc Natl Acad Sci USA. 2013;110:4774–4779. doi: 10.1073/pnas.1216150110. [DOI] [PMC free article] [PubMed] [Google Scholar]
- 48.Lopez-Rodriguez F, Wilson CL, Maidment NT, Poland RE, Engel J. Total sleep deprivation increases extracellular serotonin in the rat hippocampus. Neuroscience. 2003;121:523–530. doi: 10.1016/s0306-4522(03)00335-x. [DOI] [PubMed] [Google Scholar]
- 49.Heyes MP, Papagapiou M, Leonard C, Markey SP, Auer RN. Brain and plasma quinolinic acid in profound insulin-induced hypoglycemia. J Neurochem. 1990;54:1027–1033. doi: 10.1111/j.1471-4159.1990.tb02353.x. [DOI] [PubMed] [Google Scholar]
- 50.Ohiwa N, et al. Possible inhibitory role of prolactin-releasing peptide for ACTH release associated with running stress. Am J Physiol Regul Integr Comp Physiol. 2007;292:R497–R504. doi: 10.1152/ajpregu.00345.2006. [DOI] [PubMed] [Google Scholar]


