VARIATION IN PRACTICE
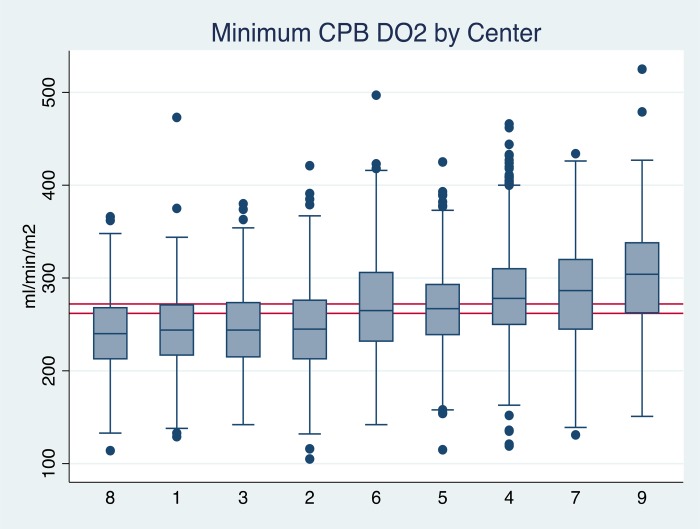
The Australian and New Zealand Collaborative Perfusion Registry (ANZCPR) tracks perfusion practices from the nine centers contributing to the collaborative dataset. It is unique in that data from the heart–lung machine, monitors, and the electronic perfusion records are able to be imported into the dataset. This allows many physiological parameters to be reported, including oxygen delivery. Figure 1 illustrates the variation in minimum oxygen delivery (DO2i) in the nine centers. Why is there this much variation between the different centers? The aim of this paper is to outline what can influence the measurement and reporting of perfusion parameters, specifically those related to goal-directed perfusion (GDP) and to highlight potential sources of error in our measurements.
“An error does not become truth by reason of multiplied propagation, nor does the truth become error because nobody will see it.”
Mahatma Gandhi (1869–1948)
Figure 1.
Box and whisker plot demonstrating the variation in minimum DO2i between the nine centers contributing to the ANZCPR. Median (midline of box) 25th and 75th percentiles are shown with adjacent values and outliers.
VARIATION IN MEASUREMENT
The development of real-time monitoring for DO2 has enabled oxygen delivery to become one of the measurements that perfusionists may consider when performing bypass. Audience response (ARS) questions asked during this GDP Symposium at the 54th American Society of ExtraCorporeal Technology (AmSECT) International Meeting showed that 97% of attendees were familiar with the concept of GDP, with approximately 50% having introduced GDP into their practice in some way. Delegates were also asked if they had any shunts on the arterial side of their circuit and the impact they may have on arterial flow measurements. A large number of different circuit options exist, different oxygenators have different requirements in terms of leaving shunts opened or closed and how and where blood flow is measured. Half of the delegates reported a shunt fraction between 100 and 300 mL/min, with two-thirds measuring blood flow distal to their shunts.
Calculating Oxygen Delivery
Variation in the reported DO2i can occur depending on the formula used to calculate DO2 (1,2).
 |
where arterial O2 content is calculated:
 |
At an average flow of 4.5 L, hemoglobin of 9, a saturation of 99%, and PaO2 of 200, and a patient with a body surface area of 2.0, there is a difference in DO2i of 4 mL/min/m2 depending on which formula is used. This is not a large difference. However, we may introduce other sources of error in our measurements, suggesting we need to standardize how we make our measurements which impact our clinical judgement. CONNECT software (LivaNova, Mirandola, Italy) uses a modification of Ranucci's equation (1). There are multiple elements to the calculation. Variance can be introduced in how flow is measured, where on the circuit the flow measurement is taken, or whether a roller pump is used to calculate flow or an ultrasonic flow sensor. In addition, does the flow measurement take into account shunt flows? If we use the same conditions as above, and compare DO2i values, using a S5 roller pump DO2i is 292 mL/min/m2, if flow is measured using a M4 flow probe (Spectrum Medical, Gloucester, England) positioned distal to the shunt DO2i is 272 mL/min/m2, with a 700 mL shunt the DO2i is 246 mL/min/m2. The type of tubing may also influence the measurement of DO2i. In our institution, we found differences in DO2 measurements depending on the type of tubing (PHYSIO [LivaNova] compared with SmartX [LivaNova]), and the type of ultrasonic flow probe (the M4 flow probe [arterial and venous, Spectrum Medical] compared with the SCP flow sensor [LivaNova]) (2).
Other factors may vary when oxygen delivery is reported? Different devices use different formula to calculate DO2 (3, Personal communication, Spectrum Medical).
Differences include the following:
Hb vs. Hct/2.94
The constant is different (1.36 vs. 1.34)
PaO2 contribution
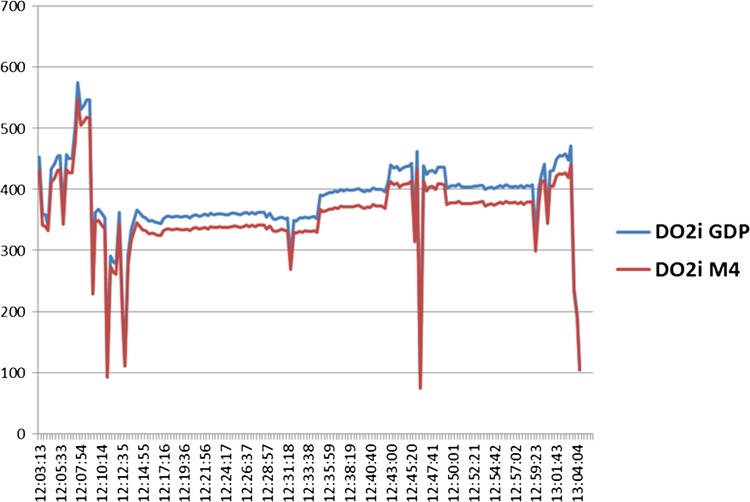
Collectively, these result in different values for DO2i (Figure 2). The evidence supporting the clinical value of DO2- and CO2-derived parameters, including CO2 production, is increasing in the literature; therefore, it is vital that we understand how the measurements are made, that they are accurate and reproducible.
Figure 2.
The shape of the curves for DO2i is similar; however, there is a significant offset between the two measurements. Vertical scale (DO2i mL/min/m2), horizontal time (h:min:sec).
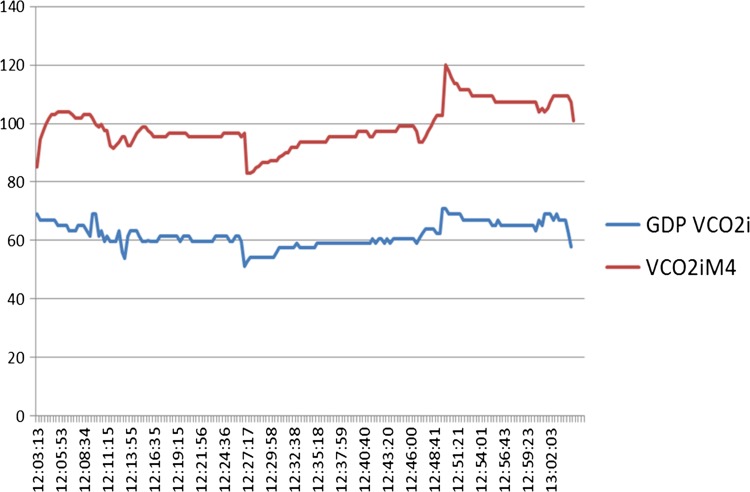
It is therefore equally important that we understand how VCO2 is measured. The symposium ARS suggested that 5–10% of clinicians were routinely measuring exhaust CO2. In addition, we know there are a variety of methods for measuring exhaust CO2, including using the anesthetic machine capnography, a dedicated capnograph, or using M4 capnography. A number of publications have demonstrated variation associated with how this measurement is made (4–6). In our clinical experience when we compared the calculated value of VCO2 using the M4 and the CONNECT software, the values are generated were different; however, the trends are similar (Figure 3). The different devices use different formula to calculate VCO2 (3, Personal communication, Spectrum Medical).
Figure 3.
The shape of the curves for VCO2i is similar; however, there is a significant offset between the two measurements. Vertical scale (VCO2i mL/min/m2), horizontal time (h:min:sec).
An additional source of variation is how gas flow is measured, the type of blender, either electronic with or without automatic data collection, or using a Securest blender and manual data entry.
These examples highlight that whichever device is used, the trends may be similar; however, the absolute values can vary significantly. This is similar to what we have seen with in-line saturation and hematocrit monitoring, they act as trending devices, for example, a low in-line venous hematocrit measurements may drive the perfusionist to measure hemoglobin level using a blood gas analyzer.
Are we entering a phase of clinical practice where monitors that traditionally have been used as trending devices, may now be used as monitors to direct practice? This is a potentially a big change in the way that perfusion is practiced in the future.
IN VITRO EVALUATION OF CO2 EXHAUST MEASUREMENTS
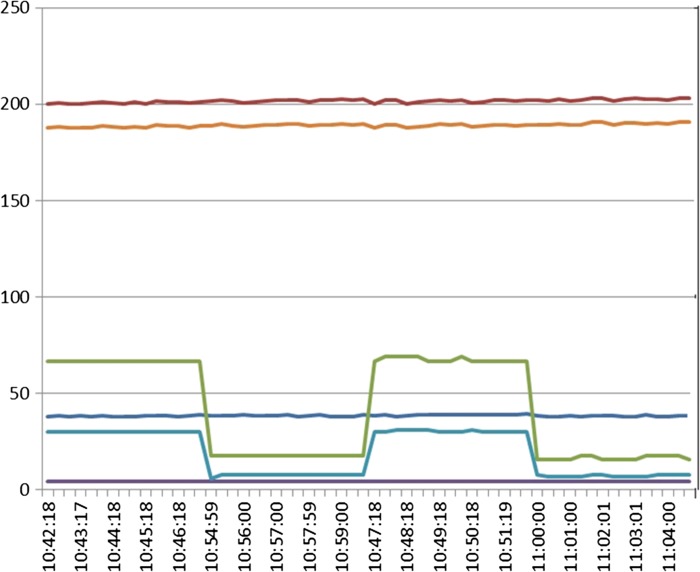
The published work of Ranucci and De Somer (7), and that presented by Justison (8) suggest that it is important to measure CO2 exhaust accurately as it may be valuable to our practices in helping avoid acute kidney injury (AKI) following cardiopulmonary bypass (CPB). The Flinders group performed in vitro evaluation studies to at the measurement of exhaust gases from different oxygenators (2). Five oxygenators were evaluated, RX-25 and FX-25 (Terumo Cardiovascular Systems, Ann Arbor, MI), the Inspire (LivaNova), and Compactflo (Dideco, Mirandola, Italy) and the Fusion (Medtronic, Minneapolis, MN). A recirculating perfusion circuit was set up with SmartX tubing (LivaNova), a 38-micron arterial filter (Pall Corporation, Port Washington, NY), and the experimental the oxygenator. A plasmalyte blood prime (Baxter, Old Toongabbie, Australia) was used (hematocrit 24). CO2 was titrated to be between 35 and 45 mmHg. A scavenging device (Dräger Medical GmbH, Lübeck, Germany) attached to the M4 gas module using wall suction was applied to provide passive collection of exhaust gas. Vamos (Dräger Medical GmbH) and Datex (GE Healthcare, Chicago, IL) capnographs were connected via sampling tubing immediately distal to the M4 exit gas sensor. A 3/8-inch luer connector was utilized to enable measurements to be obtained with the scavenging system vented (luer cap off) or nonvented (luer cap on), to accommodate the instructions for use of the M4 device, which state that it needs to operate as a vented system. This setup allowed the evaluation of seven measurements in this setting: M4 pCO2, M4 FiCO2, M4 FeCO2, GDP DO2i, Vamos pCO2, and CONNECT DO2i and CONNECT VCO2i. Figure 4 is a typical example of the output generated under these conditions. This is an example using the RX-25. We can see differences in DO2i measurements, and also in the CO2 parameters, and in response to when the system was vented and when it was not vented. When we used the vented system, we were not able to get a reliable CO2 measurement.
Figure 4.
Purple line: M4 FeCO2, light blue line: Vamos CO2, dark blue line: M4 pCO2, orange line: M4 DO2i, red line: GDP DO2i.
When the results for the each of the four oxygenators tested were examined, there was considerable variation between the CONNECT and M4 DO2i measurements, most pronounced with the RX, FX, and Inspire oxygenators, and a pronounced effect in CO2 measurement with venting, as seen in Figure 4, except with the Inspire oxygenator. These differences in exhaust CO2 measurements relate to the design of the oxygenator venting system and how many exhaust ports exist in the outer casing of the oxygenator unit. Therefore, the design of how exhaust gases are managed with each different oxygenator has a major impact on exhaust capnography results, a result previously reported (4–6). This can be important if exhaust capnography is to be used to assist in making decisions about intraoperative patient management.
All of the factors highlighted above demonstrate the importance of first understanding what is being measured, how it is being measuring, and then tailoring the understanding of the values reported to your own institution and your own practices because they vary between different units and different clinical situations.
SUPPORTING EVIDENCE FOR THE EVALUATION OF GDP PARAMETERS
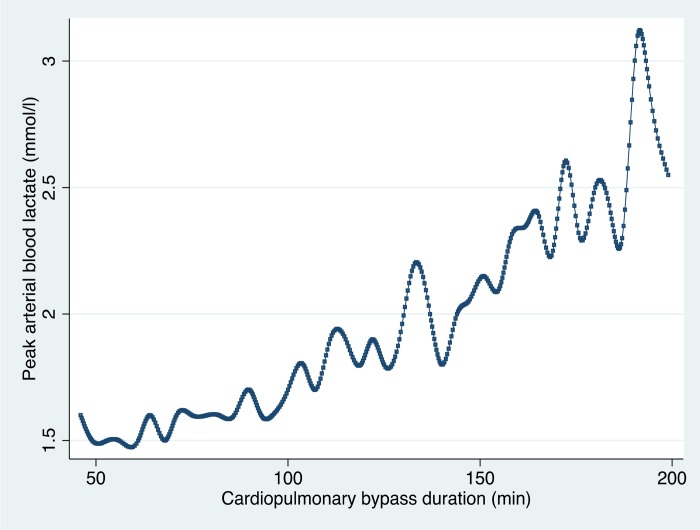
In 2006, Ranucci et al. (9) reported a study that described determinants of hyperlactatemia during CPB and its impact on postoperative outcome. They demonstrated a relationship between the duration of bypass and peak arterial lactate in 470 patients. Using ANZCPR data, this result was reproduced in a sample of 12,397 patients (Figure 5).
Figure 5.
Peak arterial blood lactate value during CPB according to the CPB duration. The plot shows the cubic spline values, calculated as the medians of both variables at equal time intervals (ANZCPR, unpublished data).
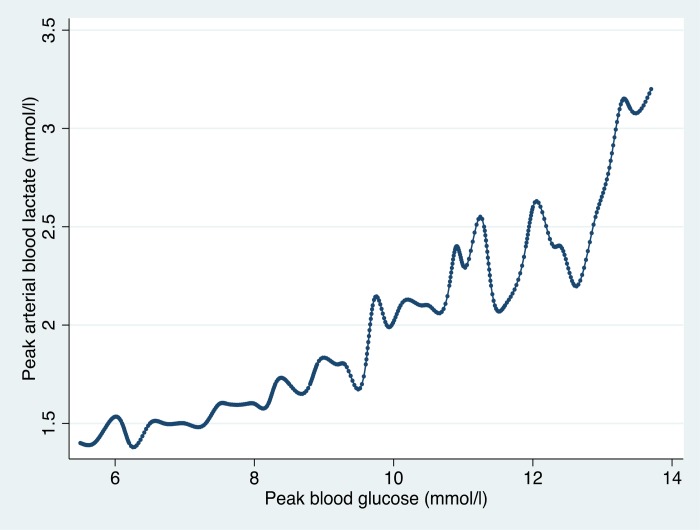
Similarly Ranucci demonstrated a relationship between peak blood glucose, and peak blood lactate production that was replicated in the ANZCPR data (Figure 6). The inflection point for increasing lactate in the ANZCPR data was similar to that reported by Ranucci.
Figure 6.
Peak arterial blood lactate value during CPB according to the peak blood glucose value. The plot shows the cubic spline values, calculated as the medians of both variables at equal blood glucose intervals (ANZCPR, unpublished data).
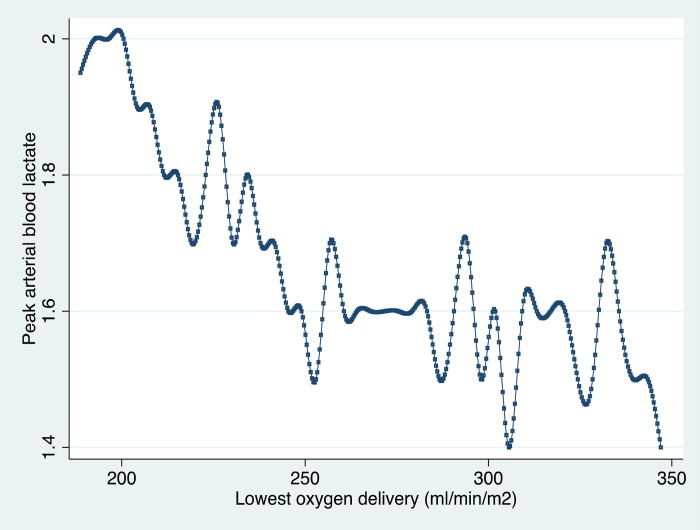
Finally looking at lowest oxygen delivery and lactate production, the pattern that Ranucci demonstrated in his study and theDO2i cutoff value reported (approximately 260 mL/min/m2) were supported by the larger ANZCPR sample (Figure 7).
Figure 7.
Peak arterial blood lactate value during CPB according to the lowest oxygen delivery. The plot shows the cubic spline values, calculated as the medians of both variables at DO2i intervals (ANZCPR, unpublished data).
In a single-center observational study of prospectively collected data during January and July 2015, 210 consecutive CPB procedures were collected on the ANZCPR database (9). Low oxygen delivery was assessed by calculating minimum 10-minute rolling averages for DO2i and DO2i/VCO2i ratios, and the area under the curve (AUC) for DO2i above or below 270 mL/min/m2 with data obtained from the Spectrum M4 monitor. AKI was defined as an increase in serum creatinine >50% from baseline to peak value postoperatively.
The AUC for DO2i was examined and those patients with a negative AUC had a 38% transfusion rate compared to only 8% those patients with a positive AUC, and an AKI rate of 20% compared to 7% respectively (Table 1). Looking at the DO2i, there was a significant difference between the two groups. It is important to reinforce that GDP parameters in this study were calculated using M4 data, this is important when examining the DO2i/VCO2i ratio data, with the ratio in the positive AUC group being 4.4 (9.5), and the negative AUC group was 3.6 (2.2), while not significantly different the ratio was higher in the group in which the AUC was positive.
Table 1.
AUC above or below DO2i 270 mL/min/m2 (calculated parameters measured using M4).
| AUC Above | AUC Below | p | |
|---|---|---|---|
| N = 89 | N = 121 | ||
| Received RBC transfusion | 8% | 38% | <.001 |
| AKI | 7% | 20% | =.007 |
| Nadir DO2i, L/min/m2 | 204 (179–232) | 159 (125 to 182) | <.001 |
| Average DO2i, L/min/m2 | 297 (24) | 228 (28) | <.001 |
| AUC DO2i, 270 L/min/m2 | 1,960 (681–3,507) | −3,080 (−4,968 to −1,299) | <.001 |
| Nadir DO2i/VCO2i | 4.4 (9.5) | 3.6 (2.2) | .817 |
RBC, red blood cell. Data, median (25–75th percentiles), mean (SD), or proportion of patients in %. AUC above, greater proportion of CPB with DO2 > 270 mL/min/m2; AUC below, greater proportion of CPB with DO2 < 270 mL/min/m2. VCO2i CO2 production (Modified from Newland and Baker [2]).
Looking at patients with and without AKI, those with AKI had DO2i's of 3.2 (3), and those without 4.2 (7.8) (Table 2). These data are different to those reported by Justison in a similar patient sample (54th AmSECT International Meeting, unpublished data) and De Somer et al. (7) who reported a DO2i/VCO2i ratio for patients without AKI of >5.
Table 2.
AUC above or below DO2i 270 mL/min/m2 (calculated parameters measured using M4).
| AKI | No AKI | p | |
|---|---|---|---|
| N = 30 | N = 181 | ||
| Nadir CPB Hct, g/L | 25 (4) | 27 (4) | .002 |
| Nadir DO2i, L/min/m2 | 170 (126 to 184) | 180 (147 to 210) | .08 |
| Average DO2i, L/min/m2 | 233 (40) | 261 (42) | .001 |
| AUC DO2i, 270 L/min/m2 | −2,956 (−6512 to −455) | −553 (−3,273 to 1,835) | .001 |
| Nadir DO2i/VCO2i | 3.2 (3) | 4.2 (7.8) | .258 |
RBC, red blood cell. Data, median (25–75th percentiles), mean (SD), or proportion of patients in %. AUC above, greater proportion of CPB with DO2 > 270 mL/min/m2; AUC below, greater proportion of CPB with DO2 < 270 mL/min/m2. VCO2i CO2 production (Modified from Newland and Baker [2]).
To investigate this, we examined the exhaust capnography data, and how the measurements were made. We found that the average GDP VCO2i using the CONNECT software was about 52, whereas using the M4 software, it was over 90. If we had a DO2i of 270, and a VCO2i of 50, and we use CONNECT VCO2i data, this would give us a DO2i/VCO2i ratio of 5; however, if we use M4 data and had a VCO2i of 94, then our ratio would be 2.9. Therefore knowing the measurement device is extremely important in interpreting these results as to develop clinical practice using GDP parameters we need to develop reliability in and an understanding of our measurements.
Therefore, there needs to be consensus on how we define GDP parameters. Should we use intermittent or continuous measurements for these calculations? Over what period, do we define the lowest flow during bypass? The electronic medical record has almost unlimited potential in providing data which will aid in developing decision support for CPB; however, it also provides us with an enormous amount of data to interpret and we need to understand the data that clinicians may potentially respond to. A number of commercial systems are available and can be leveraged by the perfusion community to provide reliable and reproducible data, but most importantly clinicians require the data to be well defined. It is not appropriate to just collect calculated data, we need to collect raw data such that we can use the data to look more deeply into phenomena such as DO2i and its relationship to adverse outcomes of CPB such as AKI.
In conclusion, the impact of oxygen delivery and carbon dioxide production on the outcomes of cardiac surgical patients has always been a driving force in how CPB is performed, additional understanding of the physiology of bypass can only provide benefits to patient's outcomes.
ACKNOWLEDGMENTS
The author would like to thank Richard Newland, Advanced Perfusionist, at Flinders Medical Centre and Project Manager for the ANZCPR, who has worked on much of the work presented the Cardiac Surgical Research Group at Flinders Medical Centre and the participants of the ANZCPR.
REFERENCES
- 1. Ranucci M., Romitti F., Isgrò G., et al. Oxygen delivery during cardiopulmonary bypass and acute renal failure after coronary operations. Ann Thorac Surg. 2005;80:2213–20. [DOI] [PubMed] [Google Scholar]
- 2. Newland R. F., Baker R. A.. Low oxygen delivery as a predictor of acute kidney injury during cardiopulmonary bypass. J Extra Corpor Technol. 2017. (in press). [PMC free article] [PubMed] [Google Scholar]
- 3. CONNECT formula , Sorin CONNECT™ Operating Instructions, Version 01/2013 - GA-45-90-14.00 ENG.
- 4. Potger K. C., McMillan D., Southwell J., Dando H., O'Shaughnessy K.. Membrane oxygenator exhaust capnography for continuously estimating arterial carbon dioxide tension during cardiopulmonary bypass. J Extra Corpor Technol. 2003;35:218–23. [PubMed] [Google Scholar]
- 5. Baraka A., El-Khatib M., Muallem E., Jamal S., Haroun-Bizri S., Aouad M.. Oxygenator exhaust capnography for prediction of arterial carbon dioxide tension during hypothermic cardiopulmonary bypass. J Extra Corpor Technol. 2005;37:192–5. [PMC free article] [PubMed] [Google Scholar]
- 6. Song J. G., Lee E. H., Choi D. K., Chin J. H., Choi I. C.. Differences between arterial and expired carbon dioxide during robotic cardiac surgery. J Cardiothorac Vasc Anesth. 2011;25:85–9. [DOI] [PubMed] [Google Scholar]
- 7. de Somer F., Mulholland J. W., Bryan M. R., Aloisio T., Van Nooten G. J., Ranucci M.. O2 delivery and CO2 production during cardiopulmonary bypass as determinants of acute kidney injury: Time for a goal-directed perfusion management? Crit Care. 2011;15:R192. [DOI] [PMC free article] [PubMed] [Google Scholar]
- 8. Justison G. Goal Directed Perfusion Symposium, 54th AmSECT International Meeting, Colorado Springs, Colorado, March 19, 2016. J Extra Corpor Technol. 2017;49:P13–18. [Google Scholar]
- 9. Ranucci M., De Toffol B., Isgro G., Romitti F., Conti D., Vicentini M.. Hyperlactatemia during cardiopulmonary bypass: Determinants and impact on postoperative outcome. Crit Care. 2006;10:R167. [DOI] [PMC free article] [PubMed] [Google Scholar]


