

Abstract
Whether activated inflammatory macrophages can adopt features of tissue resident macrophages and what mechanisms mediate this phenotypic conversion remain unclear. Here we show that vitamin A was required for phenotypic conversion of interleukin 4 (IL-4)-activated monocyte-derived F4/80intCD206+PD-L2+MHCII+ macrophages into macrophages with a tissue-resident F4/80hiCD206−PD-L2−MHCII−UCP1+ phenotype in the peritoneal cavity of mice and during liver granuloma formation in mice infected with Schistosoma mansoni. Phenotypic conversion of F4/80intCD206+ macrophages into F4/80hiCD206− macrophages was associated with almost complete remodeling of the chromatin landscape, as well as alteration of the transcriptional profiles. Vitamin A deficient mice infected with S. mansoni had disrupted liver granuloma architecture and increased mortality, indicating that failure to convert from F4/80intCD206+ macrophages to F4/80hiCD206− macrophages may lead to dysregulated inflammation during helminth infection.
Under steady-state conditions, most tissue-resident macrophages in the peritoneal cavity and liver are derived from embryonic precursors seeded during fetal development. These fetal-derived macrophages maintain themselves in the tissues through self-renewal, independent of bone marrow hematopoiesis1. However, at some mucosal surfaces, especially the intestine2, there is a significant contribution of monocyte-derived macrophages that are of bone marrow origin, indicating that exposure to the environment may increase the rate of macrophage replenishment from monocytes even under homeostatic conditions. During an inflammatory response, macrophages that infiltrate the tissues in response to pathogens are derived from blood monocytes3, 4. The fate of these inflammatory macrophages, and whether they eventually adopt a tissue-resident macrophage phenotype, is unclear. The tissue environment was shown to significantly influence the phenotype of transplanted mature macrophages5, 6, and monocytes can occupy the niche of tissue-resident macrophages when it becomes available7, 8. However, the mechanisms that enable the conversion of monocytes into tissue-resident macrophages are unknown and may be tissue specific.
Granulomas are organized structures made of macrophages recruited during an inflammatory response. The liver granulomas that form around the extracellular eggs of the multicellular trematode Schistosoma mansoni are driven by a type2 immune response9, and are critical in limiting the amount of tissue damage and hepatotoxicity and for the survival of the mammalian host 10, 11. The macrophages in these granulomas respond to interleukin 4 (IL-4) and/or IL-13 through IL-4R-and STAT6-mediated signaling to adopt an Arg1+Retnla+Chi3l3+ alternatively activated macrophage phenotype12, 13 (hereafter referred to as AAM, unless otherwise specified). Macrophage and neutrophil-specific IL-4Rα-deficient mice, which lack AAM, die during acute S. mansoni infection14. These AAMs are also PD-L2+CD206+ and are derived from inflammatory Ly6Chi monocytes15, 16, which in turn are dependent on expression of CCR216 and on CD4+ T helper cells15 for recruitment into tissues. In some cases, such as infection with the filarial nematode Litomosoides sigmodontis17 or the gastrointestinal nematode Heligmosomoides polygyrus18, AAMs can also derive from F4/80hiCD206− tissue-resident macrophages that expand through proliferation. IL-4 can induce the proliferation and the expression of Arg1, Retnla and Chi3l3 in macrophages regardless of their embryonic or adult bone marrow origin19. Hence, type 2 immune responses can induce AAM derived from either Ly6Chi monocytes or F4/80hiCD206− tissue-resident macrophages. These in vivo-derived AAM have a gene expression phenotype similar to bone marrow derived macrophages activated with IL-4 in vitro (often referred to as M2 macrophages), namely expression of Arg1, Retnla and Chi3l312. Arginase1 (encoded by Arg1) in particular inhibits fibrosis and type 2 inflammation in the liver during S. mansoni infection20.
AAMs derived from the proliferation of local F4/80hiCD206− tissue-resident macrophages are phenotypically distinct from AAMs derived through recruitment of Ly6Chimonocytes. Monocyte-derived AAMs express the costimulatory ligand PD-L2 and can induce the differentiation of CD4+Foxp3+ Treg cells via retinoic acid, whereas F4/80hiCD206− tissue-resident macrophages are PD-L2-negative and upregulate the mitochondrial thermogenic protein UCP119. As acute inflammation transitions to chronic inflammation in the tissue, inflammatory macrophages may adopt the phenotype of tissue-resident macrophages21, 22.
Vitamin A deficiency is a common micronutrient deficiency, often affecting individuals in regions of the world endemic for chronic helminth infections23. Retinoic acid is a metabolite of vitamin A that has multiple roles in regulating both innate and adaptive immunity24, including activation of the transcription factor GATA625 to induce differentiation of F4/80hi peritoneal macrophages. Here, we show that vitamin A was required for the conversion of monocyte-derived F4/80intCD206+PD-L2+MHCII+ macrophages into a tissue resident F4/80hiCD206−PD-L2−MHCII−UCP1+ macrophage phenotype in the peritoneal cavity and in liver granulomas during S. mansoni infection.
RESULTS
Conversion of AAMmono into a tissue resident AAMres phenotype
Injection of recombinant IL-4 complex (IL-4c) into the peritoneal cavity of C57BL/6 mice induces accumulation of F4/80hiCD206−PD-L2−MHCII−UCP1+ macrophages, which are derived from tissue-resident F4/80hiCD206− peritoneal macrophages of embryonic origin19, while injection of IL-4c and thioglycollate (Thio) induces the accumulation of F480intCD206+PD-L2+MHCII+ cells, which derive from Ly6Chi inflammatory blood monocytes19. To investigate if inflammatory macrophages can undergo phenotypic conversion into a tissue-resident macrophage phenotype, we sorted F480intCD206+PD-L2+MHCII+cells (hereafter referred to as AAMmono, unless otherwise specified) from Thio+IL-4c-treated CD45.1 C57BL/6 mice and transferred them through intraperitoneal injection into CD45.2 C57BL/6 mice untreated or treated with two doses of IL-4c over 4 days. Transferred peritoneal CD45.1+C57BL/6 AAMmono cells downregulated the expression of PD-L2 after transfer in untreated, but not in IL-4c-treated recipient mice, whereas expression of CD206 was maintained in both hosts (Fig. 1a), indicating that expression of PD-L2 on AAMmono was modulated and sensitive to the continued presence of IL-4 in vivo, whereas expression of CD206 and MHC class II (Supplementary Fig. 1a–c) was maintained in this time frame. CD11b+F4/80hiCD206+ macrophages isolated from Thio-treated mice, which do not express PD-L2, induced expression of PD-L2 after two doses of IL-4c treatment over 4 days of the recipient mice, but not in untreated recipients (Supplementary Fig. 1a–c).
Figure 1. Monocyte-derived inflammatory macrophages adopt a tissue resident phenotype after long-term residency in the peritoneal cavity.
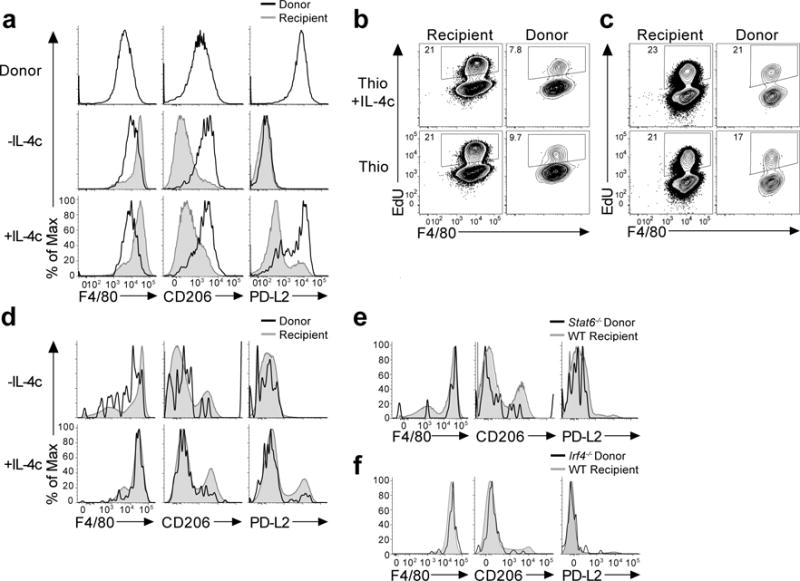
(a) PD-L2 is rapidly downregulated while CD206 expression is retained on AAMmono. Adoptive transfer i.p.of thioglycollate + IL-4c elicited monocyte-derived macrophages from CD45.1 donor mice into CD45.2 recipient mice, rested for 24hrs and then treated +/- IL-4c prior to analysis. Representative FACS plots displaying expression of CD206, PD-L2, and F4/80 on Thio+IL-4c macrophages before transfer and gated on recipient (grey) or donor (blue) cells from recipient mice treated +/− IL-4c, 8 weeks after transfer. Representative histograms display surface expression of F4/80, CD206, PD-L2 in Donor CD45.1+ CD45.2− (Black line) and recipient CD45.1−, CD45.2+ (Grey shaded) CD11b+, F4/80+ macrophages. (b) Long-term transfer of monocyte-derived inflammatory macrophages from CD45.1 donor mice treated with either thioglycollate or thioglycollate and IL-4c, into CD45.2 recipient mice and rested for 8 weeks prior to treatment with +/- IL- 4c. Representative histograms of CD206, PD-L2, and F4/80 expression on donor and recipient CD11b+ macrophages. (c-d) Increased proliferative capacity of macrophages after long-term residency. Representative FACS plots showing the frequency of EdU+ cells in recipient (Rec) and donor (Don) populations in response to IL-4c given after transfer of thioglycollate elicited (Thio) or (Thio+IL-4c) elicited macrophages and resting for 24hrs for short term residency (c) or long term residency for 8 weeks (d). (e) STAT6 is not required for conversion to a tissue resident phenotype. Representative expression of F4/80, CD206 and PD-L2 on donor CD45.2+ CD45.1−Stat6−/− (Black) and CD45.1+ CD45.2− WT recipient (Grey shaded) CD11b+ cells. (f) IRF4 is not required for conversion to a tissue resident phenotype. Expression of F4/80, CD206, PD-L2 in donor CD45.2+ CD45.1− (Black) and recipient CD45.2−, CD45.1+ (Grey shaded) CD11b+ cells.
We also transferred F4/80hiCD206−PD-L2−MHCII−UCP1+ macrophages (hereafter referred to as AAMres, unless otherwise specified) from IL-4c-treated CD45.1 C57BL/6 mice into the peritoneal cavity of recipient CD45.2 C57BL/6 mice. The AAMres phenotype was maintained in the peritoneal cavity for 5 days on CD45.1+ donor macrophages transferred into IL-4c-treated or untreated recipient mice (Supplementary Fig. 1d). However, following transfer into mice treated with Thio+IL-4c 24hrs after transfer, donor CD45.1+AAMres cells could not be detected in the peritoneal cavity of recipient mice 4 days later (Supplementary Fig. 1e), an observation that could be reminiscent of the macrophage disappearance reaction of tissue-resident F4/80hi peritoneal macrophages26.
In time-course experiments, one week post a single intraperitoneal injection with Thio or Thio+IL-4c into wild-type C57/BL6 mice, CD11b+ macrophages were F4/80intCD206+, whereas 4 weeks after injection, CD11b+ peritoneal macrophages were F4/80hiCD206+ (Supplementary Fig. 2a). Eight weeks post-intraperitoneal injection with Thio, CD11b+ peritoneal macrophages were F4/80hiCD206–, similar to naïve untreated mice (Supplementary Fig. 2a). We also examined the long-term fate of F480intCD206+PD-L2+ AAMmono cells from Thio+IL-4c-treated CD45.1 mice following transfer into the peritoneal cavity of untreated CD45.2 recipient mice (Fig. 1b). Eight weeks after transfer, less than 0.05% of total peritoneal cavity CD45.1+ cells were detected in the peritoneal cavity, yet they could be rapidly expanded over 4 days by injection of IL-4c in the recipient mice (Supplementary Fig. 2b). Following this IL-4c-driven expansion after 8 weeks, donor CD45.1+ macrophages were F4/80hiCD206−PD-L2– (Fig. 1b), suggesting that PD-L2 was not reinduced. Hence, following 8 weeks of residence in the peritoneal cavity, transferred AAMmono had adopted a F4/80hiCD206−PD-L2–AAMres phenotype.
We next examined how environmental changes altered the proliferative capacity of transferred macrophages as measured by 5-ethynyl-2′-deoxyuridine (EdU) incorporation 3 hours prior to harvest. More CD45.1+ donor cells were detected in mice transferred with F480intCD206+ macrophages from Thio+IL-4c-treated donors compared to recipients of F480intCD206+macrophages from Thio-treated donors (Supplementary Fig. 2c). However, 5 days post-transfer, both type of donor CD45.1+ macrophages had proliferated less than host CD45.2+AAMres cells after 4 days of IL-4c treatment (Fig. 1c). However, 8 weeks after transfer, donor CD45.1+macrophages from both Thio- and Thio+IL-4c-treated donors had incorporated EdU at similar levels as F480hiCD206− host resident peritoneal macrophages (Fig. 1d), indicating that after long-term residence in the peritoneal cavity transferred AAMmono had adopted the proliferative capacity of AAMres macrophages. As such, Ly6Chi monocyte-derived F480intCD206+ macrophages can undergo conversion into tissue resident-like F480hiCD206− macrophages.
The transcription factors STAT6 and IRF4 regulate expression of genes (e.g. Retnla) induced by IL-4 in macrophages14, 27. F480intCD206+ macrophages isolated from 4 days post Thio-treated CD45.2Stat6−/− mice and transferred into wild-type CD45.1 mice that were treated with IL-4c for 4 days did not upregulate PD-L2 (Supplementary Fig. 2d). Transferred Stat6–/–F4/80intCD206+ macrophages did not increase EdU incorporation more than control PBS treated mice in response to IL-4c treatment for 4 days (Supplementary Fig. 2e). However, they were F4/80hiCD206− 8 weeks after transfer (Fig. 1e), indicating that STAT6 is not required for the conversion to a tissue-resident phenotype, but may regulate proliferation. Similarly, transferred Irf4–/–F480intCD206+ macrophages adopted a tissue-resident F4/80hiCD206− phenotype and did not induce PD-L2 expression in IL-4c-treated recipient mice 8 weeks post-transfer (Fig. 1f), indicating that the conversion of Ly6Chi monocyte-derived F480intCD206+ into tissue resident-like F480hiCD206− macrophages is independent of both STAT6 and IRF4.
CX3CR1+ derived cells adopt a tissue-resident phenotype
AAMmono express CX3CR119 and can be tracked in Cx3cr1CreERT2-IRES-EYFP mice (hereafter Cx3cr1Cre), which express a tamoxifen (TAM)-inducible Cre recombinase (CreERT2) under the control of the endogenous Cx3cr1 promoter followed by an IRES-EYFP element28. To trace the fate of Cx3cr1Cre+cells without using adoptive transfers, we crossed Cx3cr1CreERT2-EYFP/+ mice with Rosa26stop-tdTomato reporter mice (hereafter R26tdTomato). We analyzed peritoneal macrophages in Cx3cr1CreERT2-EYFP/+ R26tdTomato/+ mice injected i.p. with Thio or Thio+IL-4c 1, 4 and 8weeks while simultaneously labeling Cx3cr1Cre+ cells with a single dose of TAM, which irreversibly labels CX3CR1+ cells and their progeny by inducing expression of tdTomato. One week after Thio+IL-4c injection, peritoneal CD11b+tdTomato+ macrophages were 94.6% F4/80intCD206+, whereas 4 weeks after Thio+IL-4c injection 55.7% of CD11b+tdTomato+ macrophages were F4/80hiCD206+. Eight weeks post-treatment, 32.7% of CD11b+tdTomato+ cells had adopted a F4/80hiCD206– tissue-resident phenotype (Fig. 2a). CD11b+tdTomato+ macrophages can be induced to be PD-L2+ with 4 days of IL-4c treatment at 4 weeks, while those CD11b+tdTomato+ cells that have persisted in the peritoneal cavity at 8 weeks could no longer be induced to express PD-L2 by IL-4c treatment and expressed lower amounts of MHC class II (Fig. 2b,c). Hereafter we refer to these converted tdTomato+F4/80hiCD206– cells as AAMconv, to distinguish them from F4/80hiCD206–AAMres that are tdTomato−.
Figure 2. Fate mapping monocyte derived macrophages adopting a tissue resident phenotype after long-term residency in the peritoneal cavity.
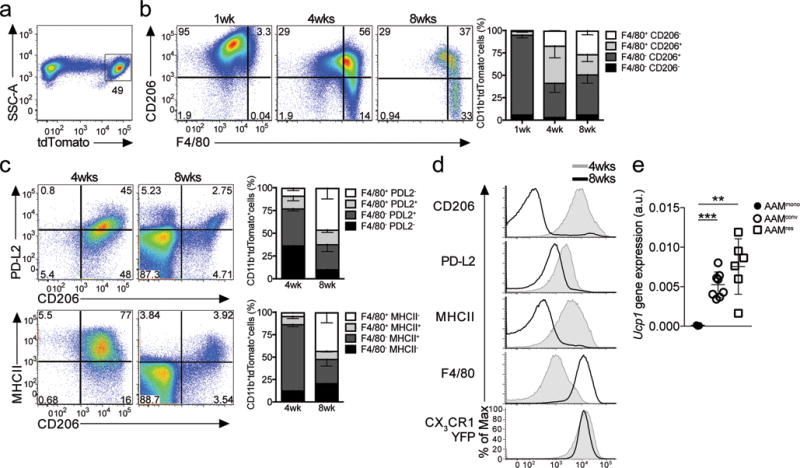
(a) Tamoxifen (TAM) pulse-administration and IL-4c treatment (i.p.) in Cx3cr1CreERT2-IRESYFP/+Rosa26floxed-tdTomato/+ mice previously injected with thioglycollate at 1 week (n=4), 4 weeks (n=4) or 8 weeks (n=4) post-tamoxifen gavage. (a–c) Representative flow cytometric analysis of CD206 (a) or PD-L2 or MHCII (b) and F4/80 expression on (singlet, live, Siglec-F−) CD11b+ tdTomato+ cells (a) from Cx3cr1CreERT2-IRESYFP/+ Rosa26floxed-tdTomato/+ mice injected with thioglycollate + IL- 4c and analyzed at 1, 4, and 8 weeks post-tamoxifen gavage. (a) Stacked bar graph showing the relative proportion of F4/80 and/or CD206 expression (a) in CD11b+ tdTomato+ cells, or (c–d) F4/80 and/or PDL2/MHCII expression. (c) Representative flow cytometry plots of PD-L2, CD206 and MHCII expression in CD11b+ tdTomato+ cells after IL-4c treatment in Cx3cr1CreERT2-IRESYFP/+Rosa26floxed- tdTomato/+ mice pulsed with TAM and injected with thioglycollate 4 weeks (n=6) or 8 weeks (n=3) prior. (d) Converted macrophages (AAMconv) gain expression of UCP1. Expression of UCP1 by RT-PCR on FACS sorted in CD11b+ tdTomato+CD206+F4/80int 4 days after Thio+IL-4c treatment (AAMmono; n=3), relative to CD11b+ tdTomato−CD206−F4/80high cells from naïve Cx3cr1CreERT2-IRESYFP/+Rosa26floxed- tdTomato/+ mice treated with IL-4c only (AAMres; n=6) and CD11b+ tdTomato+ CD206−F4/80high cells 8 weeks post thioglycollate treatment (AAMconv; n=8).
RT-PCR analysis of AAMconv cells sorted from the peritoneal cavity 8 weeks after Thio treatment, and treated with IL-4c for 4 days before harvest, indicated that in addition to losing the expression of CD206 and PD-L2, AAMconv cells induced expression of UCP1, comparable to AAMres in naïve mice (Fig. 2d). As such, genetic fate-mapping experiments reproduced the results of the adoptive transfer and indicated that 8 weeks post an inflammatory response in the peritoneal cavity, recruited CX3CR1+ monocyte-derived cells had adopted a tissue-resident peritoneal macrophage phenotype.
AAMconv acquire transcriptional and chromatin profiles of AAMres
To further examine whether monocyte-derived inflammatory macrophages were truly re-programmed towards homeostatic, tissue-resident macrophages, we did global transcriptional profiling using RNA-seq and mapped chromatin accessibility regions using ATAC-seq in tdTomato+F4/80intCD206+ (AAMmono) and tdTomato– F4/80hiCD206– (AAMres) cells isolated 4 days after Thio+IL-4c or IL-4c respectively, and tdTomato+F4/80hiCD206– (AAMconv) cells isolated 4 days after IL-4c following Thio injection 10 weeks prior to IL-4c treatment, from Cx3cr1CreERT2-EYFP/+ R26tdTomato/+mice kept on a continuous TAM diet to label all CX3CR1+ monocyte-derived cells during the treatment period (Fig. 3a).
Figure 3. Transcriptional and chromatin landscape re-programming during macrophage conversion.
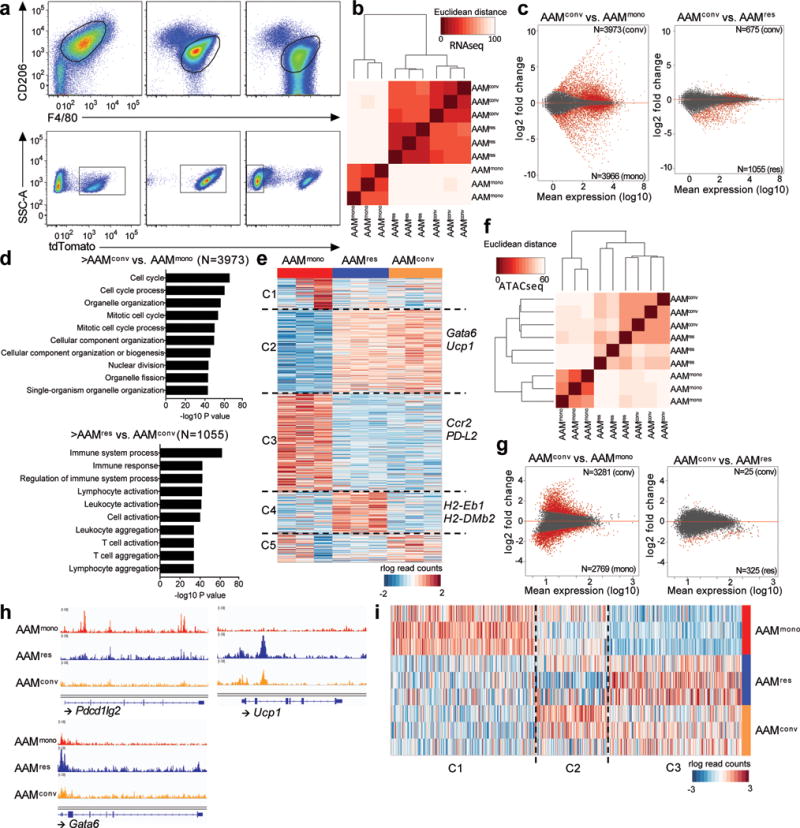
(a) Representative flow plots showing gating strategies for three different populations of macrophages (AAMmono: n=3, AAMres: n=3, AAMconv, n=3). (b) Pairwise Euclidean distance with respect to the transcriptional profiles from each sample showing AAMconv transcriptionally resembles AAMres. (c) MA plots of differential analyses comparing the transcriptional profiles of AAMconv to that of AAMmono and AAMres, respectively. Differential genes (FDR 10%, |LFC| > 0) are highlighted in red. (d) GO analysis of genes upregulated in AAMconv when compared to AAMmono (top), as well as genes downregulated in AAMconv when compared to AAMres (bottom). (e) Clustering of rlog-transformed read counts of expressed genes in AAMmono, AAMres and AAMconv showing 5 different clusters of genes (C1–C5). (f) Pairwise Euclidean distance with respect to the accessible REs from each sample showing the open chromatin landscape in AAMconv resembles that of AAMres. (g) MA plots of differential analyses comparing the accessible Res in AAMconv to that of AAMmono and AAMres, respectively. Differential regions (FDR 10%, |LFC| > 0) are highlighted in red. (h) Genome browser views of the Pdcd1lg2 (PDL2), Ucp1 and Gata6 gene bodies in AAMmono (red track), AAMconv (blue track) and AAMres (orange track). Each track represents normalized read counts of accessible chromatin regions. (i) Clustering of rlog-transformed read counts of accessible REs in AAMmono, AAMres and AAMconv showing 3 different clusters of REs (C1–C3).
RNA-seq showed that AAMconv had a gene expression profile similar to AAMres by pairwise Euclidean distance calculation (Fig. 3b), principal component analysis (PCA) (Supplementary Fig. 3), and Pearsons correlation analysis (Supplementary Fig. 3), despite sharing tdTomato expression with AAMmono. Differential analysis identified 7939 genes that were differentially expressed between AAMconv and AAMmono, of which 3973 genes were more highly expressed in AAMconv (Fig. 3c). Many of these genes were enriched for gene ontology (GO) annotations involving the cell cycle (Fig. 3d), which may reflect the increased proliferative capacity of AAMconv. Of the 1730 genes differentially expressed between AAMconv and AAMres, most (1055) genes were more highly expressed in AAMres (Fig. 3c), indicating that AAMconv had acquired most, but not all of the transcriptional features of AAMres. In addition, the log fold changes of these differential genes between AAMconv and AAMres were of lesser magnitude than the log fold changes of differential genes between AAMconv and AAMmono (Fig. 3c). Unsupervised clustering analysis of expressed genes across AAMmono, AAMconv and AAMres showed that most of the transcriptional profile in AAMconv (11042 genes in k-means clusters C2 and C3) resembled that of AAMres (Fig. 3e). However, there remained a subset of genes (2632 genes in k-means cluster C4) expressed in AAMres that were not acquired by AAMconv (Fig. 3e).
In parallel with the RNA-seq, we used ATAC-seq to identify regulatory elements that are transposase-accessible in the populations of macrophages analyzed. At a global level, the chromatin profiles of AAMconv were more similar to AAMres than AAMmono, as indicated by pairwise Euclidean distance calculation (Fig. 3f), pairwise Pearson’s correlation (Supplementary Fig. 3) and PCA (Supplementary Fig. 3). Despite the common lineage from CX3CR1+ cells, differential analysis comparing tdTomato+AAMconv to tdTomato+AAMmono revealed greater differences in chromatin profiles (6050 differential regulatory elements) than when AAMconv were compared to tdTomato−AAMres (350 differential REs), and the differences were of greater magnitude (Fig. 3g). Specific gene analysis indicated that distinct regulatory elements at the Pdcd1lg2 locus (encoding PD-L2) were only accessible in AAMmono but not in AAMconv (Fig. 3h), consistent with the cell surface expression of PD-L2, while AAMconv cells gained accessibility to the Ucp1 locus, which was also accessible in AAMres but not in the AAMmono cells (Fig. 3h). Notably, the Gata6locus was accessible in AAMmono cells (Fig. 3h) even in the absence of GATA6 expression (Fig. 3g), which may indicate a role for functional plasticity. As such, the differences in regulatory element accessibility and chromatin landscapes correlated with the functionality of AAMmono, AAMres and AAMconv cells. Unsupervised clustering analysis of the accessible regulatory elements in AAMmono, AAMres and AAMconv assigned the regulatory elements to three different clusters, of which C1 (14075 regulatory elements) contained largely AAMmono-specific regulatory elements, while C3 contained 13280 regulatory elements that were common to both AAMconv and AAMres(Fig. 3i), similar to the findings of the supervised differential analyses. Hence, AAMconv have transcriptional and chromatin profiles more similar to AAMres, than AAMmono despite being derived from the same CX3CR1+ lineage as AAMmono.
Vit-A-deficient mice have defective generation of AAMres cells
Because retinoic acid can induce GATA6 dependent peritoneal macrophage differentiation25, we generated vitamin A-deficient C57BL/6 wild-type mice that were maintained on a vitamin A deficient diet beginning at day 10 of gestation (Vit-ADEF), in comparison to wild-type mice maintained on a control diet (Vit-ACON). Vit-ADEF mice at 8 weeks lacked F4/80hiCD206– resident peritoneal macrophages (Fig. 4a), consistent with previous reports25. While the total number of peritoneal cells at steady-state were lower in Vit-ADEF compared to Vit-ACON (Supplementary Fig. 4), the total number and % of F4/80intCD206+ macrophages (Fig. 4a and Supplementary Fig. 4) was increased compared to controls. FSCloSSChi granulocytes were also increased compared to Vit-ACON (data not shown), as previously described29. Intraperitoneal injection of IL-4c in Vit-ADEF mice induced the expansion of F4/80intPD-L2+AAMmono cells, compared to the expansion of F4/80hiPD-L2–AAMres cells in Vit-ACON (Fig. 4b). The proliferation of peritoneal CD11b+F4/80+ macrophages following IL-4c treatment, as determined by incorporation of EdU, was also significantly reduced in Vit-ADEF mice compared to Vit-ACON mice (Fig. 4c), suggesting that inflammatory F4/80intCD206+ macrophages accumulate in Vit-ADEF mice. Vit-ADEF mice that were treated with all-trans retinoic acid every 2 days for 14 days prior to IL-4c treatment have 33% F4/80hiPD-L2−AAMres cells compared to 0.3% in DMSO control treated Vit-ADEF mice, but 50% of the CD11b+ macrophages have a CD206+F4/80hiPD-L2+ intermediate phenotype (Fig. 4d). These results indicate that vitamin A and retinoic acid may regulate the balance between inflammatory and tissue resident macrophages in the peritoneal cavity.
Figure 4. Vitamin A deficiency disrupts tissue resident macrophages.
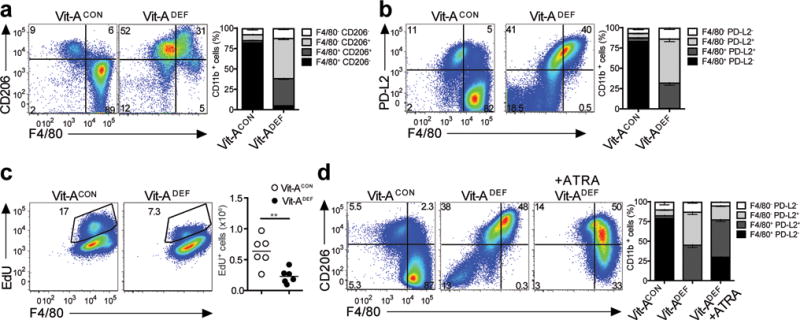
Peritoneal macrophages were evaluated from either vitamin A deficient (Vit-ADEF) mice or control (Vit-ACON) mice after treatment with IL-4c or without treatment. Representative FACS plots for (a) Flow cytometry analysis of peritoneal macrophage Vit-ADEF(n=7) and Vit-ACON(n=7) mice. Stacked bar graph shows increased frequencies of F4/80+ CD206+and F4/80+ CD206−expressing CD11b+populations; and (b) Flow cytometry analysis of peritoneal macrophages from Vit-ADEF(n=5) and Vit-ACON(n=5) mice. Stacked bar graph shows increased frequencies PD-L2 and F4/80 expression. (c) EdU incorporation from peritoneal macrophages of IL-4c treatedVit-ADEF(n=8) and Vit-ACON(n=6) mice. (d) Vit-ADEFmice were treated with all-trans RA every 2 days for 14 days prior to IL-4c treatment. Representative FACS plots of PD-L2 expression in peritoneal macrophages of Vit-ACON(n=5), Vit-ADEF(n=5), and Vit-ADEFmice treated with all-trans RA (ATRA) (n=5). Stacked bar graph indicates frequencies of F4/80 and PD-L2 in CD11b+ cells. **P < 0.01. Unpaired Students T-test.
Vit-A deficiency disrupts AAMmono to AAMres conversion
We next tested if vitamin A deficiency impacts the long-term conversion of monocyte-derived F4/80intCD206+ macrophages into F4/80hiCD206− tissue resident macrophages. F4/80intCD206+ macrophages from CD45.1 mice treated with Thio were transferred into CD45.2 Vit-ADEF or Vit-ACON mice, which received IL-4c i.p. injections 8 weeks post-transfer (Fig. 5a). The number of CD45.1+ macrophages recovered from Vit-ADEF recipients 4 days after IL-4c treatment was reduced 2 fold compared to Vit-ACON recipient mice (Fig. 5a). CD45.1 mice treated directly with IL-4c without adoptive transfer were used as FACS gating and staining controls. At 8 weeks post-transfer into CD45.2 Vit-ACON mice, donor CD45.1+F4/80+ macrophages were 91.5% PD-L2−CD206− (Fig. 5b–d), indicating conversion into tissue resident macrophages. In contrast, 73.6% of donor CD45.1+F4/80+ macrophages transferred into Vit-ADEF mice were PD-L2+CD206+ (Fig. 5b–d) and had lower expression of F4/80 and higher expression of MHCII than donor macrophages in Vit-ACON mice, which were PD-L2−CD206− (Fig. 5c,d), indicating that a vitamin A deficient environment disrupts inflammatory macrophages conversion into a tissue-resident phenotype.
Figure 5. Phenotypic conversion of inflammatory macrophages to a tissue resident phenotype is disrupted in Vitamin A-deficient mice.
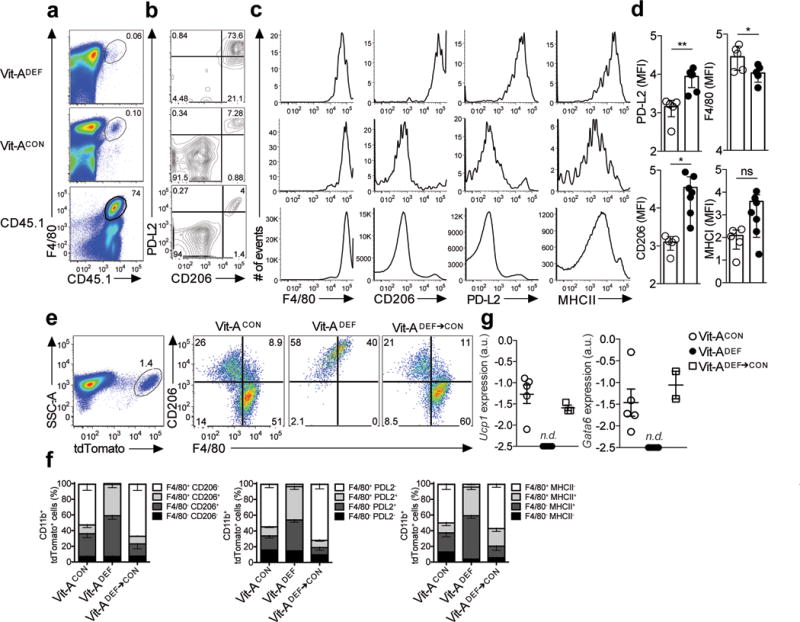
(a) Long-term transfer of monocyte-derived inflammatory macrophages from thioglycollate treated CD45.1 donor mice into CD45.2 recipient vitamin A deficient (Vit-ADEF) mice or control (Vit-ACON) mice, rested for 8 weeks and subsequently treated with IL-4c. Naïve CD45.1 mice were also treated with IL-4c (a) Representative FACS plots of F4/80+ CD45.1+ events and (b) PD-L2 and CD206 expression in CD45.1 cells after 8 weeks post reconstitution in Vit-ACON(n=5) or Vit-ADEF(n=5) mice. (c) Flow cytometry analysis of mean fluorescence intensity for F4/80, CD206, PD-L2 and MHCII in CD45.1 peritoneal macrophages. (d) Quantification of mean fluorescence intensities of F4/80, CD206, PD-L2 and MHCII in CD45.1 macrophages from Vit-ACON(n=5) or Vit-ADEF (n=7) mice. (e) Representative flow cytometry plots of CD206 and F4/80 frequencies in tdTomato+ peritoneal macrophages from Vit-ACON(n=9), Vit-ADEF(n=9) or Vit-ADEF mice switched onto Vit-ACON diet (Vit-ADEF→CON;n=3). (f) Stacked bar graph represents frequencies of F4/80 and CD206 from CD11b+ tdTomato+ cells. (g) RT-PCR analysis of Ucp1 and Gata6 expression in CD11b+ tdTomato+ peritoneal macrophages from (e) normalized to expression of GAPDH. Graphs depict mean ± standard error of the mean of individual mice pooled from 2 independent experiments. Data shown are the mean and s.e.m. ns = not significant, *P<0.05, ***P<0.001 unpaired Students T-test.
We also tested the requirement for vitamin A in inflammatory to resident-macrophage conversion in Cx3cr1CreERT2-EYFP/+ R26tdTomato/+ mice maintained on a vitamin A-deficient diet beginning at day 10 of gestation prior to TAM treatment and i.p. injection with Thio, followed by IL-4c injection eight weeks later. 4 days after IL-4c treatment 51.5% of tdTomato+ macrophages were F4/80hiCD206–PD-L2− in Cx3cr1CreERT2-EYFP/+ R26tdTomato/+ Vit-ACON mice, compared to 0% in Cx3cr1CreERT2-EYFP/+ R26tdTomato/+ Vit-ADEF mice (Fig 5e,f), indicating impaired conversion. Next we tested whether the accumulation of inflammatory macrophages in the Vit-ADEF mice was reversible. In Cx3cr1CreERT2-EYFP/+ R26tdTomato/+ Vit-ADEF mice switched back to control diet, 60% of tdTomato+ cells were F4/80hiCD206– after 8 weeks on a control diet (Fig. 5e,f). RT-PCR analysis of tdTomato+ macrophages sorted from Vit-ADEF and Vit-ACON Cx3cr1CreERT2-EYFP/+ R26tdTomato/+mice from these experiments indicated that Ucp1and Gata6 mRNA were only expressed in tdTomato+ AAMconv from Vit-ACON mice (Fig. 5g). However, Ucp1 and Gata6 mRNA expression was restored in tdTomato+ cells from Vit-ADEF mice 8 weeks after switch back to control diet (Fig. 5g). Thus, vitamin A sufficiency was required for the conversion of F4/80intCD206+ into F4/80hiCD206– macrophages in both an adoptive transfer model and the Cx3cr1CreERT2-EYFP/+ R26tdTomato/+mice.
Macrophages in S. mansoni granulomas are heterogenous
Arg1+Retnla+Chi3l3+PD-L2+ AAM in early liver granulomas of S. mansoni-infected mice are derived from inflammatory Ly6Chi monocytes15, 16. We next tested if macrophages convert to a AAMres phenotype as the granulomas mature in C57BL/6 mice infected with S. mansoni. S. mansoni eggs begin to be lodged in the liver between 5–6 weeks post infection. While we detected considerable heterogeneity between individual mice, Ucp1 mRNA expression was detectable in the liver by RT-PCR at 8 weeks post S. mansoni-infection (Fig. 6a), whereas it was undetectable in the liver of uninfected mice. Time course analysis indicated that Ucp1 was only detectable between 7–8 weeks post infection (Fig. 6b) indicating that at least 7 days post-egg deposition are required prior to mRNA expression of Ucp1 in the liver.
Figure 6. Increased Ucp1 expression and proliferation in mature egg liver granulomas of S. mansoni infected mice.
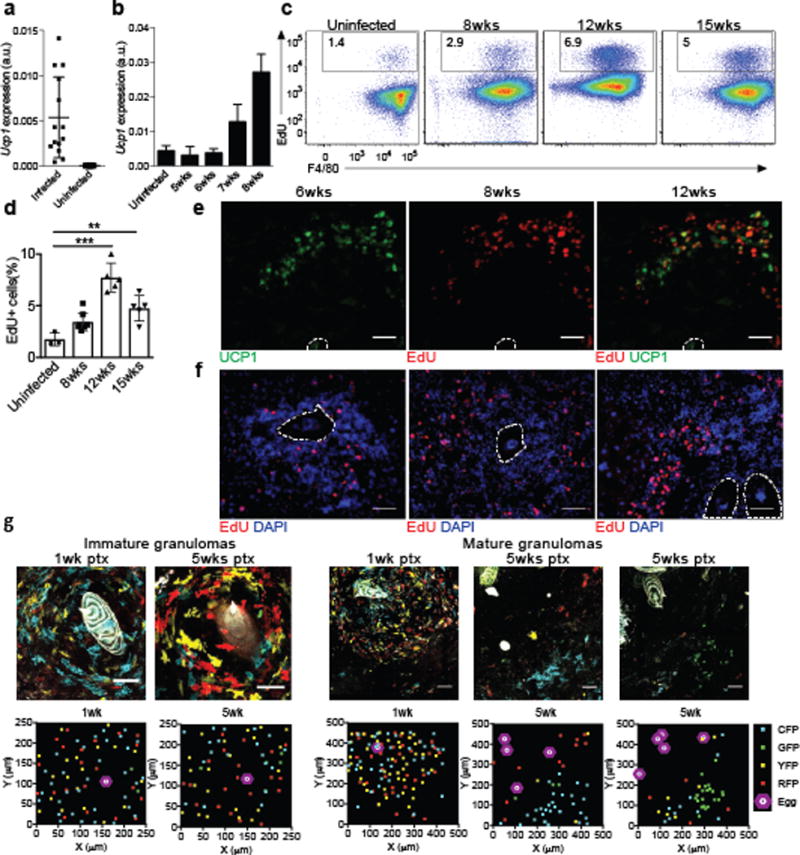
(a) Transcript expression of Ucp1 in whole liver from mice infected with S. mansoni at 8 weeks post infection (b) Time course of Ucp1 expression in the liver during S. mansoni infection. (c) Flow cytometric analysis showing the frequency of EdU+ F4/80+ cells from S. mansoni infected liver at the indicated time point. (d) Quantification of EdU+ F4/80+ cells at different time points during S. mansoni infection. (e) Representative immunofluorescence images of S. mansoni-infected liver mature granulomas stained with anti-UCP1 (green), and Click-it EdU (red). (f) Representative immunofluorescence images of S. mansoni-infected liver granulomas at different timepoints post infection stained with DAPI (blue) and Click-it EdU (red) taken from mice pulsed with EdU 3 hours prior to sacrifice. Eggs are outlined in white and scale bars represent 50 microns. (g) TAM pulse experiments with Cx3cr1CreERT2-IRESYFP/+Rosa26Brainbow2.1/+ mice infected with S. mansoni. Confocal images of immature granulomas (left) or mature granulomas (right) from livers of Cx3cr1CreERT2-IRESYFP/+Rosa26Brainbow2.1/+ mice infected with S. mansoni at 12 weeks post-infection given tamoxifen 1 week or 5 weeks prior to the sac. Scale bars = 50μm. XY scatter plots represent approximate localization of Brainbow2.1 fluorescent cells within above image. **P<0.01, ***P<0.001, unpaired Students T test.
Granuloma macrophages show no significant increase in proliferation at 8 weeks post infection15, 16. However, at 12 and 15 weeks post-infection more EdU+F4/80+ macrophages were detected in the livers of S. mansoni infected mice compared to uninfected mice (Fig. 6c,d), although expression of Ucp1 was not significantly greater at 12 weeks compared to 9 weeks post-infection (Supplementary Fig. 5a). We used a 3-hour pulse-labeling and EdU staining on tissue sections to determine if the pattern of UCP1 expression was associated with cells that have incorporated EdU in the liver granulomas at 8 weeks post-infection. UCP1 staining was not detected in small and immature granulomas (<200μm) and was observed predominantly at the periphery of histologically more mature and organized granulomas (>200μm) (Fig. 6e and Supplementary Fig. 5c). Whereas EdU+ cells were detected throughout the immature granuloma (Fig. 6f), EdU+ cells were only found in the periphery of the mature granulomas, where UCP1+ cells were also detected (Fig. 6e,f and Supplementary Fig. 5b,c), indicating that the distribution of proliferating cells was distinct as the granulomas matured and that there was partial overlap between proliferation and UCP1 expression.
To observe the clonal expansion of CX3CR1+ monocyte derived cells, we crossed the Cx3cr1CreERT2-IRES-EYFP mice to the Rosa26Brainbow2.1reporter mice30, which stochastically express one of four fluorescent proteins (GFP, YFP, RFP and CFP) when Cre expression is induced by TAM in CX3CR1+ cells to recombine the "Confetti" gene. In this system, proliferation of any CX3CR1+ cell produces progeny expressing the same fluorescent protein as the original cell, allowing tracing of proliferating clones, which appear as patches30. Cx3cr1CreERT2-EYFP/+Rosa26Brainbow2.1/+ mice were infected with S. mansoni and pulsed with TAM at either 7 or 11 weeks post-infection. At 12 weeks post-S. mansoni infection (i.e. 5 weeks or 1 week post-TAM) small and immature granulomas showed even distribution of different fluorescent dye-labeled cells in close proximity to the eggs (Fig. 6g), indicating that these cells had independently recombined the "Confetti" gene and were not derived from a single clone. In contrast, in mature granuloma, patches of cells expressing the same fluorescent dye were only found in the periphery of the granulomas (Fig. 6e,f), indicating the clonal expansion of CX3CR1+ cells, and consistent with the detection of EdU+ cells in the periphery of mature granulomas. These results suggest that AAMmono cells undergo proliferation and may convert to the AAMconv phenotype as granulomas become more organized and mature.
Tracking CX3CR1+cells in the liver of S. mansoni infected mice
Next, we monitored the fate of CX3CR+ monocyte derived cells in Cx3cr1CreERT2-EYFP/+ R26tdTomato/+mice infected with S. mansoni and treated with TAM at 5 weeks post-infection. At 1 week post-TAM, corresponding to 6 weeks post-infection, more than 50% of CD11b+ cells in the liver were tdTomato+, while at 5 weeks post-TAM, corresponding to 10 weeks post-infection, <1% of CD11b+ cells in the liver were tdTomato+ (Fig. 7a,b), indicating that CX3CR1+ monocyte-derived cells have a rapid turnover during infection. Notably, 34.8% of the CD11b+F4/80+ cells were YFP− at 1week post-TAM (Fig. 7c), indicating they had already downregulated CX3CR1 expression. Next we analyzed the cell surface phenotype of Cx3cr1-YFP+tdTomato−, YFP+tdTomato+, YFP−tdTomato+ and YFP−tdTomato− cells. PD-L2+CD206+AAMmono cells were observed in the YFP+tdTomato+ (8.7%) and YFP+tdTomato– (6.9%) compartment, compared to YFP–tdTomato+ (0.45%) cells (Fig. 7d,e). RT-PCR analysis of sorted cells showed that Ucp1 was expressed in the tdTomato+ compartment (Fig. 7f). These results indicate that macrophages derived from CX3CR1+ precursors can adopt different phenotypes during S. mansoni infection, and can adopt a phenotype similar to AAMconv as they downregulate CX3CR1.
Figure 7. Fate mapping monocyte-derived macrophages in the liver granulomas of S. mansoni infected mice.
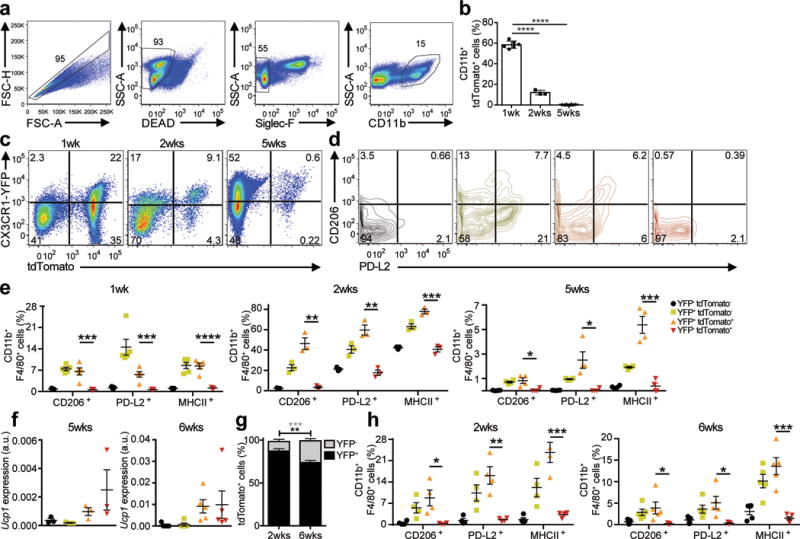
(a) TAM pulse administration via oral gavage in the S. mansoni infected Cx3cr1CreER-IRESYFP/+Rosa26floxed-tdTomato/+ mice. Representative gating scheme for tdTomato+ monocyte-derived macrophages in the liver (singlet, live, Siglec-F−, CD11b+) in TAM treated Cx3cr1CreERT2-IRESYFP/+ Rosa26floxed-tdTomato/+ mice infected with S. mansoni. (b) Quantitation of tdTomato+ cells reveals rapid turnover of CX3CR1+ derived cells during S. mansoni infection. Graph indicates percentage of CD11b+ tdTomato+ cells after 1, 2, or 5 weeks post-TAM gavage. (c) Representative flow cytometry plots of YFP+ and/or tdTomato+ cells isolated from the liver of Cx3cr1CreERT2-IRESYFP/+Rosa26floxed− tdTomato/+ mice infected with S. mansoni after 1 week, 2 weeks or 5 weeks post- tamoxifen gavage. (d) Representative flow cytometry plots of PD-L2 and CD206 expression in CD11b+ cells based on the YFP and/or tdTomato expression. (e) Quantification of the frequency of F4/80+ CD206+ or F4/80+ PD-L2+ cells (gated on single, live, Siglec-F−, CD11b+) after 1 week (n=8), 2 weeks (n=3) or 5 weeks (n=10) post-tamoxifen gavage. (f) Ucp1 mRNA expression in sorted CX3CR1-YFP+ and/or tdTomato+ cells from Cx3cr1CreERT2-IRESYFP/+Rosa26floxed-tdTomato/+ mice infected with S. mansoni given a TAM pulse 5 weeks prior (left) or from mice on TAM diet for 6 weeks (right). (g) Cx3cr1CreERT2-IRESYFP/+ Rosa26floxed-tdTomato/+ mice infected with S. mansoni given tamoxifen (TAM) diet for 2 weeks Increased accumulation of tdTomato+ cells that have downregulated YFP expression at 2 weeks (n=3) or 6 weeks (n=5). (h) Quantification of CD11b+ event frequencies after 2 weeks or 6 weeks TAM diet of F4/80+ CD206+, F4/80+ PD-L2+, or F4/80+ MHCII+ events. **P<0.01, ***P<0.001, unpaired Students T test.
Given the rapid turnover of tdTomato+ cells in the liver during S. mansoni infection, we maintained S. mansoni-infected Cx3cr1CreERT2-EYFP/+ R26tdTomato/+ mice on a TAM-containing diet to allow continuous labeling of CX3CR1+ cells. At 12 weeks post infection (6 weeks on TAM diet) we found an increase in tdTomato+YFP− cells in the liver compared to 8 weeks post infection (2 weeks on TAM diet) (Fig. 7g). PD-L2, CD206 and MHCII expression was detected by FACS on YFP+ cells, but not on tdTomato+YFP– cells (Fig. 7h), while Ucp1 transcripts were detected by RT-PCR in sorted tdTomato+ cells (Fig. 7f), consistent with studies indicating that CX3CR1+ monocyte-derived cells can adopt a tissue-resident macrophage phenotype in the liver7.
When we infected Vit-ADEF C57BL/6 mice with S. mansoni, we observed >80% mortality over 10 weeks compared to no mortality in S. mansoni-infected Vit-ACON mice (Fig. 8a). Expression of Ucp1 mRNA was significantly reduced in the livers of S. mansoni-infected Vit-ADEF mice compared to Vit-ACON mice 8 weeks post infection (Fig. 8b), and the organization of UCP1+ cells in the periphery of liver granulomas was disrupted (Fig. 8c). Furthermore, there was reduced incorporation of EdU and Gata6 mRNA expression in CD11b+F4/80+ macrophages in the livers of S. mansoni-infected Vit-ADEF mice compared to infected Vit-ACON mice (Fig. 8b, c). Treatment of S. mansoni-infected Vit-ADEF mice with ATRA induced the recovery of F4/80hi macrophages (Fig. 8d,e) and Ucp1 and Gata6 mRNA expression were increased in the liver (Fig. 8b,c) compared to untreated Vit-ADEF mice, while UCP1and EdU stain were restored in the periphery of mature liver granulomas (Fig. 8c). We also observed fewer SiglecF+ eosinophils in the livers of S. mansoni-infected Vit-ADEF mice compared to mice on a control diet, which was partially restored by ATRA (Fig. 8f), suggesting restoration of the type 2 immune response, which was disrupted during vitamin A deficiency. Thus, retinoic acid may restore both type 2 responses and macrophage conversion.
Figure 8. Disruption of Ucp1 expression and proliferation in granulomas and increased mortality of S. mansoni infection in vitamin A-deficient mice.
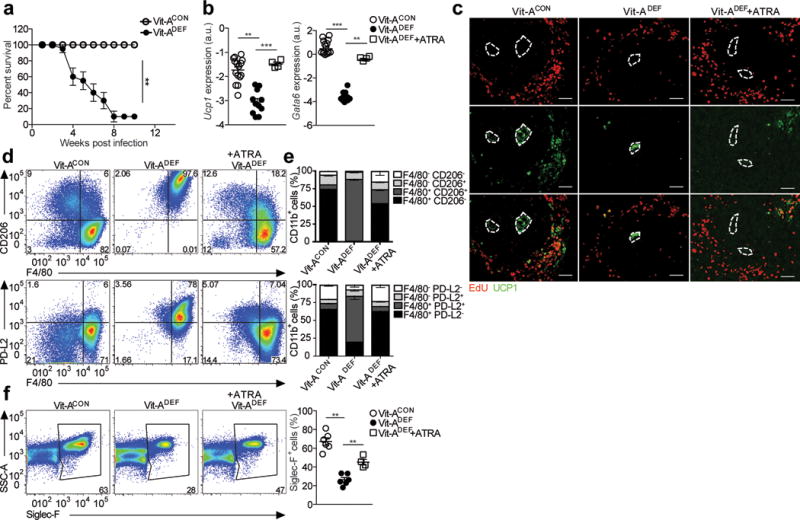
(a) Vitamin A deficient (Vit-ADEF) or control (Vit-ACON) mice infected with S. mansoni and treated with all-trans RA starting at 5 weeks post-infection, every other day for 14 days. Mice were sacrificed at 7.5 weeks post infection. Survival curve of Vit-ACON (n=32) and Vit-ADEF (n=28) mice infected with S. mansoni. (b) RT-PCR analysis of Ucp1 and Gata6 expression in the liver of S. mansoni infected Vit-ACON(n=15), Vit-ADEF(n=11) or Vit-ADEF treated with all-trans RA (ATRA) (n=4) mice normalized to expression of GAPDH. Graphs depict mean ± standard error of the mean of individual mice pooled from 3 independent experiments. (c) Representative images from immunofluorescence microscopy of liver granulomas from Vit-ACONand Vit-ADEFinfected with S. mansoni stained for EdU (red) UCP1 (green). (d-h) Analysis results for S. mansoni infected Vit-ACON(n=8), Vit-ADEF(n=8), and Vit-ADEFmice treated with ATRA (n=4). (d) Representative FACS plots of CD206, PD-L2 expression of macrophages. (e) Stacked bar graph indicates frequencies of F4/80 and PD-L2 in CD11b+ cells. (f) Representative FACS plots of Siglec-F+ eosinophils. Quantification of Siglec-F+ cells. Scale bar 50μm. *P < 0.05 and **P<0.01 ***P < 0.0001. One-way ANOVA with Bonferroni post-test correction. Data representative of two independent experiments involving 5 to 6 mice per group.
We also examined conversion of CX3CR1+ monocyte-derived cells into macrophages during lung granuloma formation 7 days after S. mansoni eggs were delivered i.v. (after i.p. sensitization with S. mansoni eggs for 14 days) in Vit-ADEF Cx3cr1CreERT2-EYFP/+:R26R-tdTomato/+ mice (Supplementary Fig. S6a). There was no significant difference in the accumulation of tdTomato+ cells in the lung compared to Vit-ACON mice (Supplementary Fig. S6a). Almost no CD11b+tdTomato+ cells have downregulated CX3CR1-YFP, unlike in liver granulomas. We also examined macrophages in lung granulomas in wild-type (CD45.1):Stat6−/− (CD45.2) mixed (50:50) bone marrow chimeras injected i.v. with S. mansoni eggs. Stat6−/− and wild-type CD11b+F4/80+ macrophages in lung granulomas maintained an equal ratio and did not show significant differences in marker phenotype or proliferative capacity indicating a limited role for IL-4 and IL-13 in expanding macrophage numbers (Supplementary Fig. S6b). The wild-type: Stat6−/− mixed bone marrow chimeras were infected physiologically with S. mansoni cercariae and they all rapidly lost weight and died at 7 weeks post infection (Supplementary Fig. S6c). Hence, STAT6 may play a more dominant role in the function of liver granuloma macrophages during natural infection compared to lung granulomas from i.v. delivered eggs.
Discussion
Macrophages are highly plastic cells that respond to the environment to adopt tissue specific phenotypes, regardless of their embryonic or adult bone marrow origin31. Here, we show that monocyte-derived F480intCD206+MHCII+ inflammatory macrophages can convert into a tissue resident F4/80hiCD206− MHCII− phenotype after residence in the tissues, and that this process is dependent on vitamin A. We previously reported that UCP1 was only expressed by F4/80highCD206– AAMres in naïve mice treated with IL-4c and was a marker for AAMres cells19, but here we find that AAMconv cells also gain expression of UCP1. While chromatin accessibility is often considered to be a mark of cellular lineage, here we find that both the changes to transcriptional profiles and cell surface phenotype of the AAMconv were accompanied by near complete remodeling of the chromatin landscape to closely resemble AAMres, and that the changes to chromatin accessibility correlated with expression of the markers PD-L2 and UCP1. In Vit-ADEF mice infected with S. mansoni, failure to convert from monocyte-derived inflammatory macrophages into a tissue resident phenotype is associated with disrupted liver granuloma architecture and increased mortality.
Retinoic acid can induce the expression of the transcription factor Gata625, which regulates the differentiation of resident peritoneal macrophages25, 32, 33. GATA6+ macrophages accumulate in the liver following sterile injury34. While we have not specifically tested the role of Gata6 in the differentiation of AAMmono into the AAMres phenotype, expression of Gata6 in the liver was induced during S. mansoni infection and reduced in Vit-ADEF mice.
Notably, we found reduced numbers of CD11b+MHCII+ macrophages in the lungs and the gut of uninfected Vit-ADEF mice compared to mice on a control diet, in contrast to expanded numbers in the peritoneal cavity. This indicates that there are environmental changes in different tissues during vitamin A deficiency that have different effects on tissue macrophages. Whether retinoic acid and vitamin A play an equally important role in macrophage conversion during inflammation in other tissues remains to be established. Whereas we observed that liver granulomas during S. mansoni infection clearly required vitamin A for macrophage conversion, this was not the case for lung granulomas when S. mansoni eggs were delivered i.v. The shorter time frame of the more acute lung granuloma model may account for these differences and indeed few CD11b+tdTomato+ cells have downregulated CX3CR1-YFP after just 7 days. Alternatively, tissue specific requirements of inflammatory lung macrophages for vitamin A may be different from the liver and peritoneal cavity.
Vitamin A deficiency is associated with increased mortality of children in developing countries and it has been called an “anti-infective” vitamin23. Because of the pleiotropic effects of retinoic acid and vitamin A-deficiency, it is difficult to definitively conclude that the increased morbidity observed in S. mansoni-infected Vit-ADEF mice was due specifically to the alterations in macrophage conversion and not to an underlying state of inflammation in these mice. While granuloma formation in Vit-ADEF mice was restored by treatment with retinoic acid, this could also be due to the restoration of the type 2 immune responses. Type 2 responses are disrupted during vitamin A deficiency and are critical for the proper formation of S. mansoni egg granulomas10.
Our current observations show that monocyte-derived macrophages can eventually adopt phenotype similar to that of tissue-resident macrophages of embryonic lineage after long-term residency in the tissue. This is consistent with reports showing that embryonic-derived tissue-resident macrophages can be replaced by bone marrow–derived macrophages that adopt the phenotypic and functional features of the original, embryonically-derived population7, 8, 36. This process is likely accelerated by inflammation, as demonstrated following γ-irradiation and bone marrow transplantation35. But even under steady-state conditions, in the absence of inflammation, adult bone marrow-derived hematopoiesis can replace a proportion of the embryonically-derived, tissue-resident macrophages during normal aging7, 8, 22. Hence, the underlying ontogeny of the cells may not contribute significantly towards differences in their functional properties.
Here we show a role for vitamin A for an appropriate conversion of inflammatory macrophages to a tissue-resident phenotype in the peritoneal cavity and the liver during type 2 responses. Retinoic acid-dependent phenotypic conversion of macrophages may be a physiologically important regulatory process during chronic inflammatory responses, as vitamin A deficiency is associated with increased morbidity and mortality to various infections in the developing world. An accumulation of inflammatory macrophages and the failure to resolve inflammation may have detrimental consequences in conditions of vitamin A deficiency.
Online Methods
Mice
C57BL6/J (CD45.2), B6.SJL (CD45.1), Rosa26Brainbow2.1/Brainbow2.1, Rosa26floxed-tdTomato/floxed-TdTomato, and C57BL6/J Stat6−/− mice were purchased from Jackson laboratories (Bar Harbor, ME) and bred in a specific pathogen free (SPF) facility. Cx3cr1CreERT2-IRESYFP/CreERT2-IRESYFPmice were generously provided by Dr. Wenbiao Gan and Dr. Dan Littman (Skirball Institute, New York University Medical Center). Mice for Vitamin A deficiency experiments were generated as described previously37. Briefly, pregnant dams were fed a Vitamin A deficient (0 IU/g, TD.86143 Harlan Teklad) or control (20,000 IU/g, TD.93160) diet starting at day 10 of gestation and continuing through weaning. After weaning, mice were maintained on the same diet for the duration of the experiment. Serum retinol levels in the VAD mice on this protocol were reduced to ~0.35 μM, a level defined by the World Health Organization as severe Vitamin A deficiency. All studies were carried out in strict accordance with the recommendations in the Guide for the Care and Use of Laboratory Animals. All animal procedures were approved by the NYU Institutional Animal Care and Use Committee under protocol number 131004 and 130504.
Models of helminth infection and peritoneal inflammation
Mice were infected percutaneously with 50 Schistosoma mansoni cercariae (Puerto Rican strain NMRI; Biomedical Research Institute) and analysis of liver leukocytes was performed after 7.5–15 weeks post-infection. For peritoneal inflammation, mice treated with IL-4/anti-IL-4 Ab complexes (IL-4c) prepared as described previously17, 18. IL-4c were given i.p on days 0 and 2. Mice were also treated with 4% thioglycollate on day 0 alone or in combination with IL-4c as indicated. Mice were sacrificed on day 4, unless otherwise noted for time course experiments. Tamoxifen (Sigma) was dissolved in corn oil and given by oral gavage at a dose of 500mg/kg body weight. For continuous labeling experiments, Cx3cr1CreERT2-IRESYFP/+ Rosa26floxed-tdTomato/+ were switched onto a chemically defined Tamoxifen diet (Envigo, TD.130855) at the indicated time during infection for the remainder of the experiment.
S. mansoni egg injection model
S. mansoni eggs were isolated from infected mouse livers and injected into mice as previously described38. Briefly, S. mansoni eggs were then injected (5000eggs/mouse) into the peritoneal cavity and the mice were rested for 14 days. Fresh S. mansoni eggs were then isolated and injected retro-orbitally and mice were rested for 8 days upon which PECs and lungs were isolated for flow cytometry analysis.
Lung macrophage isolation
Isolated mouse lungs were minced dry and digested (0.25mg/mL Liberase TM, 60mg BSA, 150Kunitz DNase I) at 37°C for 45min. Digested tissue was then passed through a 100um strainer and subsequently through a 50um strainer. Cell suspensions were stained with fluorescently-tagged antibodies and analyzed on via flow cytometry as described below.
In Vivo retinoic acid (RA) Reconstitution and diet switching
A total of 250μg of all-trans-retinoic acid (ATRA) (Sigma Aldrich) in 30 μl of biotechnology performance certified DMSO (Sigma Aldrich) was administered intraperitoneally to VAD mice every other day for 14 days. Mice not receiving RA received DMSO vehicle. For diet switching experiments Vitamin A deficient mice Vit-ADEF generated as described previously were treated with thioglycollate at 8 weeks of age and allowed to rest for 24hrs. They were then gavaged with 500mg/kg of tamoxifen and their diet switched to a Vitamin A control containing 20,000 IU of Vitamin A for the remainder of the experiment.
Tissue preparation and peritoneal cell isolation
Liver tissues were processed as described previously39. Briefly livers were chopped and incubated in collagenase VIII (100U/ml; Sigma) and DNase I (150 μg/ml; Sigma) for 45 minutes at 37°C and then passed through a 100 μm cell strainer (BD Biosciences). Leukocytes were enriched by density gradient centrifugation over a 40/80% Percoll (GE Healthcare) gradient and remaining RBCs were lysed with ACK lysis buffer, washed in complete media and used for analysis. Peritoneal cells were isolated by washing the peritoneal cavity with 10 ml of cold 1× PBS (HyClone). Peritoneal exudate cells were treated with ACK lysis buffer (Lonza, Walkersville) to lyse red blood cells and washed with cold 1× PBS. Cells were either used immediately for further staining and analysis by flow cytometry or lysed with TRIzol for RNA extraction.
Flow cytometry and cell sorting
Single cell suspensions were stained with fluorescently conjugated antibodies in a 1:100 dilution unless otherwise noted. Cells were stained with LIVE/DEAD™ Aqua or Blue (Invitrogen), blocked with 4μg/ml anti-CD16/32 (2.4G2; Bioxcell) and the stained with anti-CD11b eFluor450 (M1/70; Biolegend), anti-CD11b BV650 (M1/70; Biolegend), anti-CD11b AF700 (M1/70; Biolegend) anti-MHCII APC-Cy7 (M5/114.15.2; Biolegend), CD45.1 FITC (A20; Biolegend), CD45.1 PerCP/Cy5.5 (A20; Biolegend), CD45.2 FITC (104; Biolegend), CD45.2 PerCP/Cy5.5 (104; Biolegend), F4/80 PECy7 (BM8; Biolegend), CD206 APC (C068C2; Biolegend), Siglec-F BV421 (E50-2440; BD Biosciences), Siglec-F PE (E50-2440; BD Biosciences), PD-L2 PE (TY25; Biolegend), PD-L2 PerCP-Vio700 (MIH-37; Miltenyi Biotec) CD3 PE (17A2; Biolegend), CD19 PE (6D5; Biolegend), CD49b PE (DX5; Biolegend). For EdU labeling, mice were pulsed with 0.5 mg of EdU for 3h prior to sacrifice and single cell suspensions were surface stained, fixed in 2% PFA for 10 min at RT, permeabilized, and stained for EdU (Invitrogen) per the manufacturer’s instructions. Samples were analyzed on an LSRII and sorted on an Aria II cell sorter (BD Biosciences). For FACS-purifying peritoneal macrophages, cells were gated on singlet, live, Dump-negative (CD3−, CD19−, DX5−, Siglec-F−) CD11b+ then subsequently gated on their AAMres (F4/80hi, CD206−, tdTomato−), AAMmono (F4/80int, CD206+, tdTomato+) or AAMconv (F4/80hi, CD206−, tdTomato+) phenotype.
RNA isolation for RNA-Seq
RNA isolation from FACS-purified macrophages was done using the QIAgen Rneasy Micro Kit and QIAgen Rneasy Micro Kit where cell number was less than 5×10⁵ cells. RNA-Seq library preparation was done at the NYU School of Medicine Genome Technology Core using a low-input protocol with the TotalScript RNA-Seq kit (Epicentre). Libraries were sequenced on the HiSeq 2000 (Illumina) with 2 × 50 cycles and for an average of 50 million reads per sample.
Assay for Transposase-Accessible Chromatin with Sequencing (ATAC-Seq)
Assay for Transposase-Accessible Chromatin with Sequencing (ATAC-Seq) was performed as described by Buenrostro et al40. 50,000 FACS-purified cells per sample were spun down at 1500rpm for 5 min at 4°C and washed once with 50μl cold PBS. Cells were lysed with 50μl lysis buffer (10 mM Tris-HCl, pH7.4, 10 mM NaCl, 3 mM MgCl2, 0.1% IGEPAL CA-630) and immediately spun down at 1500rpm for 10 min at 4°C. The isolated cell nuclei were then incubated for 30 min at 37°C with 50μl of transposase reaction, which contained 25μl Tagment DNA buffer (Illumina), 2.5μl Tagment DNA enzyme (Illumina) and 22.5μl nuclease-free water. The transposed DNA was immediately purified using the Qiagen MinElute PCR Purification Kit (Qiagen) following manufacturer's guide and eluted at 10ul volume. PCR amplification of the transposed DNA was done using a low-cycle number protocol and with primers published by Buenrostro et al40. Each PCR mix contained of 25μl of NEB 2× PCR Mix (New England Biolabs), 2.5μl of 25μM forward primer (Primer Ad1_noMX), 2.5μl of 25μM reverse barcoded primer, 0.3μl of 100× SYBR Green (Invitrogen) and 10μl of transposed DNA. PCR was carried out with the cycling protocol: 72°C for 5 min, 98°C for 30s, followed by 5 cycles of 98°C for 10s, 63°C for 30s, 72°C for 1 min. The reaction was held at 4°C after the 5th cycle. A side qPCR was set up using the PCR product from these 5 cycles of amplification. Each qPCR mix contained 5μl NEB 2× PCR Mix, 0.25μl 25μM forward primer, 0.25μl 25μM reverse barcoded primer, 0.06μl 100× SYBR Green, 4.44μl nuclease-free water and 5μl of the PCR-amplified product. qPCR was carried out using the cycling protocol: 98°C for 30s, followed by 25 cycles of 98°C for 10s, 63°C for 30s, 72°C for 1 min and plate read. The qPCR amplification plot was then used to calculate the additional number of cycles needed for the PCR to achieve maximum amount of product without going into saturation. Each sample was amplified for a total of 13–15 cycles. The amplified libraries were then purified using Qiagen MinElute PCR Purification kit following manufacturer’s guide and eluted at 20μl volume. Libraries were sequenced on the HiSeq 2000 with 2 × 50 cycles and for an average of 50 million paired-end reads per sample.
RNA-Seq primary data processing
Raw RNA-Seq reads were aligned to the reference mouse genome Grcm38 and the Ensembl reference transcriptome Grcm38.84.gtf using Tophat (version 2.1.0) with all parameters kept at default settings41. Reads with mapping quality score (MAPQ) less than 30, as well as reads mapping to mitochondrial DNA and chromosome Y, were removed. The median number of filtered reads per sample was 40,230,370. The number of filtered reads were subsequently counted for each gene using htseq-count, with the parameters –mode=union and –stranded=no42. The resulting count matrix was used for downstream analyses.
ATAC-Seq primary data processing
Raw ATAC-Seq reads were aligned to the reference mouse genome mm10 using bowtie2 (v2.2.9), with the parameters –maxin 2000 and –local, while keeping all other parameters at default settings43. To keep only highly unique alignments, reads with MAPQ score less than 30 were removed. We further removed all duplicate reads, as well as reads mapping to mitochondrial DNA and chromosome Y. After all filtering steps, reads were merged across all replicates from the same macrophage population. This resulted in a median depth of 44,724,457 reads per macrophage population. To identify accessible chromatin regions, we performed peak calling with the PeaKDeck (v1.1) algorithm, which measures signal density from randomly sampled bins genome-wide before generating a data set-specific probability distribution to identify regions with significant signal enrichment44. We ran PeaKDeck using sampling bins that consist of a 75bp central bin (-bin) and a 10000bp background bin (-back). Sampling along the genome was done in steps (-STEP) of 25bp and the background probability distribution was generated using 100000 randomly selected sites (-npBack). Significance was defined using a p-value of less than 0.00001 and regions with significant p-values were defined as a “peak” (i.e. an accessible chromatin region). We next counted the number of reads present at each accessible region in order to analyze the ATAC-Seq data using quantitative approaches. To do this, we first generated a set of consensus peaks across the data set by taking the union of peaks called from each macrophage population. Peaks were merged if overlapping by 1bp or more. The number of reads at each peak within the union peak sets were then counted for each sample. Finally, each peak was re-centered +/-100bp on its summit, defined as the position with maximum pile up of reads. Re-centering on peak summits was performed as this should coincide with the binding event of a transcription factor within an accessible chromatin region. We implemented the read counting and peak summit re-centering steps directly using the dba.count function from the Bioconductor package DiffBind (version 1.14.2)45. The final count matrix, which consisted of 34462 peaks, was used for downstream analyses.
RNA-Seq and ATAC-Seq data analyses
Regularized logarithmic (rlog) transformation was performed on count data matrices generated from RNA-Seq and ATAC-Seq as described above46. For RNA-Seq data, the maximum rlog count value for each gene across the data set was determined and only genes which had a maximum value greater than the 25th percentile of per-gene maximum values were kept for between-sample comparisons and clustering analyses. This resulted in 17421 genes. For ATAC-Seq data, we kept count data for all 34662 peaks.
Pairwise, between-sample Euclidean distance and Pearson’s correlation were calculated for the transcriptional and accessible chromatin profiles, respectively, to quantitate the similarities between samples. Clustering analysis was performed using the Clustering Large Application (CLARA) algorithm. CLARA is a more robust version of k-means and is implemented in a computationally efficient way suitable for clustering large data set47. We used the maximum average silhouette width to select for optimal number of clusters (K=5 for RNA-Seq data and K=3 for ATAC-Seq data).
Supervised differential analyses based on the negative binomial distribution with moderated dispersion value estimation were performed using the workflow directly implemented through the Bioconductor package DESeq2 (version 1.10.1) for both RNA-Seq and ATAC-Seq count data46. Tissue converted macrophages were compared to its reference monocyte-derived macrophages and tissue resident macrophages in two different contrasts. Differential genes and regulatory elements were defined using a False Discovery Rate (FDR) of 10% and |log2 fold change| greater than zero. Gene ontology (GO) enrichment analysis was done for genes with differential expression in both contrasts using GOstats48. Genes for each GO term (from the ontology “Biological Processes”) were treated as an independent gene set and enrichment within the differential gene list was determined using the standard hypergeometric test, with a p-value cut off of 0.0001 and a background set containing all annotated genes within the mm10 reference genome48. All analyses done on processed RNA-Seq and ATAC-Seq reads were done in R (version 3.2.3). The raw and processed sequencing data was deposited into PubMed as a SuperSeries (GSE95003).
Macrophage transfers
Inflammatory macrophages harvested from donor mice induced with thioglycollate, IL-4c, or Thio + IL-4c were elicited as described above in congenic CD45.1 or CD45.2 mice on C57BL/6 background. PECs were harvested, stained with LIVE/DEAD viability, lineage (CD3, B220, DX5, Siglec F), CD11b and F4/80 and sorted. Cells were sorted by collecting single, live, lineage (CD3, B220, DX5, Siglec F) negative, CD11b+, F4/80+ cells and were sorted directly into FBS using a 100 μm nozzle on BD FACS Aria II. Cells were washed twice, counted and re-suspended in cold 1× PBS. Recipient mice, including WT CD45.2 mice, or mice on either CON or VAD diets (as indicated) received between 2.5–5.0×10⁵ to 1.8×10⁶ donor macrophages by i.p. injection. Recipients that received donor macrophages were then rested for either 24 hours for short term transfers or 8 weeks for long term transfers before being treated with 2 doses of IL-4c as described above and analyzed on day 4 after IL-4c treatment began. Mice were pulsed with EdU and PECs (including both donor and recipient cells) were harvested and stained as described above for LIVE/DEAD, CD45.1, CD45.2, PDL2, CD206, MHC class II, F4/80 and samples were collected with LSRII (BD Biosciences) and analyzed with FlowJo Software (Treestar, Ashland, OR).
Mixed Chimera Transplants
For mixed chimera transplants, mice were placed on oral antibiotics one week prior to transplantation. For transplant, mice were lethally irradiated by two exposures of 600cGy on the same day and transplanted within 24hrs of irradiation. Donor bone marrow cells (1.5 million cells / genotype, totaling 3 million cells / mouse) were injected retro-orbitally into anesthetized recipient mice. Transplanted mice were kept on oral antibiotics for 4 weeks after transplantation, and subsequently infected with S. mansoni or injected with S. mansoni eggs as described above.
RNA isolation and real-time quantitative PCR
For whole liver tissue analysis, representative pieces of liver were placed into Trizol™ (Ambion, Life Technologies) and homogenized. RNA was isolated from using the RNeasy mini-kit (Qiagen) as per the manufacturer’s instructions. For analysis of sorted cells, Trizol™ was used to lyse the cells and RNA was isolated using either the RNeasy mini-kit (Qiagen) or RNeasy micro-kit (Qiagen) per the manufacturer’s instructions. Quantitative reverse transcription-polymerase chain reaction (RT-PCR) was performed using the SYBR Green or Taqman qPCR kit (Applied Biosystems) and normalized to the housekeeping gene Gapdh by comparative Ct.
Tissue histological sections
For immunofluorescence images, liver tissues were fixed in solution containing 0.05M phosphate buffer (pH7.4), 0.1M L-lysine and 10mg/ml paraformaldehyde overnight at 4°C. Fixed tissue was then equilibrated in 30% sucrose solution for 24hrs at 4°C and embedded in OCT and stored at -80°C. Tissues were then sectioned at a thickness of 10μm, mounted onto charged slides, allowed to dry, and dehydrated with an acetone wash. Sections were then stored at -80°C until staining. For staining, frozen sections were thawed and rehydrated in 80% ethanol prior to blocking with appropriate antibody-host serum. Sections were stained with rabbit anti-UCP1 (Abcam, ab10983) and Goat anti-rabbit F’ab fragments conjugated to Alexa Fluor 488 (Invitrogen, A-11008). EdU incorporation was stained by using the Click-it EdU Imaging kit (Life Technologies) per the manufacturers guidelines. For hematoxylin and eosin staining, formalin-fixed paraffin-embedded tissues were cut to a thickness of 10μm and stained. For preparation of liver containing Brainbow2.1 fluorescence, anesthetized mice were perfused with 4%PFA via intracardial injection. Perfused livers were then cut using a vibratome (Leica) to obtain 200μm thick sections. Sections were then mounted onto positively charged slides, coverslipped with Vectashield™(Vector Labs) and sealed with nail polish, then stored at −20°C.
Microscopy
Acquisition of Brainbow2.1 fluorescence was performed using the tile scanning feature of a Leica DM6000 upright confocal microscope. Tile scans were taken to a depth of 60μm and adjoining images were stitched together to form complete single images. Resulting images were then analyzed using the Fiji Image J software. For immunofluorescence imaging, stained sections were imaged using a Zeiss Axiovert fluorescence microscope. Processing of fluorescence images was performed using Fiji Image J software.
Statistical analysis
Results represent the mean s.e.m, statistical significance between groups was determined by unpaired Students T-test or analysis of variance (ANOVA) plus Bonferroni or Dunnett’s correction for multiple comparisons. Statistical analysis was performed using GraphPad Prism v6.0. Researchers were not blinded to the groups, no exclusion criteria were applied and all samples were included in the analysis.
Accession codes
Gene Expression Omnibus (GEO) SuperSeries accession number: GSE95003. This includes both RNA-seq data set (GSE95002) and ATACSeq (GSE95001) data.
Supplementary Material
Acknowledgments
We would like to thank K. Cadwell and members of K. Cadwell, J. Ernst and E. Fisher laboratories for the reading of this manuscript. We thank D. Littman (New York University Medical Center, Skirball Institute of Biomolecular Medicine) for generously providing the Cx3cr1CreERT2-IRES-EYFP mice and J. Collins (UT Southwestern) for S. mansoni eggs. We thank the NYUMC Genome Technology Core, Flow Cytometry Core, NYUMC Microscopy Core, and the NYUMC Histopathology Core Facilities for their assistance and these shared resources are partially supported by the Cancer Center Support Grant, P30CA016087, at the Laura and Isaac Perlmutter Cancer Center. This work is supported by NIH, NIAID grants AI093811 and AI094166 (P.L.) and NIDDK grant DK103788 (P.L.); Ruth L. Kirschstein NRSA fellowship F32AI102502 (N.M.G.); T32 Microbiology training grant. T32 AI007180 (U.M.G. and M.G.); T32 Cardiology 104220 (U.M.G.); Vilcek Foundation (U.M.G.); AAI (M.S.T.) B. glabrata snails are provided by the NIAID Schistosomiasis Resource Center of the Biomedical Research Institute (Rockville, MD) through NIH-NIAID Contract HHSN272201000005I for distribution through BEI Resources.
Footnotes
COMPETING FINANCIAL INTERESTS
The authors declare that there are no conflicts of interest.
AUTHORSHIP
Authorship: U.M.G., N.M.G., M.A.G. and P.L. designed experiments, performed research, analyzed data and wrote the paper. H.P.V., M.S.T, J.D.L., M.O., L.J.M., and J.A.P performed research and analyzed data. N.V., L.J.M., and J.A.P performed research. E.A.F. and K.J.M provided necessary mice and materials and wrote the paper.
References
- 1.Sieweke MH, Allen JE. Beyond stem cells: self-renewal of differentiated macrophages. Science. 2013;342:1242974. doi: 10.1126/science.1242974. [DOI] [PubMed] [Google Scholar]
- 2.Zigmond E, Jung S. Intestinal macrophages: well educated exceptions from the rule. Trends Immunol. 2013;34:162–168. doi: 10.1016/j.it.2013.02.001. [DOI] [PubMed] [Google Scholar]
- 3.Ingersoll MA, Platt AM, Potteaux S, Randolph GJ. Monocyte trafficking in acute and chronic inflammation. Trends Immunol. 2011;32:470–477. doi: 10.1016/j.it.2011.05.001. [DOI] [PMC free article] [PubMed] [Google Scholar]
- 4.Shi C, Pamer EG. Monocyte recruitment during infection and inflammation. Nat Rev Immunol. 2011;11:762–774. doi: 10.1038/nri3070. [DOI] [PMC free article] [PubMed] [Google Scholar]
- 5.Gosselin D, et al. Environment drives selection and function of enhancers controlling tissue-specific macrophage identities. Cell. 2014;159:1327–1340. doi: 10.1016/j.cell.2014.11.023. [DOI] [PMC free article] [PubMed] [Google Scholar]
- 6.Lavin Y, et al. Tissue-resident macrophage enhancer landscapes are shaped by the local microenvironment. Cell. 2014;159:1312–1326. doi: 10.1016/j.cell.2014.11.018. [DOI] [PMC free article] [PubMed] [Google Scholar]
- 7.Scott CL, et al. Bone marrow-derived monocytes give rise to self-renewing and fully differentiated Kupffer cells. Nat Commun. 2016;7:10321. doi: 10.1038/ncomms10321. [DOI] [PMC free article] [PubMed] [Google Scholar]
- 8.van de Laar L, et al. Yolk Sac Macrophages, Fetal Liver, and Adult Monocytes Can Colonize an Empty Niche and Develop into Functional Tissue-Resident Macrophages. Immunity. 2016;44:755–768. doi: 10.1016/j.immuni.2016.02.017. [DOI] [PubMed] [Google Scholar]
- 9.Hams E, Aviello G, Fallon PG. The schistosoma granuloma: friend or foe? Front Immunol. 2013;4:89. doi: 10.3389/fimmu.2013.00089. [DOI] [PMC free article] [PubMed] [Google Scholar]
- 10.Pearce EJ, MacDonald AS. The immunobiology of schistosomiasis. Nat Rev Immunol. 2002;2:499–511. doi: 10.1038/nri843. [DOI] [PubMed] [Google Scholar]
- 11.Wilson MS, et al. Immunopathology of schistosomiasis. Immunol Cell Biol. 2007;85:148–154. doi: 10.1038/sj.icb.7100014. [DOI] [PMC free article] [PubMed] [Google Scholar]
- 12.Murray PJ, et al. Macrophage activation and polarization: nomenclature and experimental guidelines. Immunity. 2014;41:14–20. doi: 10.1016/j.immuni.2014.06.008. [DOI] [PMC free article] [PubMed] [Google Scholar]
- 13.Wynn TA, Vannella KM. Macrophages in Tissue Repair, Regeneration, and Fibrosis. Immunity. 2016;44:450–462. doi: 10.1016/j.immuni.2016.02.015. [DOI] [PMC free article] [PubMed] [Google Scholar]
- 14.Herbert DR, et al. Alternative macrophage activation is essential for survival during schistosomiasis and downmodulates T helper 1 responses and immunopathology. Immunity. 2004;20:623–635. doi: 10.1016/s1074-7613(04)00107-4. [DOI] [PubMed] [Google Scholar]
- 15.Girgis NM, et al. Ly6C(high) monocytes become alternatively activated macrophages in schistosome granulomas with help from CD4+ cells. PLoS Pathog. 2014;10:e1004080. doi: 10.1371/journal.ppat.1004080. [DOI] [PMC free article] [PubMed] [Google Scholar]
- 16.Nascimento M, et al. Ly6Chi monocyte recruitment is responsible for Th2 associated host-protective macrophage accumulation in liver inflammation due to schistosomiasis. PLoS Pathog. 2014;10:e1004282. doi: 10.1371/journal.ppat.1004282. [DOI] [PMC free article] [PubMed] [Google Scholar]
- 17.Jenkins SJ, et al. Local macrophage proliferation, rather than recruitment from the blood, is a signature of TH2 inflammation. Science. 2011;332:1284–1288. doi: 10.1126/science.1204351. [DOI] [PMC free article] [PubMed] [Google Scholar]
- 18.Jenkins SJ, et al. IL-4 directly signals tissue-resident macrophages to proliferate beyond homeostatic levels controlled by CSF-1. The Journal of experimental medicine. 2013;210:2477–2491. doi: 10.1084/jem.20121999. [DOI] [PMC free article] [PubMed] [Google Scholar]
- 19.Gundra UM, et al. Alternatively activated macrophages derived from monocytes and tissue macrophages are phenotypically and functionally distinct. Blood. 2014;123:e110–122. doi: 10.1182/blood-2013-08-520619. [DOI] [PMC free article] [PubMed] [Google Scholar]
- 20.Pesce JT, et al. Arginase-1-expressing macrophages suppress Th2 cytokine-driven inflammation and fibrosis. PLoS Pathog. 2009;5:e1000371. doi: 10.1371/journal.ppat.1000371. [DOI] [PMC free article] [PubMed] [Google Scholar]
- 21.Amit I, Winter DR, Jung S. The role of the local environment and epigenetics in shaping macrophage identity and their effect on tissue homeostasis. Nat Immunol. 2016;17:18–25. doi: 10.1038/ni.3325. [DOI] [PubMed] [Google Scholar]
- 22.Perdiguero EG, Geissmann F. The development and maintenance of resident macrophages. Nature immunology. 2016;17:2–8. doi: 10.1038/ni.3341. [DOI] [PMC free article] [PubMed] [Google Scholar]
- 23.Stephensen CB. Vitamin A, infection, and immune function. Annu Rev Nutr. 2001;21:167–192. doi: 10.1146/annurev.nutr.21.1.167. [DOI] [PubMed] [Google Scholar]
- 24.Hall JA, Grainger JR, Spencer SP, Belkaid Y. The role of retinoic acid in tolerance and immunity. Immunity. 2011;35:13–22. doi: 10.1016/j.immuni.2011.07.002. [DOI] [PMC free article] [PubMed] [Google Scholar]
- 25.Okabe Y, Medzhitov R. Tissue-specific signals control reversible program of localization and functional polarization of macrophages. Cell. 2014;157:832–844. doi: 10.1016/j.cell.2014.04.016. [DOI] [PMC free article] [PubMed] [Google Scholar]
- 26.Barth MW, Hendrzak JA, Melnicoff MJ, Morahan PS. Review of the macrophage disappearance reaction. J Leukoc Biol. 1995;57:361–367. doi: 10.1002/jlb.57.3.361. [DOI] [PubMed] [Google Scholar]
- 27.Gevers D, et al. The Human Microbiome Project: a community resource for the healthy human microbiome. PLoS Biol. 2012;10:e1001377. doi: 10.1371/journal.pbio.1001377. [DOI] [PMC free article] [PubMed] [Google Scholar]
- 28.Parkhurst CN, et al. Microglia promote learning-dependent synapse formation through brain-derived neurotrophic factor. Cell. 2013;155:1596–1609. doi: 10.1016/j.cell.2013.11.030. [DOI] [PMC free article] [PubMed] [Google Scholar]
- 29.Kuwata T, et al. Vitamin A deficiency in mice causes a systemic expansion of myeloid cells. Blood. 2000;95:3349–3356. [PubMed] [Google Scholar]
- 30.Snippert HJ, et al. Intestinal crypt homeostasis results from neutral competition between symmetrically dividing Lgr5 stem cells. Cell. 2010;143:134–144. doi: 10.1016/j.cell.2010.09.016. [DOI] [PubMed] [Google Scholar]
- 31.A complex cell. Nat Immunol. 2015;17:1. doi: 10.1038/ni.3351. [DOI] [PubMed] [Google Scholar]
- 32.Gautier EL, et al. Gata6 regulates aspartoacylase expression in resident peritoneal macrophages and controls their survival. J Exp Med. 2014;211:1525–1531. doi: 10.1084/jem.20140570. [DOI] [PMC free article] [PubMed] [Google Scholar]
- 33.Rosas M, et al. The transcription factor Gata6 links tissue macrophage phenotype and proliferative renewal. Science. 2014;344:645–648. doi: 10.1126/science.1251414. [DOI] [PMC free article] [PubMed] [Google Scholar]
- 34.Wang J, Kubes P. A Reservoir of Mature Cavity Macrophages that Can Rapidly Invade Visceral Organs to Affect Tissue Repair. Cell. 2016;165:668–678. doi: 10.1016/j.cell.2016.03.009. [DOI] [PubMed] [Google Scholar]
- 35.van Furth R, Cohn ZA. The origin and kinetics of mononuclear phagocytes. J Exp Med. 1968;128:415–435. doi: 10.1084/jem.128.3.415. [DOI] [PMC free article] [PubMed] [Google Scholar]
- 36.Gibbings SL, et al. Transcriptome analysis highlights the conserved difference between embryonic and postnatal-derived alveolar macrophages. Blood. 2015;126:1357–1366. doi: 10.1182/blood-2015-01-624809. [DOI] [PMC free article] [PubMed] [Google Scholar]
- 37.Broadhurst MJ, et al. Upregulation of Retinal Dehydrogenase 2 in Alternatively Activated Macrophages during Retinoid-dependent Type-2 Immunity to Helminth Infection in Mice. PLoS Pathog. 2012;8:e1002883. doi: 10.1371/journal.ppat.1002883. [DOI] [PMC free article] [PubMed] [Google Scholar]
- 38.Joyce KL, Morgan W, Greenberg R, Nair MG. Using eggs from Schistosoma mansoni as an in vivo model of helminth-induced lung inflammation. J Vis Exp. 2012:e3905. doi: 10.3791/3905. [DOI] [PMC free article] [PubMed] [Google Scholar]
- 39.Girgis NM, et al. Ly6Chigh Monocytes Become Alternatively Activated Macrophages in Schistosome Granulomas with Help from CD4+ Cells. PLoS Pathog. 2014;10:e1004080. doi: 10.1371/journal.ppat.1004080. [DOI] [PMC free article] [PubMed] [Google Scholar]
- 40.Buenrostro JD, Giresi PG, Zaba LC, Chang HY, Greenleaf WJ. Transposition of native chromatin for fast and sensitive epigenomic profiling of open chromatin, DNA-binding proteins and nucleosome position. Nat Methods. 2013;10:1213–1218. doi: 10.1038/nmeth.2688. [DOI] [PMC free article] [PubMed] [Google Scholar]
- 41.Kim D, et al. TopHat2: accurate alignment of transcriptomes in the presence of insertions, deletions and gene fusions. Genome Biology. 2013;14:R36. doi: 10.1186/gb-2013-14-4-r36. [DOI] [PMC free article] [PubMed] [Google Scholar]
- 42.Anders S, Pyl PT, Huber W. HTSeq–a Python framework to work with high-throughput sequencing data. Bioinformatics. 2015;31:166–169. doi: 10.1093/bioinformatics/btu638. [DOI] [PMC free article] [PubMed] [Google Scholar]
- 43.Langmead B, Salzberg S. Fast gapped-read alignment with Bowtie 2. Nat Methods. 2012;9:357–359. doi: 10.1038/nmeth.1923. [DOI] [PMC free article] [PubMed] [Google Scholar]
- 44.McCarthy MT, O'Callaghan CA. PeaKDEck: a kernel density estimator-based peak calling program for DNaseI-seq data. Bioinformatics. 2014;30:1302–1304. doi: 10.1093/bioinformatics/btt774. [DOI] [PMC free article] [PubMed] [Google Scholar]
- 45.Stark R, Brown G. DiffBind: differential binding analysis of ChIP-Seq peak data. 2011 cited ]Available from: http://bioconductor.org/packages/release/bioc/vignettes/DiffBind/inst/doc/DiffBind.pdf.
- 46.Love MI, Huber W, Anders S. Moderated estimation of fold change and dispersion for RNA-seq data with DESeq2. Genome biology. 2014;15:550. doi: 10.1186/s13059-014-0550-8. [DOI] [PMC free article] [PubMed] [Google Scholar]
- 47.Kaufman L, Rousseeuw PJ. Finding Groups in Data: An Introduction to Cluster Analysis. Wiley; New York: 1990. [Google Scholar]
- 48.Falcon S, Gentleman R. Using GOstats to test gene lists for GO term association. Bioinformatics. 2007;23:257–258. doi: 10.1093/bioinformatics/btl567. [DOI] [PubMed] [Google Scholar]
Associated Data
This section collects any data citations, data availability statements, or supplementary materials included in this article.