

Abstract
Currently, there is high interest in developing multifunctional theranostic platforms for cancer monitoring and chemotherapy. Herein, we report hyaluronan (HA)-coated superparamagnetic iron oxide nanoparticles (HA-SPION) as a promising system for targeted imaging and drug delivery. When incubated with cancer cells, HA-SPIONs were rapidly taken up and the internalization of HA-SPION by cancer cells was much higher than the NPs without HA coating. The high magnetic relaxivity of HA-SPION coupled with enhanced uptake enabled magnetic resonance imaging of cancer cells. Furthermore, doxorubicin (DOX) was attached onto the nanoparticles through an acid responsive linker. While HA-SPION was not toxic to cells, DOX-HA-SPION was much more potent than free DOX to kill not only drug-sensitive but also multi-drug-resistant cancer cells. This was attributed to differential uptake mechanisms and cellular distributions of free DOX and DOX-HA-SPION in cancer cells.
1. INTRODUCTION
Cancer is one of the leading causes of deaths in the world.1 Despite the tremendous progress in understanding the molecular basis of the disease, success in combating cancer has been limited. One of the major obstacles in chemotherapy of cancer is the systemic distribution of the chemotherapeutic compound, which can lead to serious off-target side effects and toxicities.2 Another associated challenge is the development of multidrug resistance (MDR) by tumor cells, which reduces the efficacy of chemotherapy. 3–5 To address these limitations, an attractive approach is to design a carrier system that can selectively deliver cytotoxic doses of drugs to cancer.6 Furthermore, it would be highly desirable that the drug delivery process can be monitored via a noninvasive technique, such as magnetic resonance imaging (MRI), which can provide useful information regarding drug uptake and distribution.7–9
We have become interested in the development of magnetic nanoparticles (NPs)10,11 for biological applications especially cancer studies. Cellular uptake of NPs can be enhanced by immobilizing an “address” molecule on the surface of a nanocarrier, which can be recognized by a receptor overexpressed on tumor cells.9,12 An attractive receptor for tumor targeting is CD44, a cell surface glycoprotein expressed on many types of tumor cells.13–15 In addition, CD44 is recognized as a marker for cancer stem cells,13,16 which are a subpopulation of cancer cells with self-renewing properties.
The major ligand for CD44 is hyaluronan (HA), a naturally occurring glycosaminoglycan composed of the repeating disaccharide β-1,4-D-glucuronic acid-β-1,3-D-N-acetylglucos-amine.17 As an essential component of the extracellular matrix and synovial fluid, HA mainly exists as a highly molecular weight polymer (MW: 1–10 MDa).18 In the body, HA can be cleaved leading to low molecular weight polymers (10 kDa < MW < 500 kDa) as well as HA oligosaccharides (MW < 2000 Da). It has been shown that a HA decasaccharide but not the hexasaccharide can compete with the native polymer for CD44 binding on cell surface.19 Although CD44 only contains a single HA binding site, which can accommodate a HA hexamer,20 HA polymers can simultaneously bind multiple copies of CD44 leading to enhanced avidity.21,22
The interaction between HA and CD44 is important for tumor growth and metastasis.23 Disrupting HA-CD44 interactions by anti-CD44 antibodies,24–27 injection of free HA24–26 or hyaluronidase28,29 resulted in reduction of tumor progression. CD44 has been targeted by monoclonal antibodies (mAbs) or HA for a variety of applications.17,30–35 Compared with the usage of mAbs, HA is less expensive, more readily available, and has higher thermal stability. In addition, HA is highly biocompatible and contains multiple functional groups that can be used in chemical ligation, rendering it an excellent candidate as a targeting ligand.
Herein, we report the development of HA coated magnetic NPs for tumor imaging and drug delivery. With the large surface area, multiple types of agents including fluorophores and chemotherapeutic agents can be immobilized onto the external surface of the NPs. Aided by HA on the particle surface, this construct can greatly enhance the uptake of NPs by CD44-expressing cancer cells. The magnetic and fluorescent properties of the NPs enabled the usage of both MRI and fluorescence imaging to study cellular uptake. Upon attachment of doxorubicin (DOX) onto the HA-NPs, the cytotoxicity of DOX was significantly improved toward not only drug sensitive cancer cell lines but also cancer cells displaying MDR phenotypes, highlighting the advantages of this type of multifunctional NPs. To the best of our knowledge, this is the first time HA coated iron oxide NPs have been used as a platform for both MRI and targeted drug delivery.
2. EXPERIMENTAL SECTION
2.1. Materials and Instrumentation
All chemicals were reagent grade and were used as received from the manufacturers. Iron(III) chloride hexahydrate (FeCl3·6H2O) was purchased from Honeywell Riedel-de Haën, Iron(II) chloride tetrahydrate (FeCl2·4H2O), dextran (9–11 kDa), epichlorohydrin, bovine serum albumin (BSA), dimethylsulfoxide (DMSO), CDMT, N-methylmorpholine (NMM), ethyl-(3,3-dimethylaminopropyl) carbodiimide hydrochloride (EDCI), nuclear fast red solution, fetal bovine serum (FBS), and sodium chloride were purchased from Sigma-Aldrich. Ammonium hydroxide (NH4OH, 28–30%) and hydrogen peroxide (30%) were purchased from CCI. Amberlite IR 120 hydrogen form (Amberlite H+) was purchased from Fluka. Potassium ferrocyanide K4Fe(CN)6 trihydrate was purchased from Mallinckrodt. Adipic dihydrazide (ADH), and 3,3′,5,5′-tetramethylbenzidine (TMB) were purchased from Acros Organics. Sodium hyaluronan (31 kDa) was purchased from Lifecore Biomedicals. Doxorubicin hydrochloride was purchased from Shanghai FChemicals Technology Co., China. SKOV-3 cells were purchased from American Type Culture Collection (ATCC). NCI/ADR-RES cell line was a gift from Prof. Paul Erhardt (University of Toledo). Phosphate buffered saline (PBS), Dulbecco’s modified Eagle medium (DMEM), RPMI 1640 medium, fluorescein isothiocyanate (FITC), sodium pyruvate (100 mM), glutamine, penicillin–streptomycin (Pen Strep) mixture, and the mouse antihuman CD44 monoclonal antibody (clone MEM 85) were purchased from Invitrogen. PE-Cy5 Rat antimouse CD44 monoclonal antibody (clone IM7) was purchased from BD Pharmingen. Tween 20 was purchased from BioRad. CellTiter 96 Aqueous One solution containing 3-(4,5-dimethylthiazol-2-yl)-5-(3-carboxy-methoxyphenyl)-2-(4-sulfophenyl)-2H-tetrazolium (MTS) and phenazine ethosulfate (PES) was purchased from Promega. Ultrafiltration membranes were purchased from Millipore, while dialysis tubings were obtained from BioDesign Inc. SKOV-3 cells were cultured in DMEM while NCI/ADR-RES cell line was cultured in RPMI 1640. All cell culture media was supplemented with 10% inactivated FBS, 1% Pen-Strep mixture, glutamine (2 mM), and sodium pyruvate (1 mM). Dynamic light scattering (DLS) and zeta potential measurements were performed on a Zetasizer Nano zs apparatus (Malvern, U.K.). Transmission electron microscopy (TEM) images were collected on a JEM-2200FS operating at 200 kV using Gatan multiscan CCD camera with Digital Micrograph imaging software. Thermogravimetric analysis (TGA) was carried on a Thermal Advantage (TA-Instruments-Waters LLC) TGA-Q500 series and the samples were burned under nitrogen. FACS experiments were conducted on a BD Vantage SE flow cytometer. HRMAS NMR experiments were carried out on a Varian Inova-500 NMR spectrometer equipped with a 4 mm gHXNanoprobe. Fourier transform infrared (FTIR) spectra were collected on a Mattson spectrometer, Galaxy series FTIR 3000.
2.2. Synthesis of DOX-HA-SPION
ADH (250 mg, 1.45 mmol) was added to an aqueous dispersion of HA-SPION (2.5 mg/mL; 20 mL) and the pH was adjusted to 4.5–4.8 by the addition of 0.1 N aqueous HCl solution. EDCI (5 mg) was added and the reaction was stirred at room temperature for 3 h during which the pH was constantly adjusted to 4.5–4.8. The pH of the aqueous solution was then brought to 7 using 0.1 N aqueous NaOH solution. The solution was purified by ultrafiltration (MWCO 100000). The concentrated sample was lyophilized to yield 59 mg of ADH-HA-SPION.
The lyophilized ADH-HA-SPION (17 mg) was dissolved in dd water (3 mL) by overnight rehydration. DOX hydrochloride (5 mg) was dissolved in dd water (1 mL) by sonication. Acetate buffer (pH 6.0; 6 mL) was added to the nanoparticle mixture followed by the DOX solution. The pH of the reaction mixture was adjusted to 6.0. The mixture was stirred at room temperature for 48 h to allow the formation of the hydrazone linkage between C-13 carbonyl group of DOX and the hydrazide moiety on the nanoparticles. The reaction mixture was neutralized by the dropwise addition of 0.1 N aqueous NaOH solution. The mixture was purified first by dialysis (MWCO 14,000) for two days, and then by ultrafiltration (MWCO 100,000). DOX-HA-SPION (16 mg) was collected. The percentage of DOX loading (w/w) was determined by UV–vis spectroscopy.
2.3. Internalization of DOX-HA-SPION by SKOV-3 Cancer Cells Using Laser Confocal Imaging
SKOV-3 cells (2 × 10⁵ cells/well) in FBS containing-DMEM medium were inoculated in a 4-chambered plate and incubated overnight at 37 °C and 5% CO2. After removing the supernatant and washing the cells, free DOX (0.8 μM, 1 mL) and the equivalent amount of DOX-HA-SPION (50 μg/mL, 1 mL) were added in serum-free DMEM. The cells were incubated for 1 and 4 h. The cytotoxic agents were removed, and the cells were washed with PBS twice and fixed with 10% formalin (0.5 mL/well) for 10 min. After washing the cells with PBS, PBS (200 μL) and DAPI (300 nM, 300 μL) were added for 5 min. The cells were washed with PBS and water, and the plate was covered with aluminum foil until the time of analysis. Images were taken on an Olympus FluoView 1000 LSM confocal microscope. Confocal imaging involving mitochondrial staining was conducted on live cells incubated with nanoparticles. In brief, Hoechst 33342 (10 mg/mL, 4 μL for nucleus labeling of live cells) and Rhodamine 123 (380 μg/mL, 3 μL for mitochondria labeling) were added 30 and 10 min, respectively, before the end of nanoparticle incubation with cells. Excess reagents were then removed and the cells were washed with PBS four times. Serum-containing DMEM (1 mL) was then added to the cells, followed by confocal microscopy fluorescence imaging.
2.4. SKOV-3 and NCI/ADR-RES Binding of DOX-HA-SPION by Flow Cytometry
SKOV-3 cells or NCI/ADR-RES (3 × 10⁵ cells/well) were cultured in a six-well plate overnight in its respective growth medium. The cells were washed with PBS twice. Free DOX (6.7 μg/mL, 1 mL) and DOX-HA-SPION (50 μg/mL, 1 mL) in serum-free DMEM were added to the cells which were incubated for 1 and 4 h. The test reagent was removed, and the cells were washed with PBS (3 times) and collected using 0.25% trypsin/EDTA. The cells were washed with serum-containing DMEM (4 times), resuspended in the growth medium (300 μL), and transferred to FACS tubes. PI (100 μg/mL, 3.3 μL) was added just before measurements. Fluorescence was assessed using flow cytometry.
2.5. MTS Cell Viability Assay
Cells (5000 cells/well, 200 μL) were cultured in serum-containing media in a 96-well plate and incubated at 37 °C for 24 h. The media was removed and the cells were washed with PBS (2×). Various amounts of free DOX and DOX-HA-SPION were added, and the plate was incubated at 37 °C for 24 h. The test reagent was removed and the cells were washed with PBS (2 times). Serum-containing media (150 μL/well) was added and the plate was incubated at 37 °C for 72 h. MTS reagent (20 μL/well) was added and the plate was incubated at 37 °C for 3 h in the dark. A brown color appeared in the wells containing live cells. The optical absorbance was measured on a BioRad plate reader at 490 nm.
3. RESULTS AND DISCUSSION
3.1. Synthesis of the Multifunctional HA-Coated Superparamagnetic Iron Oxide Nanoparticles
The preparation of HA functionalized superparamagnetic iron oxide NPs (HA-SPIONs) started from the amine containing SPION36 by conjugating low molecular weight HA polymer (31 kDa) using 2-chloro-4,6-dimethoxy-1,3,5-triazine (CDMT)37 as the coupling reagent (Figure 1). The HA-SPION was thoroughly characterized by a variety of techniques including TEM, DLS, zeta potential, TGA and HRMAS-NMR (Figure S1). The NPs were fairly homogeneous with an average core size of 5 nm, hydrodynamic diameter of 114 nm and a zeta potential of −47 mV. Based on the TGA data, HA accounted for 44% weight of each HA-SPION. The HA-SPION has high stability in biological media as no significant size changes were observed after NP incubation in buffer or serum containing media over one week (Figure S2).
Figure 1.

The potential utility of HA-SPION in MRI was established by comparing its ability to enhance the T2* magnetic relaxation rate (r2* = 1/T2*) of water in a magnetic field with that of Feridex NP, a FDA approved liver cancer MR imaging agent. Feridex (r2* = 309 mM−1 Fe.s−1) was modified similarly to HA-SPION producing HA-Feridex, which decreased its r2* value to 238 mM−1s−1. In comparison, HA-SPION has higher magnetic relaxivity (r2* = 431 mM−1 s−1; Figure S3), suggesting it can be a very useful MRI contrast agent. The exact reason why HA modification on SPION increased its relaxivity while HA-Feridex had lower relaxivity was not clear. It is likely due to the difference in surface coating thickness and the degree of NP aggregation.38,39
Besides its excellent magnetic relaxivity, another advantage of using the SPION platform is the possibility of attaching multiple types of agents onto the external surface.40 To aid in optical tracking of the NPs, fluorescein isothiocyanate (FITC) was covalently immobilized onto HA-SPION through reaction with the residual amines and/or hydroxyl groups generating the fluorescent FITC-HA-SPION (Figure 1a). Furthermore, the attachment of a chemotherapeutic compound, doxorubicin (DOX), was explored to test drug delivery application. An important consideration in drug delivery is the selective release of drugs once inside the tumor cells. The linkage between DOX and the NPs must be stable enough to prevent the premature release of the drug in the media, but breaks readily once internalized by the tumor cells. It is known that, while the pH of physiological media for cells is near 7.4, it drops to around 5.5 in late endosomes and approaches pH 4.5 in lysosomes.41 To take advantage of the effect of differential pH values for drug release, a hydrazone linker was tested,42–44 which can be easily formed at pH 7.4, but should be hydrolyzed rapidly under acidic condition (pH < 5). For hydrazone formation on NPs, the HA-SPION was functionalized with adipic acid dihydrazide (ADH) using ethyl-N,N-diethylaminopropyl carbodiimide hydrochloride (EDCI) as a coupling reagent leading to ADH-HA-SPION (Figure 1b). A 5-fold excess of ADH was used to eliminate the cross coupling between NPs. As the carboxylates on HA-SPION reacted with ADH, the pH of the reaction would increase. It was important to maintain the reaction pH around 5 by the continuous addition of 0.1 N HCl, ensuring that the free amino groups (pKa ~ 9) on the HA-SPION were protonated and unreactive, while the hydrazides from ADH (pKa ~ 3.0) were deprotonated and ready for coupling.45 With the NPs functionalized by ADH, DOX was then added to ADH-HA-SPION, which formed hydrazone with the C-13 carbonyl group of DOX at a pH of 6.0 (Figure 1b). The success of this conjugation reaction was validated by infrared (IR) and UV–vis spectra. The IR spectrum showed the disappearance of the band at 1730 cm−1 corresponding to C-13 carbonyl of DOX (Figure S4). The presence of iron oxide in the core was evident by the Fe–O stretching band at 560 cm−1. HR-MAS NMR and UV–vis spectra of DOX-HA-SPION showed characteristics of DOX and a loading level of 2.1% by weight was obtained from DOX absorbance (Figure S5a). The DOX-HA-SPIONs have similar hydrodynamic radii, zeta potential, and r2* value as HA-SPION (Figures S1 and S5b).
3.2. Determination of Cellular Uptake and Cellular Distribution of HA-NPs
The expression of CD44 on human ovarian cancer cell SKOV-3 was examined by immunohistostaining. Upon incubation of SKOV-3 cells with a PE-Cy5 labeled rat antimouse CD44 IM7 mAb, cells showed significant cell surface staining by IM7 (Figure S6a). CD44 expression in SKOV-3 cells was also confirmed by Western blot (Figure S6b).
To validate that HA immobilized on the NPs retains its biological recognition, a competitive ELISA assay was established.31 The HA binding domain of CD44 was attached on a microtiter plate, and the effects of various NPs on the binding between CD44 and a HA polymer were evaluated. The SPION without HA did not show any inhibitory activity toward HA and CD44 interaction at concentrations up to 100 μg/mL (Figure S7). In contrast, the HA-SPION inhibited the binding with an IC50 value of 1.3 μg/mL (Figure S8), which confirmed that HA is critical for the binding between HA-SPION and CD44.
Next we examined cancer cell binding of FITC-HA-SPION by flow cytometry with the corresponding FITC-SPION showing the same level of fluorescent emission as controls. Tumor cells treated with HA-SPION exhibited higher fluorescence signals and dose dependent responses with more than 10-fold enhancement observed for SKOV-3 cells over control particles (Figure 2). The binding of HA-SPION was rapid with no significant changes after 2 h (Figure S9).
Figure 2.

Dose dependent NP binding by SKOV-3 cells as measured by flow cytometry after incubating NP with cells for 2 h. SPION and HA-SPION with the same amount of FITC were incubated with the cells. For 1×, FITC concentrations on both NPs were 0.5 μg/mL as determined from UV–vis. The cellular binding of HA-SPION was much higher than that of SPION.
To determine whether HA-SPION was internalized, SKOV-3 cells were analyzed by confocal microscopy upon incubation with HA-SPION (Figure 3 and Figure S10). The green fluorescence resulting from FITC-HA-SPION was observed inside the cells in both the cytoplasm and the nucleus.31,46 The internalization of the HA-SPION was confirmed by Prussian blue staining, a staining method giving a characteristic blue color in the presence of ferric ions. While the cells showed no obvious blue stains with SPION (Figure S11), incubation of HA-SPION with tumor cells led to blue color inside the cells (Figure S11). These results are consistent with the enhanced cellular binding of HA-SPION observed by flow cytometry.
Figure 3.

Confocal microscopy images of SKOV-3 cells after incubation with FITC-HA-SPION. (a) DAPI channel showing the location of nucleus; (b) FITC channel showing the location of the NPs; and (c) overlay of DAPI, FITC, and DIC images. These images clearly showed that the NPs were inside the cells. The scale bar is 10 μm.
3.3. Evidence for the Role of CD44 in HA-SPION Uptake
To test the CD44 dependence of cellular uptake of HA-SPION, antibody blocking experiments were carried out using the anti-CD44 mAb MEM-85. MEM-85 is known to bind to CD44 close to the HA binding site, thus, reducing the HA affinity with CD44.47 Upon incubation of SKOV-3 cells with MEM-85, the cellular uptake of HA-SPION was reduced by 39%, while the uptake of SPION without HA was not affected much (Figure S12). This supports the important role of CD44 in mediating cellular uptake of HA-SPION. The higher uptake of HA-SPION compared to SPION in the presence of MEM-85 can be attributed to the incomplete blocking of CD44 by MEM-85 or the possible presence of HA receptors other than CD44 on SKOV-3 cells.48
3.4. Uptake of HA-SPIONs by Cancer Cells Detected by MRI
As discussed above, it would be highly desirable if a noninvasive method such as MRI can be used to image cancer and guide the drug delivery process.7–9 The HA-SPION has high magnetic relaxivity, thus, can serve as a useful MRI contrast agent to image cells and tissues that have selectively accumulated the NPs. To assess the feasibility of monitoring the enhanced uptake of HA-SPION by cancer cells using MRI, we compared HA-SPION with Feridex, the FDA approved imaging agent bearing no targeting ligands. The same amounts of HA-SPION and Feridex based on iron content were incubated with SKOV-3 cells. Upon removing the unbound particles by thorough washing, the cells were suspended in agarose gel, from which T2* weighted MR images were collected. Quantitative analysis showed that Feridex did not cause significant changes in T2* values of cells compared to control cells with no NPs, while HA-SPION reduced T2* value by 42% (Figure 4). These results can be interpreted by the higher amount of iron inside the cells incubated with HA-SPION, highlighting the advantage of active targeting.
Figure 4.
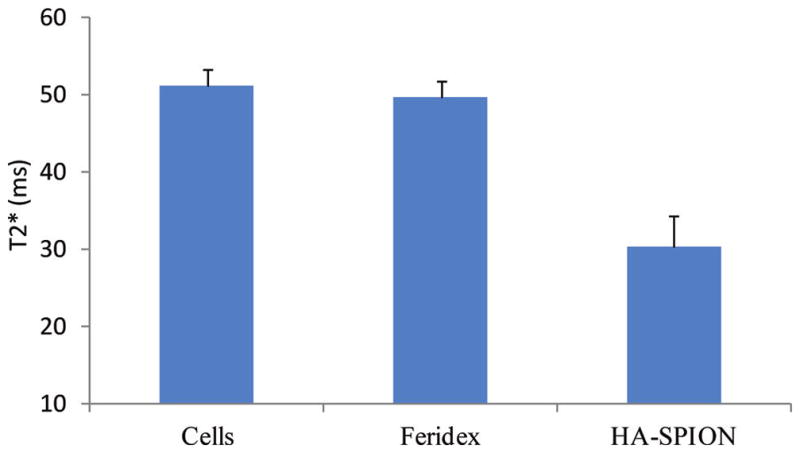
T2* values of SKOV-3 cells, cells incubated for 24 h with Feridex or HA-SPION at the same Fe concentrations after washing off unbound particles.
3.5. In Vitro DOX Release from DOX-HA-SPION
As the immobilization of HA onto NPs can lead to enhanced uptake by cancer cells, we explored next the application in drug delivery using the multifunctional DOX-HA-SPIONs. To evaluate the rate of drug release, the DOX-HA-SPIONs were incubated in buffers with different pH values (Figures 5 and S13). At pH 9.0, 7.4, and 5.0, after initial release of small amounts of DOX, the amount of free DOX in the media did not change much after 24 h, demonstrating that DOX-HA-SPIONs were quite resistant to hydrolysis at these pH values. In contrast, more than 50% DOX release at pH 7.4 from other types of DOX-NPs has been reported in the literature.30,42,49 The higher stability of the DOX-HA-SPIONs at neutral pH may be due to the different linker structures43 and possibly the buffering effect of the polyanionic HA on the NP surface. To mimic the late endosomal and lysosomal environments encountered by the NPs inside cells, the pH of the incubation media was decreased to 4.5 or 4.0, which led to rapid discharge of DOX to the media. It is known that HA is less stable under highly acidic condition (pH < 3) compared to neutral pH or slightly basic condition.50 To ascertain that DOX release from DOX-HA-SPION was not a result of HA backbone degradation, we dissolved FITC-labeled HA (31 kDa)51 in pH 4.5 buffer. Following incubation, the solution was centrifuged through a membrane filter with a molecular weight cutoff of 10 kDa. The amount of FITC released was determined by measuring the fluorescence of the filtrate, which showed minimal fluorescence (<5% of the NP fluorescence, Figure S13) after 48 h. This observation indicated that the HA backbone degradation was minimal under the conditions tested and the release of DOX from the nano-construct was due to cleavage of the hydrazone linker under mild acidic conditions (pH ~ 4.5).
Figure 5.
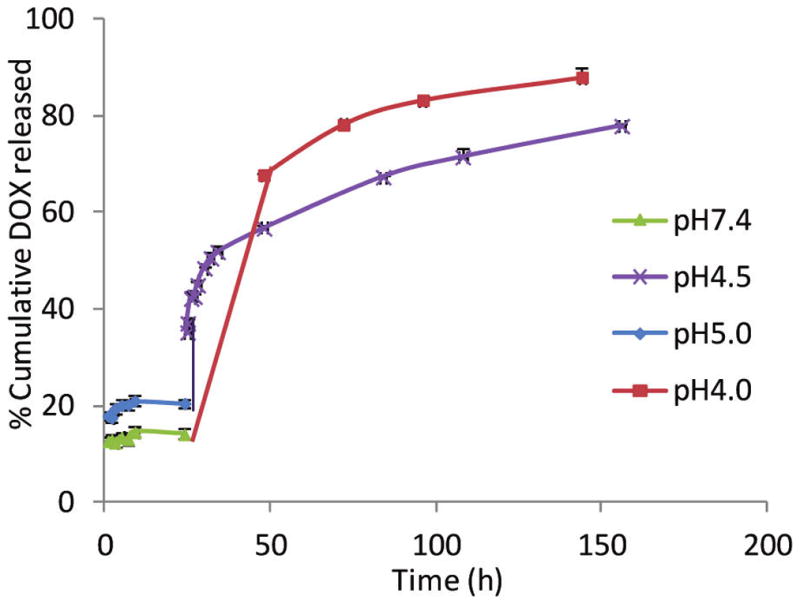
Time course of DOX release from DOX-HA-SPION at various pH values. At pH 9.0, the release profile was very similar to that at pH 7.4. For the sake of clarity, the data for pH 9.0 are not shown. The percentage of DOX released was calculated by dividing the amount of free DOX released to solution by the total amount of DOX on the DOX-HA-SPION. A total of 44.6 μg DOX/mL was release at pH 4.0 from DOX-HA-SPION (2.5 mg/mL).
3.6. Cell Viability Assays
The cytotoxicity of the DOX-HA-SPION was evaluated in a MTS cell viability assay against SKOV-3 ovarian cancer cells. The cancer cells were incubated with different concentrations of an agent (HA-SPION, free DOX, or DOX-HA-SPION) for 24 h after which the compound was washed off and the cells were allowed to grow in drug-free serum containing media for 72 h. Following the addition of the MTS reagent, viability of the cells was assessed (Figure 6). The HA-SPION itself without DOX was not toxic to cells at the highest NP quantity evaluated (1 mg/mL). With free DOX, the concentration needed to kill half of the cancer cells was 0.92 μg/mL, which was comparable to literature values.52 Interestingly, DOX-HA-SPION was much more toxic to SKOV-3 cells than free DOX with an IC50 value of 0.079 μg DOX/mL. To exclude the possibility that NPs may influence the physiology of the cells by sensitizing them toward DOX, SKOV-3 cells were incubated with free unligated DOX in the presence of HA-SPION. Without the covalent linkage with the NP, free DOX did not exhibit significant differences in toxicity in the presence or absence of HA-SPION (Figure S14). This suggested the importance of covalently linking DOX with HA-SPION for enhanced cytotoxicity.
Figure 6.

MTS cell viability assay of SKOV-3 and NCI/ADR-RES cells in the presence of DOX and DOX-HA-SPION. DOX-HA-SPION showed significantly enhanced cytotoxicities to both cell lines.
The delivery of DOX to cancer cells has been studied using a variety of platforms, including liposomes, nanoparticles, and polymersomes,17,30,42,49,53–57 with a liposomal formulation of DOX (Doxil) approved by FDA for cancer therapy. However, Doxil showed lower cytotoxicity vs free DOX in in vitro cell viability assays.58 In vivo, the therapeutic benefits of Doxil come from the higher drug concentration reaching tumor sites through the enhanced permeability and retention effect.59 To enhance the drug efficacy, methods for targeted delivery of DOX have been investigated. However, in many cases, the cytotoxicity of DOX conjugates was still reduced in vitro. For example, DOX immobilized on antibodies or immunoliposomes was found to be less active than free DOX in cell cultures.60–62 Similar phenomena were observed with DOX-NPs coated with targeting agents such as cancer-targeting peptides,49,63 folate,58 or RGD.64 The reduction in potency can be due to several possible factors including (1) lower intracellular concentration of DOX; and (2) inefficient release of free DOX from the carrier. Thus, it is significant that the DOX-HA-SPION has much enhanced cytotoxicity compared to that of free DOX.30,57,65
To better understand the higher cytotoxicity of DOX-HA-SPION compared with free DOX, the amount of DOX delivered into the cells was quantified by flow cytometry through the inherent fluorescence of DOX (Figure 7). Although the levels of uptake of DOX-HA-SPION were lower with 1 and 4 h incubation, the overall levels of DOX in SKOV-3 cells were similar when cells were incubated with equivalent quantities of free DOX and DOX-HA-SPION for 24 h. Next, the intracellular distribution of DOX in cancer cells was analyzed using confocal microscopy. After 1 h incubation, free DOX was found localized in the nucleus of the SKOV-3 cells with no detectable presence in the cytoplasm (Figure 8).66–68 No significant changes were observed with longer incubation periods. On the other hand, DOX delivered by DOX-HA-SPION accumulated in the cytosol but not in nucleus after 1 h. With DOX-HA-SPION incubation for 4 h, DOX began to appear in the nucleus. The difference in cellular distribution of free DOX and DOX-HA-SPION can be possibly attributed to the different uptake mechanisms. While free DOX is internalized by passive diffusion through the cell membrane, the uptake of DOX-HA-SPION is directed by the targeting agent via endocytosis, which is then followed by escape from the endosomes or lysosomes.67 The release of DOX from NPs can be either due to the hydrolysis of the hydrazone linkage or the digestion of the HA polymer by endosomal/lysosomal hyaluronidase allowing the DOX-containing fragments to traffic to mitochondria or the nuclei of cells.
Figure 7.

Mean DOX fluorescence of SKOV-3 cells measured by flow cytometry after incubation with free DOX or DOX-HA-SPION for 1, 4, or 24 h followed by thorough washing.
Figure 8.

Confocal microscopy images of SKOV-3 cells after incubation with (a–d) free DOX, (e–h) 1 h with DOX-HA-SPION, and (i–l) 4 h with DOX-HA-SPION. (a,e,i) DAPI channel showing location of nucleus; (b,f,j) DOX channel; (c,g,k) overlay of DOX channel with DIC images; and (d,h,l) overlay of DAPI, DOX channels with laser images. The scale bar is 10 μm.
The exact cytotoxic mechanism of DOX is complex and still somewhat unclear. A major cellular target for DOX is the DNA inside the nucleus. Once entering the nucleus, with its flat aromatic ring system, DOX can intercalate and wedge between the DNA bases, thus blocking DNA synthesis and transcription and causing cell death.69 Another possible target for DOX is mitochondria, as DOX can induce collapse of the mitochondrial transmembrane potential leading to oxidative stress and apoptotic signals.70,71 To test this, live SKOV-3 cells were incubated with DOX-HA-SPION for 1 h and mitochondria of the cells were then labeled with a green dye Rhodamine 123. Confocal microscopy images showed extensive overlap of DOX fluorescence with that from Rhodamine 123, suggesting significant amounts of NPs were localized in mitochondria (Figure S14). Thus, the enhanced cytotoxicity of DOX delivered by HA-SPION can be possibly attributed to the significant accumulation of DOX in mitochondria delivered by NPs in addition to that in the nucleus. Furthermore, reduction of the C-13 carbonyl group of DOX by reductases is the initial step in DOX metabolism and detoxicification.72 DOX immobilized on HA-SPION will not be a substrate for this transformation as the carbonyl group formed a hydrazone linkage with the NPs. This can result in higher stability of the drug and hence higher potency.
MDR is a major challenge in tumor therapy.3 For example, compared to SKOV-3, a MDR cell line NCI/ADR-RES (the trade name of DOX is Adriamycin or ADR) is much less sensitive to DOX with an IC50 value of 68.2 μg/mL (Figure 6). We tested whether the HA-SPION delivery system can enhance the cytotoxicity of DOX toward MDR cells. With 24 h incubation, the intracellular level of DOX in NCI/ADR-RES cells was 30% higher when the cells were treated with DOX-HA-SPION than with free DOX (Figure 9a). The enhanced uptake was confirmed by confocal microscopy. With DOX-HA-SPION, after 24 h incubation, the DOX fluorescence was clearly observed inside the cells (Figure 9g), while the characteristic red fluorescence of DOX was weaker from cells treated with free DOX (Figure 9c). Importantly, cell viability assay demonstrated a 4-fold enhancement in potency using DOX-HA-SPION (IC50 = 17.5 μg/mL; Figure 6). This suggests that with further development, the HA-SPION can be a promising platform for drug delivery to MDR cancer cells.
Figure 9.

(a) Mean DOX fluorescence of NCI/ADR-RES cells measured by flow cytometry after incubation with free DOX or DOX-HA-SPION for 1, 4, or 24 h followed by thorough washing. Confocal microscopy images of NCI/ADR-RES cells after incubation for 24 h with (b–e) free DOX and (f–i) DOX-HA-SPION. (b,f) DAPI channel showing location of nucleus; (c,g) DOX channel; (d,h) laser images; and (e,i) overlay of DAPI, DOX channels with laser images. The scale bar is 10 μm.
4. CONCLUSION
We have developed a multifunctional NP system where the targeting ligand, imaging agent, and therapeutic compound could all be incorporated into one platform. HA immobilized on NPs significantly enhanced the cellular uptake of the NPs through the interaction with CD44. With its superior magnetic relaxivity, the HA-SPIONs enabled the magnetic resonance imaging of cancer cells. While the HA-NPs were highly biocompatible, the DOX-HA-SPION was found to be much more cytotoxic to cancer cells compared to free DOX. Importantly, the DOX-HA-SPION was able to enhance the toxicity of DOX to the MDR NCI/ADR-RES cells. This is the first time HA coated magnetic NPs have been used as a platform for both magnetic resonance imaging and targeted drug delivery. When fully developed, the HA-SPION system can become a promising platform for image guided drug delivery to cancer cells.
Supplementary Material
Acknowledgments
This work was supported by an NSF CAREER award (X.H.). We would like to thank the Department of Radiology, Michigan State University, for the very generous support towards access of the MRI scanner.
Footnotes
Notes
The authors declare no competing financial interest.
Additional experimental procedures, methods, and supplementary figures. This material is available free of charge via the Internet at http://pubs.acs.org.
References
- 1.American Cancer Society. Cancer Facts and Figures. American Cancer Society; Atlanta, Georgia: 2010. [Google Scholar]
- 2.Gewirtz DA, Bristol ML, Yalowich JC. Curr Opin Invest Drugs. 2010;11:612–614. [PubMed] [Google Scholar]
- 3.Perez-Tomas R. Curr Med Chem. 2006;13:1859–1876. doi: 10.2174/092986706777585077. [DOI] [PubMed] [Google Scholar]
- 4.Gottesman MM, Ling V. FEBS Lett. 2006;580:998–1009. doi: 10.1016/j.febslet.2005.12.060. [DOI] [PubMed] [Google Scholar]
- 5.Gottesman MM, Fojo T, Bates SE. Nat Rev Cancer. 2002;2:48–58. doi: 10.1038/nrc706. [DOI] [PubMed] [Google Scholar]
- 6.Jaracz S, Chen J, Kuznetsova LV, Ojima I. Bioorg Med Chem. 2010;13:5043–5054. doi: 10.1016/j.bmc.2005.04.084. [DOI] [PubMed] [Google Scholar]
- 7.Gao J, Gu H, Xu B. Acc Chem Res. 2009;42:1097–1107. doi: 10.1021/ar9000026. [DOI] [PubMed] [Google Scholar]
- 8.Gindy ME, Prud’homme RK. Exp Opin Drug Delivery. 2009;6:865–878. doi: 10.1517/17425240902932908. [DOI] [PubMed] [Google Scholar]
- 9.Peng XH, Qian X, Mao H, Wang AY, Chen Z, Nie S, Shin DM. Int J Nanomed. 2008;3:311–321. doi: 10.2147/ijn.s2824. [DOI] [PMC free article] [PubMed] [Google Scholar]
- 10.El-Boubbou K, Zhu DC, Vasileiou C, Borhan B, Prosperi D, Li W, Huang X. J Am Chem Soc. 2010;132:4490–4499. doi: 10.1021/ja100455c. [DOI] [PubMed] [Google Scholar]
- 11.El-Boubbou K, Gruden C, Huang X. J Am Chem Soc. 2007;129:13392–13393. doi: 10.1021/ja076086e. [DOI] [PubMed] [Google Scholar]
- 12.Li X, Zhou H, Yang L, Du G, Pai-Panandiker AS, Huang X, Yan B. Biomaterials. 2010;32:2540–2545. doi: 10.1016/j.biomaterials.2010.12.031. and references cited therein. [DOI] [PMC free article] [PubMed] [Google Scholar]
- 13.Zöller M. Nat Rev Cancer. 2011;11:254–267. doi: 10.1038/nrc3023. [DOI] [PubMed] [Google Scholar]
- 14.Misra S, Heldin P, Hascall VC, Karamanos NK, Skandalis SS, Markwald RR, Ghatak S. FEBS J. 2011;278:1429–1443. doi: 10.1111/j.1742-4658.2011.08071.x. [DOI] [PMC free article] [PubMed] [Google Scholar]
- 15.Sy MS, Mori H, Liu D. Curr Opin Oncol. 1997;9:108–112. doi: 10.1097/00001622-199701000-00017. [DOI] [PubMed] [Google Scholar]
- 16.Sarkar B, Dosch J, Simeone DM. Chem Rev. 2009;109:3200–3208. doi: 10.1021/cr9000397. [DOI] [PubMed] [Google Scholar]
- 17.Platt VM, Szoka FC., Jr Mol Pharm. 2008;5:474–486. doi: 10.1021/mp800024g. and references cited therein. [DOI] [PMC free article] [PubMed] [Google Scholar]
- 18.Lapcik L, Jr, Lapcik L, De Smedt S, Demeester J, Chabrecek P. Chem Rev. 1998;98:2663–2684. doi: 10.1021/cr941199z. [DOI] [PubMed] [Google Scholar]
- 19.Tammi R, MacCallum D, Hascall VC, Pienimäki JP, Hyttinen M, Tammi M. J Biol Chem. 1998;273:28878–28888. doi: 10.1074/jbc.273.44.28878. [DOI] [PubMed] [Google Scholar]
- 20.Banerji S, Wright AJ, Noble M, Mahoney DJ, Campbell ID, Day AJ, Jackson DG. Nat Struct Mol Biol. 2007;14:234–239. doi: 10.1038/nsmb1201. [DOI] [PubMed] [Google Scholar]
- 21.Wolny PM, Banerji S, Gounou C, Brisson AR, Day AJ, Jackson DG, Richter RP. J Biol Chem. 2010;285:30170–30180. doi: 10.1074/jbc.M110.137562. [DOI] [PMC free article] [PubMed] [Google Scholar]
- 22.Lesley J, Hascall VC, Tammi M, Hyman R. J Biol Chem. 2000;275:26967–26975. doi: 10.1074/jbc.M002527200. [DOI] [PubMed] [Google Scholar]
- 23.Bartolazzi A, Peach R, Aruffo A, Stamenkovic I. J Exp Med. 1994;180:53–66. doi: 10.1084/jem.180.1.53. [DOI] [PMC free article] [PubMed] [Google Scholar]
- 24.Krause DS, Lazarides K, von Andrian UH, van Etten RA. Nat Med. 2006;12:1175–1180. doi: 10.1038/nm1489. [DOI] [PubMed] [Google Scholar]
- 25.Jin L, Hope KJ, Zhai Q, Smadja-Joffe F, Dick JE. Nat Med. 2006;12:1167–1174. doi: 10.1038/nm1483. [DOI] [PubMed] [Google Scholar]
- 26.Charrad R-S, YL, Delpech B, Balitrand N, Clay D, Jasmin C, Chomienne C, Smadja-Joffe F. Nat Med. 1999;5:669–676. doi: 10.1038/9518. [DOI] [PubMed] [Google Scholar]
- 27.Verel I, Heider KH, Siegmund M, Ostermann E, Patzelt E, Sproll M, Snow GB, Adolf GR, Van Dongen GAMS. Int J Cancer. 2002;99:396–402. doi: 10.1002/ijc.10369. [DOI] [PubMed] [Google Scholar]
- 28.Eikenes L, Tari M, Tufto I, Bruland OS, de Lange Davies C. Br J Cancer. 2005;93:81–88. doi: 10.1038/sj.bjc.6602626. [DOI] [PMC free article] [PubMed] [Google Scholar]
- 29.Shuster S, Frost GI, Csoka AB, Formby B, Stern R. Int J Cancer. 2002;102:192–197. doi: 10.1002/ijc.10668. [DOI] [PubMed] [Google Scholar]
- 30.Upadhyay KK, Bhatt AN, Mishra AK, Dwarakanath BS, Jain S, Schatz C, Le Meins JF, Farooque A, Chandraiah G, Jain AK, Misra A, Lecommandoux S. Biomaterials. 2010;31:2882–2892. doi: 10.1016/j.biomaterials.2009.12.043. [DOI] [PubMed] [Google Scholar]
- 31.Kamat M, El-Boubbou K, Zhu DC, Lansdell T, Lu X, Li W, Huang X. Bioconjugate Chem. 2010;21:2128–2135. doi: 10.1021/bc100354m. [DOI] [PubMed] [Google Scholar]
- 32.Choi YK, Chung H, Min KH, Yoon HY, Kim K, Park JH, Kwon IC, Jeong SY. Biomaterials. 2010;31:106–114. doi: 10.1016/j.biomaterials.2009.09.030. [DOI] [PubMed] [Google Scholar]
- 33.Kim KS, Hur W, Park SJ, Hong SW, Choi JE, Goh EJ, Yoon SK, Hahn SK. ACS Nano. 2010;6:3005–3014. doi: 10.1021/nn100589y. [DOI] [PubMed] [Google Scholar]
- 34.Banzato A, Bobisse S, Rondina M, Renier D, Bettella F, Esposito G, Quintieri L, Meléndez-Alafort L, Mazzi U, Zanovello P, Rosato A. Clin Cancer Res. 2008;14:3598–3606. doi: 10.1158/1078-0432.CCR-07-2019. [DOI] [PubMed] [Google Scholar]
- 35.Lee H, Lee K, Kim IK, Park TG. Biomaterials. 2008;29:4709–4718. doi: 10.1016/j.biomaterials.2008.08.038. [DOI] [PubMed] [Google Scholar]
- 36.Palmacci S, Josephson L, Groman EV. Synthesis of Polymer-covered Superparamagnetic Oxide Colloids for Magnetic Resonance Contrast Agents or Other Applications. 9505669. US Patent. 1995
- 37.Bergman K, Elvingson C, Hilborn J, Svensk G, Bowden T. Biomacromolecules. 2007;8:2190–2195. doi: 10.1021/bm0701604. [DOI] [PubMed] [Google Scholar]
- 38.Kaittanis C, Santra S, Santiesteban OJ, Henderson TJ, Perez JM. J Am Chem Soc. 2011;133:3668–3676. doi: 10.1021/ja1109584. [DOI] [PMC free article] [PubMed] [Google Scholar]
- 39.LaConte LEW, Nitin N, Zurkiya O, Caruntu D, O’Connor CJ, Hu X, Bao G. J Magn Reson Imag. 2007;26:1634–1641. doi: 10.1002/jmri.21194. [DOI] [PubMed] [Google Scholar]
- 40.Gupta AK, Naregalkar RR, Vaidya VD, Gupta M. Nanomedicine. 2007;2:23–39. doi: 10.2217/17435889.2.1.23. [DOI] [PubMed] [Google Scholar]
- 41.Mellman I, Fuchs R, Helenius A. Annu Rev Biochem. 1986;55:663–700. doi: 10.1146/annurev.bi.55.070186.003311. [DOI] [PubMed] [Google Scholar]
- 42.Wang F, Wang YC, Dou S, Xiong MH, Sun TM, Wang J. ACS Nano. 2011;5:3679–3692. doi: 10.1021/nn200007z. [DOI] [PubMed] [Google Scholar]
- 43.Kaneko T, Willner D, Monkovíc I, Knipe JO, Braslawsky GR, Greenfield RS, Vyas DM. Bioconjugate Chem. 1991;2:133–141. doi: 10.1021/bc00009a001. [DOI] [PubMed] [Google Scholar]
- 44.Kratz F, Beyer U, Schumacher P, Krueger M, Zahn H, Roth T, Fiebig HH, Unger C. Bioorg Med Chem Lett. 1997;7:617–622. [Google Scholar]
- 45.Pouyani T, Prestwich GD. Bioconjugate Chem. 1994;5:339–47. doi: 10.1021/bc00028a010. [DOI] [PubMed] [Google Scholar]
- 46.Luo Y, Prestwich GD. Bioconjugate Chem. 1999;10:755–763. doi: 10.1021/bc9900338. [DOI] [PubMed] [Google Scholar]
- 47.Bajorath J, Greenfield B, Munro SB, Day AJ, Aruffo A. J Biol Chem. 1998;273:338–343. doi: 10.1074/jbc.273.1.338. [DOI] [PubMed] [Google Scholar]
- 48.Maxwell CA, McCarthy J, Turley E. J Cell Sci. 2005;121:925–932. doi: 10.1242/jcs.022038. [DOI] [PubMed] [Google Scholar]
- 49.Kievit FM, Wang FY, Fang C, Mok H, Wang K, Silber JR, Ellenbogen RG, Zhang M. J Controlled Release. 2011;152:76–83. doi: 10.1016/j.jconrel.2011.01.024. [DOI] [PMC free article] [PubMed] [Google Scholar]
- 50.Tokita Y, Okamoto A. Polym Degrad Stab. 1995;48:269–273. [Google Scholar]
- 51.El-Dakdouki MH, El-Boubbou K, Zhu DC, Huang X. RSC Adv. 2011;1:1449–1452. doi: 10.1039/C1RA00737H. [DOI] [PMC free article] [PubMed] [Google Scholar]
- 52.Luo Y, Bernshaw NJ, Lu ZR, Kopecek J, Prestwich GD. Pharm Res. 2002;19:396–402. doi: 10.1023/a:1015170907274. [DOI] [PubMed] [Google Scholar]
- 53.Yan Y, Johnston APR, Dodds SJ, Kamphuis MMJ, Ferguson C, Parton RG, Nice EC, Heath JK, Caruso F. ACS Nano. 2010;4:2928–2936. doi: 10.1021/nn100173h. [DOI] [PubMed] [Google Scholar]
- 54.Lee SM, Ahn RW, Chen F, Fought AJ, O’Halloran TV, Cryns VL, Nguyen ST. ACS Nano. 2010;9:4971–4978. doi: 10.1021/nn100560p. [DOI] [PMC free article] [PubMed] [Google Scholar]
- 55.Sun H, Guo B, Li X, Cheng R, Meng F, Liu H, Zhong Z. Biomacromolecules. 2010;11:848–854. doi: 10.1021/bm1001069. [DOI] [PubMed] [Google Scholar]
- 56.Hu X, Liu S, Huang Y, Chen X, Jing X. Biomacromolecules. 2010;11:2094–2102. doi: 10.1021/bm100458n. [DOI] [PubMed] [Google Scholar]
- 57.Eliaz RE, Nir S, Marty C, Szoka FC., Jr Cancer Res. 2004;64:711–718. doi: 10.1158/0008-5472.can-03-0654. [DOI] [PubMed] [Google Scholar]
- 58.Goren D, Horowitz AT, Tzemach D, Tarshish M, Zalipsky S, Gabizon A. Clin Cancer Res. 2000;6:1949–1957. [PubMed] [Google Scholar]
- 59.Peer D, Margalit R. Int J Cancer. 2004;108:780–789. doi: 10.1002/ijc.11615. [DOI] [PubMed] [Google Scholar]
- 60.Lopes de Menezes DE, Pilarski LM, Allen TM. Cancer Res. 1998;58:3320–3330. [PubMed] [Google Scholar]
- 61.Sjögren HO, Isaksson M, Willner D, Hellström I, Hellström KE, Trail PA. Cancer Res. 1997;57:4530–4536. [PubMed] [Google Scholar]
- 62.Vingerhoeds MH, Steerenberg PA, Hendriks JJ, Dekker LC, Van Hoesel QG, Crommelin DJ, Storm G. Br J Cancer. 1996;74:1023–1029. doi: 10.1038/bjc.1996.484. [DOI] [PMC free article] [PubMed] [Google Scholar]
- 63.Guthi JS, Yang SG, Huang G, Li S, Khemtong C, Kessinger CW, Peyton M, Minna JD, Brown KC, Gao J. Mol Pharm. 2010;7:32–40. doi: 10.1021/mp9001393. [DOI] [PMC free article] [PubMed] [Google Scholar]
- 64.Ryppa C, Mann-Steinberg H, Fichtner I, Weber H, Satchi-Fainaro R, Biniossek ML, Kratz F. Bioconjugate Chem. 2008;19:1414–1422. doi: 10.1021/bc800117r. [DOI] [PubMed] [Google Scholar]
- 65.For examples of enhanced cytotoxicities by delivered DOX, see: Zou P, Yu Y, Wang A, Zhong Y, Welton A, Galbán C, Wang S, Sun D. Mol Pharm. 2010;7:1974–1985. doi: 10.1021/mp100273t.
- 66.For other examples of DOX accumulation in nucleus, see: Shuai XT, Ai H, Nasongkla N, Kim S, Gao J. J Controlled Release. 2004;98:415–426. doi: 10.1016/j.jconrel.2004.06.003.
- 67.Yang X, Grailer JJ, Rowland IJ, Javadi A, Hurley SA, Matson VZ, Steeber DA, Gong S. ACS Nano. 2010;4:6805–6817. doi: 10.1021/nn101670k. [DOI] [PubMed] [Google Scholar]
- 68.Bae Y, Fukushima S, Harada A, Kataoka K. Angew Chem, Int Ed. 2003;42:4788–4791. doi: 10.1002/anie.200250653. [DOI] [PubMed] [Google Scholar]
- 69.Momparier RL, Karon M, Siegel SE, Avila F. Cancer Res. 1976;36:2891–5. [PubMed] [Google Scholar]
- 70.Kim SY, Kim SJ, Kim BJ, Rah SY, Chung SM, Im MJ, Kim UH. Exp Mol Med. 2006;38:535–545. doi: 10.1038/emm.2006.63. [DOI] [PubMed] [Google Scholar]
- 71.Shadle SE, Bammel BP, Cusack BJ, Knighton RA, Olson SJ, Mushlin PS, Ison RDO. Biochem Pharmacol. 2000;60:1435–1444. doi: 10.1016/s0006-2952(00)00458-5. [DOI] [PubMed] [Google Scholar]
- 72.Jin Y, Penning TM. Annu Rev Pharmacol Toxicol. 2007;47:263–292. doi: 10.1146/annurev.pharmtox.47.120505.105337. [DOI] [PubMed] [Google Scholar]
Associated Data
This section collects any data citations, data availability statements, or supplementary materials included in this article.