

Abstract
Epidemiological studies have identified a robust association between Type II Diabetes Mellitus (T2DM) and Alzheimer’s Disease (AD), and neurobiological studies have suggested the presence of central nervous system (CNS) insulin resistance in individuals with AD. Given this association, we hypothesized that the CNS-penetrant insulin-sensitizing medication metformin would be beneficial as a disease modifying and/or symptomatic therapy for AD, and conducted a placebo-controlled crossover study of its effects on cerebrospinal fluid (CSF), neuroimaging, and cognitive biomarkers. Twenty non-diabetic subjects with mild cognitive impairment or mild dementia due to AD were randomized to receive metformin then placebo for 8 weeks each or vice versa. CSF and neuroimaging (Arterial Spin Label MRI) data were collected for biomarker analyses, and cognitive testing was performed. Metformin was found to be safe, well-tolerated, and measureable in CSF at an average steady-state concentration of 95.6 ng/ml. Metformin was associated with improved executive functioning, and trends suggested improvement in learning/memory and attention. No significant changes in cerebral blood flow (CBF) were observed, though post-hoc completer analyses suggested an increase in orbitofrontal CBF with metformin exposure. Further study of these findings is warranted.
Introduction
Epidemiological studies have long noted an association between Type II Diabetes Mellitus (T2DM) and Alzheimer’s Disease (AD)1–3. While a history of T2DM increases risk for subsequent AD by 50–100%, peripheral insulin resistance (with normal blood glucose) itself is a risk factor for AD, as well as a common feature of the disease. Insulin resistance has been associated with reduced activation of cerebrocortical insulin receptors, impaired amyloid-β (Aβ) oligomer clearance, higher Aβ1-42 secretion, abnormal neuritic plaque load in the brain, and decreased cerebral glucose metabolism that correlates with decreased memory recall. Consequently, a number of investigators have argued that insulin resistance in AD, defined broadly as reduced cellular responsiveness to insulin, may occur not only in peripheral tissues but also in the brain, leading some to label AD with the moniker “Type III Diabetes”4. The relationship between T2DM and AD has prompted clinical trials with intranasal insulin5 and other anti-diabetes medicines, with benefit reported in some trials but not others6,7.
Craft and colleagues have produced a compelling line of research on insulin abnormalities in AD, uncovering insulin resistance in AD as well as a relationship to APOE status8,9, AD-like biomarker profiles in pre-diabetics10, and beneficial changes on memory and dementia severity rating scales, peripheral and central glucose metabolism, and FDG-PET activity using acute and chronic insulin treatment11–14. More recently, Morris et al. examined systemic insulin resistance in mild cognitive impairment (MCI) and AD subjects (as compared to normal controls) using an insulin clamp technique, and observed increased insulin resistance in cognitively impaired subjects15. Infusion of exogenous insulin, however, did not improve memory deficits in these subjects15. While these studies have provided evidence for a potential therapeutic benefit of increasing insulin activity in the brains of individuals with AD, our own findings of molecular “paralysis” of the IRS-1/Akt insulin signaling pathway in post-mortem brain tissue of individuals with AD have led us to propose that re-sensitizing this pathway, rather than overcoming it with insulin, may be a useful therapeutic strategy. This alternative approach also takes into consideration the fact that chronic insulin exposure among systemically insulin-resistant individuals or exogenous insulin administration itself might further worsen brain insulin resistance and actually promote AD pathology16.
Here we describe data from a 16-week, randomized, double-blinded, placebo-controlled crossover pilot study of the CNS effects of metformin in AD. Metformin is an insulin sensitizing medicine, the first-line treatment17 and most widely prescribed oral medication for Type II Diabetes Mellitus (T2DM) in the world. Its principal mechanism of action is thought to be activation of AMP-activated protein kinase (AMPK), which inactivates the mTOR/p70S6K-mediated negative feedback loop to insulin receptor substrate-1, thus enhancing insulin signaling18. In T2DM, AMPK activation improves hyperglycemia by increasing insulin sensitivity of peripheral tissues and inhibiting hepatic gluconeogenesis. Of particular interest, AMPK also regulates tau phosphorylation, Aβ production, and autophagy, all of which are critical processes in AD19. In contrast to other anti-diabetic medicines that have been of interest in AD (e.g. insulin secretagogues, starch digestion inhibitors, incretin-based therapies, and thiazolidinedione PPARɣ agonists), metformin has been shown to cross the blood-brain barrier, at least in rodent models20.
To date, there has been limited published research on the role of metformin in AD. One large epidemiological study in Taiwan reported that T2DM increased risk for dementia more than two-fold21. Furthermore, compared to untreated Type II diabetics, individuals treated with sulfonylureas experienced a reduction in hazard ratio (HR) from 1 to 0.85, while those treated with metformin had an even greater reduction, from 1 to 0.7621. The results of preclinical studies have been more varied. Metformin ameliorated insulin resistance and reduced AD-like changes of tau hyperphosphorylation and Aβ overproduction in a hyperinsulin-induced neuroblastoma cell line (N2A) model of AD16, and another study showed that metformin reduced tau phosphorylation in primary neuron cultures from a tau transgenic mouse22. On the other hand, another study in a neuronal cell line reported that metformin increased β-secretase activity and Aβ generation23.
We conducted a brief, deep-phenotyping trial in non-diabetic subjects with mild cognitive impairment and early dementia due to AD using high-dose metformin and multi-dimensional biomarker outcomes. Given preclinical findings, epidemiological observations, and metformin’s known mechanisms of action, we hypothesized that metformin would be measureable in cerebrospinal fluid (CSF), induce metabolic and physiological changes consonant with its actions in the periphery, and produce salutary effects on cognition as well as on CSF biomarkers of Alzheimer’s Disease.
Methods
Overview
This pilot study used a randomized, double-blinded, placebo-controlled crossover design to examine the effects of metformin on biochemical, neurophysiological, and cognitive biomarkers of AD. All subjects provided informed consent in a study approved by the Human Subjects Institutional Review Board at the University of Pennsylvania. Subjects were randomized 1:1 to receive metformin (2000 mg/d) for 8 weeks followed by placebo for 8 weeks or vice versa (Figure 1). The dosage titration and administration schedule was as follows: metformin 500 mg (or placebo) by mouth daily for 1 week, then daily dose (in divided doses) increased by 500 mg per week until a maximum of 2000 mg/d (1000 mg twice daily) was reached. If patients experienced poor tolerance (esp. GI side effects), titration to maximum tolerated dose was allowed. All assessments and procedures were performed at the Hospital of the University of Pennsylvania or its outpatient clinical facilities. This trial was registered at ClinicalTrials.gov, NCT01965756.
Figure 1.
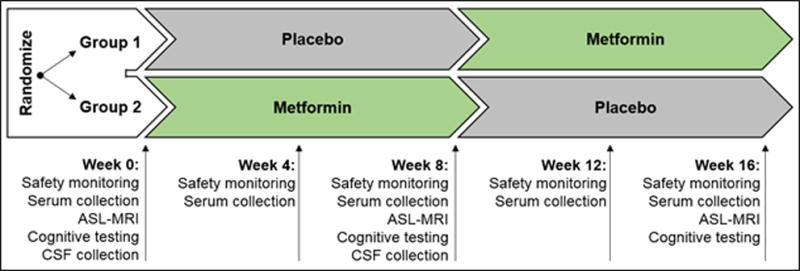
Trial design with study time points.
Blinding and Randomization
Study medication and matching placebo were prepared, with the blind maintained, by the University of Pennsylvania Health System (UPHS) research pharmacy. The research pharmacy purchased commercially available metformin 500mg tablets and manufactured a blinded opaque capsule containing 500mg of metformin per capsule. A matching blinded opaque placebo capsule, identical in appearance to the active capsule but containing only inert ingredients, was also prepared. Subjects were randomized to each study group using a simple computer-generated randomization table. Subjects were assigned sequentially to receive either active medication first or placebo first. Apart from research pharmacy staff, all investigators remained blinded to the intervention until study completion.
Subjects
Eligibility criteria included: age 55–80 at screening, no known history of diabetes or pre-diabetes, diagnosis of MCI or early dementia due to Alzheimer’s Disease (CDR-Global ≤ 1.0), screening Mini-Mental State Examination > 19, at least one positive biomarker consistent with AD (e.g. CSF analysis, FDG-PET, amyloid scan), baseline Geriatric Depression Scale total < 6 (to exclude subjects with concomitant depressive symptomatology), modified Hachinski Ischemic Score < 4 (to exclude subjects with potential vascular etiology to their cognitive complaints), and fasting blood glucose <110 or HgbA1c < 6.0 (to exclude subjects with diabetes or pre-diabetes). Individuals on an acetylcholinesterase inhibitor were required to be on a stable dose for at least 2 months by the baseline study visit. Exclusionary criteria were as follows: any CNS disease other than suspected incipient AD, history of diabetes or pancreatic, liver, or renal disease, history of substance abuse or dependence within the past two years, contraindication to participation in MRI (e.g. pacemaker) or lumbar puncture (e.g. anti-coagulant therapy), and current use of certain medications with known deleterious effects on cognition (e.g. highly anticholinergic medications, antihistamines, antipsychotics, sedatives/hypnotics, anxiolytics). A modified Hachinski Ischemic Scale (MHIS)24 was completed at screening, based on medical history (focusing on the onset and clinical presentation of cognitive symptoms, as well as cerebrovascular risk factors and clinical features) and neurological examination of the subject. The MHIS was used to differentiate dementia of the Alzheimer type from vascular dementia. The Clinical Dementia Rating (CDR) scale25 was performed at screening and week 0 to measure degree of functional impairment, including ratings on degrees of impairment in memory, orientation, judgment and problem solving, community affairs, home and hobbies, and personal care.
Measures and Assays
Cerebrospinal Fluid (CSF)
Each subject underwent 8:00 am lumbar puncture for CSF collection at week 0 (baseline) and week 8, allowing parallel-design comparison of groups treated with metformin and placebo during the first phase of the study. Repeat lumbar puncture at week 16 was not included in study design for tolerability considerations. CSF samples were collected in polypropylene tubes and immediately aliquoted, frozen, and stored at −80°C for batch-run analyses. Innogenetics Innotest ELISAs were used for measurement of amyloid-β1-42, total tau, and phosphorylated tau per manufacturer instructions26,27.
Pseudocontinuous Arterial Spin Label (ASL) MRI
Resting pseudocontinuous ASL-MRI28 was performed at weeks 0, 8, and 16 to measure regional cerebral perfusion using a 3T whole-body Siemens TIM Trio scanner during a scanning protocol that included MP-RAGE and FLAIR. Previously described methods were used for data acquisition and data processing29. Analyses focused on detecting changes in CBF in a priori specified regions of the temporal, parietal, and frontal cortices, as defined in the Automated Anatomical Labeling (AAL) atlas30.
Cognitive and Functional Measures
Cognitive and functional testing was performed at weeks 0, 8, and 16. Cognitive testing included paper-and-pencil (Cognitive Subscale of the Alzheimer’s Disease Assessment Scale [ADAS-Cog]31) as well as computerized (Cambridge Neuropsychological Test Automated Battery [CANTAB]32) assessments. Cognitive domains of interest included learning and memory (immediate learning and delayed recall of word list from the ADAS-Cog [WL], percent correct on CANTAB Delayed Matching to Sample [DMS all delays], total errors on CANTAB Paired Associates Learning [PAL]), executive functioning (Trails-B [TMT-B] time, score on backwards Digit Span [DS]), attention (score on forward DS, percent correct on simultaneous DMS), language (Boston Naming Test total), and motor speed (CANTAB Reaction Time [RTI], TMT-A time). The Geriatric Depression Scale (GDS) was administered at weeks 0, 8, and 16 to screen for concomitant depressive symptoms that could affect cognition or trial participation33. The Dementia Severity Rating Scale (DSRS) was administered at weeks 0, 8, and 16 to assess changes in everyday functioning associated with exposure to metformin and placebo34.
Statistical Analysis
Descriptive statistics (mean and standard deviation or percentage and N) were used to characterize and compare the two treatment arms. Distributions were examined prior to all analyses. Linear mixed-effects models35 were used for comparing baseline scores at the end of each study phase between the two treatments, adjusted for study phase (phase 1 or 2) and treatment sequence (placebo followed by metformin, or metformin followed by placebo). Fixed effects in the linear mixed-effects model included treatment, phase, and sequence. Subject-specific random intercepts were used to account for the correlation between repeated measures. When applicable, differences across groups were tested using Fisher’s Exact Test or Wilcoxon Rank-sum, with Wilcoxon Signed-rank Test used for pairwise comparisons. Outcomes in this study were exploratory, so multiple comparison corrections were not applied36. P value less than 0.05 was considered significant, and P value less than 0.10 was considered a trend. All statistical tests were two-sided. Statistical analyses were conduct using Stata SE version 13.1 (StataCorp LP, College Station, Texas) and SAS version 9.2 (SAS Institute Inc., Cary, North Carolina). Based on our power calculations for anticipated effects on the ADAS-Cog, we planned to recruit a total of 30 subjects (though recruitment goals were not met due to budgetary constraints). Allowing for a 15% dropout rate and using a two-sided paired t-test with alpha=0.05 and power=0.80, we calculated that we would be able to detect at least 0.6 standard deviations (SD) of the difference in ADAS-cog between groups.
Results
Baseline clinical characteristics
Twenty subjects meeting eligibility criteria were enrolled, and all completed the 16-week pilot study between January 2013 and May 2015. There were 9 women and 11 men, all Caucasian (1 Hispanic), with a mean age of 70.1 years (SD=6.89) and education of 16.7 years (SD=2.77). At baseline, mean MMSE was 25.9 (SD=2.26), mean CDR was 0.66 (SD=0.58), mean GDS was 1.20 (SD=1.15), and mean MHIS was 0.32 (SD=0.48). Baseline demographic measures did not differ significantly between treatment sequence groups at baseline (Group 1: placebo followed by metformin, Group 2: metformin followed by placebo) (Table 1). Clinical diabetes measures, including plasma glucose and HbA1c, were within normal limits and did not differ significantly at baseline between groups.
Table 1.
Baseline Demographic and Clinical Measures
| Overall (N=20) | Group 1 (n=10) | Group 2 (n=10) | Tests of Difference | ||
|---|---|---|---|---|---|
| μ (σ) or % (n) | μ (σ) or % (n) | μ (σ) or % (n) | Z score | P Value | |
| Demographic Measures | |||||
| Age | 70.1 (6.89) | 71.1 (6.57) | 69.1 (7.40) | z=0.378 | 0.7055 |
| Race (Caucasian) | 100% (20) | 100% (10) | 100% (10) | Fisher’s exact | 1.000 |
| Gender (Female) | 45.0% (9) | 40.0% (4) | 50.0% (5) | Fisher’s exact | 1.000 |
| Education (years) | 16.7 (2.77) | 16.4 (3.87) | 17 (1.05) | z=0.392 | 0.6948 |
| MMSE (Total) | 25.88 (2.26) | 26.9 (1.46) | 25 (2.55) | z=1.608 | 0.1079 |
| CDR-Global | 0.658 (.579) | 0.8 (0.789) | 0.5 (0) | z=1.378 | 0.1681 |
| Hachinski | 0.316 (.478) | 0.33 (0.5) | 0.3 (0.483) | z=0.152 | 0.8793 |
| Clinical and Safety Measures | |||||
| MoCA Total | 20.2 (1.30) | 19.5 (0.707) | 20.7 (1.53) | z=1.423 | 0.1548 |
| GDS (Total) | 1.20 (1.15) | 1.0 (0.816) | 1.4 (1.43) | z=−0.403 | 0.6870 |
| FRS (Total) | 9.10 (4.29) | 9.4 (4.70) | 8.8 (4.05) | z=0.205 | 0.8377 |
| HbA1c | 5.44 (0.232) | 5.37 (0.236) | 5.5 (0.221) | z=−1.376 | 0.1689 |
| Plasma Glucose | 90.7 (11.4) | 90.9 (14.1) | 90.5 (8.77) | z=0.076 | 0.9396 |
| Plasma Lactate | 0.9 (0.235) | 0.856 (0.201) | 0.944 (0.270) | z=−0.722 | 0.4701 |
| Plasma Insulin | 7.73 (8.31) | 5.99 (3.67) | 9.46 (11.2) | z=−0.530 | 0.5964 |
| BMI | 25.3 (4.19) | 24.3 (3.57) | 26.3(4.70) | z=−0.756 | 0.4497 |
| HOMA-IR | 1.83 (1.93) | 1.40 (0.944) | 2.27 (2.57) | z=−1.172 | 0.2411 |
Safety
The most common side-effects of metformin include gastrointestinal-related symptoms (e.g. anorexia, nausea, diarrhea), lactic acidosis, and hypoglycemia. Treatment with metformin, but not placebo, was associated with a decrease in BMI (p<0.05) and an increase in plasma lactate levels (p<0.05) over time (Table 2). BMI remained within “healthy” range or above (>18.5) for all subjects except two: one subject was slightly underweight at the start of the study (BMI=17.7), with BMI that decreased to 17.1 while on metformin. A second subject began the study in healthy range (19.4) and became slightly underweight (17.98) while on metformin. Plasma lactate levels remained within normal range for all subjects except two, including a 74-year-old male who experienced an elevation in lactate from 1.1 mmol/L to 2.6 mmol/L that corrected to 1.0 mmol/L upon switching to placebo (normal range: 0.5–1.5 mmol/L) and a 68-year-old female who experienced an elevation in lactate from 0.8 mmol/L to 2.0 mmol/L with metformin, which corrected to 0.7 mmol/L after metformin was discontinued at the end of the study. Neither subject presented initially with any contraindications to metformin use, including hepatic or renal dysfunction, heart failure, or history of alcohol abuse. Treatment with metformin or placebo was not associated with changes in plasma insulin or glucose levels over the course of the study, nor were changes in depressive symptoms or functional status observed. No serious adverse events were reported during the trial.
Table 2.
Change in Clinical and Safety Measures Over Time
| Coefficient | df | F Value | P Value | |
|---|---|---|---|---|
| MoCA Total | ||||
| Intercept | −3.5512 | — | — | — |
| Sequence | 0.4238 | 1,17 | 0.25 | 0.6249 |
| Phase | 0.2740 | 1,17 | 0.14 | 0.7082 |
| Drug | −0.02209 | 1,17 | 0.00 | 0.9759 |
| GDS (Total) | ||||
| Intercept | −3.3653 | — | — | — |
| Sequence | 0.09099 | 1,17 | 0.03 | 0.8638 |
| Phase | −0.1512 | 1,17 | 0.18 | 0.6778 |
| Drug | 0.01959 | 1,17 | 0.00 | 0.9580 |
| DSRS (Total) | ||||
| Intercept | 0.8501 | — | — | — |
| Sequence | 0.2240 | 1,16 | 0.08 | 0.7820 |
| Phase | −1.1462 | 1,16 | 2.46 | 0.1364 |
| Drug | −0.3780 | 1,16 | 0.26 | 0.6153 |
| Plasma Glucose | ||||
| Intercept | 39.6331 | — | — | — |
| Sequence | 1.8683 | 1,17 | 0.31 | 0.5877 |
| Phase | −0.1037 | 1,17 | 0.00 | 0.9733 |
| Drug | −2.1645 | 1,17 | 0.51 | 0.4852 |
| Plasma Insulin | ||||
| Intercept | −1.0065 | — | — | — |
| Sequence | 0.9853 | 1,4 | 2.51 | 0.1886 |
| Phase | 0.4067 | 1,4 | 0.43 | 0.5473 |
| Drug | −0.7626 | 1,4 | 1.34 | 0.3119 |
| BMI | ||||
| Intercept | −0.4425 | — | — | — |
| Sequence | −0.05314 | 1,15 | 0.08 | 0.7795 |
| Phase | 0.1058 | 1,15 | 0.57 | 0.4619 |
| Drug | −0.3737 | 1,15 | 5.27 | 0.0365 |
| Plasma Lactate | ||||
| Intercept | −0.1533 | — | — | — |
| Sequence | 0.02860 | 1,40 | 0.26 | 0.6124 |
| Phase | — | 2,40 | 2.46 | 0.0986 |
| Drug | 0.1253 | 1,40 | 4.16 | 0.0481 |
Cerebrospinal Fluid (CSF) Analyses
All subjects completed baseline CSF collection. Nine of ten subjects in Group 1 agreed to repeat CSF collection at week 8, while 8 of 10 subjects in Group 2 agreed to repeat collection. Metformin levels were measured at week 8 for Group 2 subjects. Mean fasting levels were 951.9 ng/mL (SD=828.0) in plasma and 95.6 ng/mL (SD=71.0) in CSF. Pairwise analyses revealed no significant change within individuals in CSF glucose or protein levels, or in CSF Aβ42, total tau, or phosphorylated tau levels across groups (Supplemental Table 1).
Functional Neuroimaging
Resting-state ASL-MRI was collected at three time points, including week 0 (baseline), week 8, and week 16. No statistically-significant treatment effects were observed in any of the pre-defined regions of interest using an intent-to-treat sample, including anterior cingulate (p=0.83), fusiform gyrus (p=0.84), hippocampus (p=0.44), inferior frontal gyri (opercular: p=1.00, triangular: p=0.99), middle frontal gyrus (p=0.86), orbitofrontal gyri (middle: p=0.65, superior: p=0.52, inferior: p=0.95, medial: 0.98), parahippocampal gyrus (p=0.12), posterior cingulate (p=0.31), precuneus (p=0.84), rolandic operculum (p=0.99), or superior frontal gyri (dorsolateral: p=0.83, medial: p=0.66) (Supplemental Table 2). However, pooled post-hoc analyses consisting of those subjects who successfully completed ASL-MRI scans before and after metformin exposure (n=17) and before and after placebo exposure (n=18) demonstrated a significant increase in superior (p<0.05) and middle orbitofrontal (p<0.05) CBF over 8 weeks of treatment with metformin but not placebo (Figure 2, Supplemental Table 3).
Figure 2.
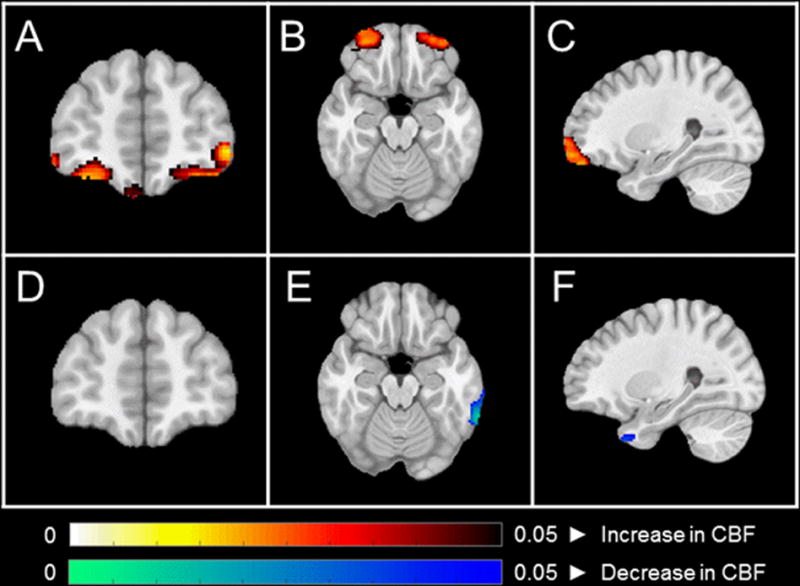
A–C: Coronal, axial, and sagittal views demonstrating increases in orbitofrontal CBF before and after metformin exposure (n=17). D–F: Coronal, axial, and sagittal views demonstrating no change in orbitofrontal CBF before and after placebo exposure (n=18). All statistical maps were generated using a whole brain voxel-wise modeling analysis, and enhanced by threshold free cluster enhancement (Smith & Nichols 2009). No correction for multiple comparisons was performed due to the exploratory nature of this study. Regions with uncorrected p < 0.05 are shown.
Cognition
A statistically-significant treatment effect favoring metformin was observed on one measure of executive functioning (Trails-B: p<0.05), and statistical trends favoring metformin were observed on a measure of learning and memory (PAL Total Errors: p=0.06) and a measure of attention (DMS Percent Correct Simultaneous: p=0.07). No statistically-significant treatment effects were observed on measures of language or motor speed (Table 3).
Table 3.
Change in Cognitive Measures Over Time
| Measure | Regression Coefficient | df | F Value | P Value | |
|---|---|---|---|---|---|
| Learning and Memory | Word List Learning (Total) | ||||
| Intercept | −2.7232 | — | — | — | |
| Sequence | −0.01681 | 1,15 | 0.00 | 0.9806 | |
| Phase | −0.7847 | 1,15 | 1.31 | 0.2710 | |
| Drug | 0.3093 | 1,15 | 0.20 | 0.6625 | |
| Word List Recall (Total) | |||||
| Intercept | 0.5543 | — | — | — | |
| Sequence | −0.3031 | 1,14 | 1.47 | 0.2456 | |
| Phase | −0.2936 | 1,14 | 1.94 | 0.1859 | |
| Drug | 0.2294 | 1,14 | 1.16 | 0.2995 | |
| Delayed Matching to Sample (Percent Correct, All Delays) | |||||
| Intercept | −4.3473 | — | — | — | |
| Sequence | −1.9771 | 1,17 | 0.20 | 0.6642 | |
| Phase | 6.0047 | 1,17 | 3.32 | 0.0861 | |
| Drug | 2.4013 | 1,17 | 0.54 | 0.4710 | |
| Paired Associates Learning (Total Errors) | |||||
| Intercept | −8.8327 | — | — | — | |
| Sequence | 3.2320 | 1,17 | 3.53 | 0.0774 | |
| Phase | 0.8107 | 1,17 | 0.19 | 0.6644 | |
| Drug | −3.1105 | 1,17 | 3.95 | 0.0633 | |
| Executive Functioning | Trail Making Test Part B (Time) | ||||
| Intercept | −19.8817 | — | — | — | |
| Sequence | 16.7682 | 1,13 | 1.71 | 0.2143 | |
| Phase | −0.4488 | 1,13 | 0.00 | 0.9543 | |
| Drug | −18.2646 | 1,13 | 5.64 | 0.0337 | |
| Digit Span Backwards (Total) | |||||
| Intercept | 1.0954 | — | — | — | |
| Sequence | −0.4300 | 1,14 | 0.87 | 0.3674 | |
| Phase | 0.1172 | 1,14 | 0.09 | 0.7631 | |
| Drug | 0.4493 | 1,14 | 1.44 | 0.2508 | |
| Attention | Digit Span Forward (Total) | ||||
| Intercept | 3.1843 | — | — | — | |
| Sequence | −0.3328 | 1,14 | 0.66 | 0.4311 | |
| Phase | −0.2489 | 1,14 | 0.97 | 0.3412 | |
| Drug | 0.3789 | 1,14 | 2.35 | 0.1476 | |
| Delayed Matching to Sample (Percent Correct, Simultaneous) | |||||
| Intercept | 23.8791 | — | — | — | |
| Sequence | −7.7456 | 1,17 | 3.72 | 0.0708 | |
| Phase | 6.0950 | 1,17 | 2.26 | 0.1513 | |
| Drug | 7.9050 | 1,17 | 3.80 | 0.0680 | |
| Language | Bosting Naming Test (Total) | ||||
| Intercept | 5.2468 | — | — | — | |
| Sequence | −0.6352 | 1,13 | 1.37 | 0.2624 | |
| Phase | −0.2790 | 1,13 | 0.27 | 0.6118 | |
| Drug | 0.2519 | 1,13 | 0.21 | 0.6541 | |
| Motor | Reaction Time (RTI) | ||||
| Intercept | 125.52 | — | — | — | |
| Sequence | −9.4745 | 1,13 | 0.36 | 0.5615 | |
| Phase | −8.2049 | 1,13 | 0.26 | 0.6177 | |
| Drug | −15.5495 | 1,13 | 0.91 | 0.3581 | |
| Trail Making Test Part A (Time) | |||||
| Intercept | −4.8013 | — | — | — | |
| Sequence | −1.9824 | 1,14 | 0.45 | 0.5136 | |
| Phase | −1.9824 | 1,14 | 0.64 | 0.4368 | |
| Drug | 3.6125 | 1,14 | 2.09 | 0.1699 | |
Discussion
This brief randomized crossover pilot trial employed a multidimensional biomarker panel to explore the effects of metformin in MCI and early dementia due to AD. Plasma, CSF, neuroimaging, and cognitive data were collected using an efficient trial design that permitted comparisons across and within subjects. The goals of the trial were threefold: (1) demonstrate that a “nimble” phenotyping trial design could be implemented in a clinical population with early AD; (2) determine whether metformin was safe, tolerated, and biologically-active in the CNS of individuals with AD; and (3) explore whether metformin exerted salutary effects on AD cognitive and biological markers.
We demonstrated that metformin penetrates the blood-brain barrier (as evidenced by measurable CSF levels), though did not exert a measurable effect on CSF AD biomarkers over the course of the 8-week exposure. Interestingly, we found evidence of improved executive functioning during treatment with metformin but not placebo, and trends suggested improved learning, memory, and attentional abilities during metformin treatment as well. These positive findings, despite the limited sample size and relatively short length of the trial, are promising and warrant further exploration. Furthermore, post-hoc ASL-MRI completer analyses—demonstrating increases in orbitofrontal metabolism with metformin but not placebo—suggest a potential mechanism of action related to effects on frontal-executive pathways. The orbitofrontal cortex is a key prefrontal region involved in information encoding37, and decreases in regional metabolism have been observed in individuals with AD38. It is important to note, however, that the observed changes on ASL-MRI occurred in ventral brain regions that are potentially sensitive to motion and co-registration artifacts, and thus require replication. Accordingly, further study of the effects of metformin on more comprehensive measures of frontal-executive functioning and frontal regional cerebral metabolism may help to elucidate the mechanism and clinical relevance of these findings.
It is important to acknowledge several limitations of this exploratory study. First, the crossover design of the trial did not include a washout period, such that some of the effects measured after the crossover point in the trial may have been the result of lingering effects of metformin in individuals who were randomized to Group 2 (metformin then placebo treatment sequence). In addition, we collected CSF at baseline and week 8 and would have liked to collect CSF at the end of the overall trial (week 16). Doing so would have allowed a longitudinal assessment of CSF analytes and AD biomarkers using mixed-effects models, but we chose to exclude a third LP from the original trial design given concern for participant tolerability. Lastly, we encountered technical challenges during ASL-MRI data acquisition. While most subjects underwent MRI acquisition at all planned time points, data from a relatively large number of scans (>30%) had to be rejected due to the presence of ASL imaging artifacts. These artifacts are caused by insufficient labeling, subject motion, MRI distortion, and the intrinsically low signal-to-noise ratio of pseudocontinuous ASL-MRI. Artifacts are also more severe in AD subjects due to reduced CBF (lower signal) in this population. Given the amount and random distribution of this missing data, we undertook post-hoc completer-only analyses in addition to intent-to-treat analyses. We must, however, acknowledge the limitations of conclusions drawn from these exploratory findings. In addition, it is important to acknowledge the possibility that the study may have been under-powered, given the combination of small sample size and missing data (especially for the MRI analyses).
The deep phenotyping trial design used in this study may serve as a template for future early-stage translational research of potential therapeutics for AD. Standard phase II safety and efficacy trials of disease-modifying interventions for AD are traditionally lengthy, large, and expensive, especially for MCI and early AD when rates of clinical progression are variable and frequently slow39,40. Given this, there is an urgent need for the field to establish and embrace more efficient early-phase clinical study designs that provide evidence of target engagement and therapeutic efficacy, typically through the measurement of surrogate biomarkers. Over the last decade, a number of sensitive cognitive, neurophysiologic, and biochemical biomarkers have emerged that may help to accelerate the pace of discovery, screening, and development of AD preventions and interventions. We hope to see additional clinical studies that utilize this approach, particularly with a focus on repurposing existing drugs with AD-relevant mechanisms that are already available for treating other conditions and known to be safe and well-tolerated in humans. These hypothesis-driven trials must demonstrate that agents engage a CNS target relevant to AD, alter a biomarker that can be used to track functionality, and ideally demonstrate an effect on cognition and functioning.
Supplementary Material
Acknowledgments
Support:
Funded by the BrightFocus Foundation, a gift from the Allen H. and Selma W. Berkman Charitable Trust, the National Institute on Aging (AG10124), and the National Institute of Mental Health (T32 MH1711929).
Footnotes
Trial Registration:
Off-Label Use:
Metformin is not approved by the FDA for the use/purposes discussed in this manuscript.
References
- 1.Profenno LA, Porsteinsson AP, Faraone SV. Meta-analysis of Alzheimer’s disease risk with obesity, diabetes, and related disorders. Biological psychiatry. 2010;67(6):505–512. doi: 10.1016/j.biopsych.2009.02.013. [DOI] [PubMed] [Google Scholar]
- 2.Baker LD, Cross DJ, Minoshima S, Belongia D, Watson GS, Craft S. Insulin resistance and Alzheimer-like reductions in regional cerebral glucose metabolism for cognitively normal adults with prediabetes or early type 2 diabetes. Archives of neurology. 2011;68(1):51–57. doi: 10.1001/archneurol.2010.225. [DOI] [PMC free article] [PubMed] [Google Scholar]
- 3.Correia SC, Santos RX, Perry G, Zhu X, Moreira PI, Smith MA. Insulin-resistant brain state: the culprit in sporadic Alzheimer’s disease? Ageing research reviews. 2011;10(2):264–273. doi: 10.1016/j.arr.2011.01.001. [DOI] [PMC free article] [PubMed] [Google Scholar]
- 4.Steen E, Terry BM, Rivera EJ, et al. Impaired insulin and insulin-like growth factor expression and signaling mechanisms in Alzheimer’s disease–is this type 3 diabetes? Journal of Alzheimer’s disease: JAD. 2005;7(1):63–80. doi: 10.3233/jad-2005-7107. [DOI] [PubMed] [Google Scholar]
- 5.Craft S, Baker LD, Montine TJ, et al. Intranasal insulin therapy for Alzheimer disease and amnestic mild cognitive impairment: a pilot clinical trial. Archives of neurology. 2012;69(1):29–38. doi: 10.1001/archneurol.2011.233. [DOI] [PMC free article] [PubMed] [Google Scholar]
- 6.Harrington C, Sawchak S, Chiang C, et al. Rosiglitazone does not improve cognition or global function when used as adjunctive therapy to AChE inhibitors in mild-to-moderate Alzheimer’s disease: two phase 3 studies. Current Alzheimer research. 2011;8(5):592–606. doi: 10.2174/156720511796391935. [DOI] [PubMed] [Google Scholar]
- 7.Gold M, Alderton C, Zvartau-Hind M, et al. Rosiglitazone monotherapy in mild-to-moderate Alzheimer’s disease: results from a randomized, double-blind, placebo-controlled phase III study. Dementia and geriatric cognitive disorders. 2010;30(2):131–146. doi: 10.1159/000318845. [DOI] [PMC free article] [PubMed] [Google Scholar]
- 8.Cook DG, Leverenz JB, McMillan PJ, et al. Reduced hippocampal insulin-degrading enzyme in late-onset Alzheimer’s disease is associated with the apolipoprotein E-epsilon4 allele. Am J Pathol. 2003;162(1):313–319. doi: 10.1016/s0002-9440(10)63822-9. [DOI] [PMC free article] [PubMed] [Google Scholar]
- 9.Craft S. Insulin resistance syndrome and Alzheimer’s disease: age- and obesity-related effects on memory, amyloid, and inflammation. Neurobiol Aging. 2005;26(Suppl 1):65–69. doi: 10.1016/j.neurobiolaging.2005.08.021. [DOI] [PubMed] [Google Scholar]
- 10.Baker LD, Cross DJ, Minoshima S, Belongia D, Watson GS, Craft S. Insulin resistance and Alzheimer-like reductions in regional cerebral glucose metabolism for cognitively normal adults with prediabetes or early type 2 diabetes. Arch Neurol. 2010;68(1):51–57. doi: 10.1001/archneurol.2010.225. [DOI] [PMC free article] [PubMed] [Google Scholar]
- 11.Craft S, Asthana S, Cook DG, et al. Insulin dose-response effects on memory and plasma amyloid precursor protein in Alzheimer’s disease: interactions with apolipoprotein E genotype. Psychoneuroendocrinology. 2003;28(6):809–822. doi: 10.1016/s0306-4530(02)00087-2. [DOI] [PubMed] [Google Scholar]
- 12.Watson GS, Bernhardt T, Reger MA, et al. Insulin effects on CSF norepinephrine and cognition in Alzheimer’s disease. Neurobiology of aging. 2006;27(1):38–41. doi: 10.1016/j.neurobiolaging.2004.11.011. [DOI] [PubMed] [Google Scholar]
- 13.Dhamoon MS, Noble JM, Craft S. Intranasal insulin improves cognition and modulates beta-amyloid in early AD. Neurology. 2009;72(3):292–293. doi: 10.1212/01.wnl.0000344246.91081.2c. author reply 293–294. [DOI] [PubMed] [Google Scholar]
- 14.Craft S, Baker LD, Montine TJ, et al. Intranasal Insulin Therapy for Alzheimer Disease and Amnestic Mild Cognitive Impairment: A Pilot Clinical Trial. Arch Neurol. 2011 doi: 10.1001/archneurol.2011.233. [DOI] [PMC free article] [PubMed] [Google Scholar]
- 15.Morris JK, Vidoni ED, Mahnken JD, et al. Cognitively impaired elderly exhibit insulin resistance and no memory improvement with infused insulin. Neurobiology of aging. 2016;39:19–24. doi: 10.1016/j.neurobiolaging.2015.11.005. [DOI] [PMC free article] [PubMed] [Google Scholar]
- 16.Gupta A, Bisht B, Dey CS. Peripheral insulin-sensitizer drug metformin ameliorates neuronal insulin resistance and Alzheimer’s-like changes. Neuropharmacology. 2011;60(6):910–920. doi: 10.1016/j.neuropharm.2011.01.033. [DOI] [PubMed] [Google Scholar]
- 17.Berkowitz SA, Krumme AA, Avorn J, et al. Initial choice of oral glucose-lowering medication for diabetes mellitus: a patient-centered comparative effectiveness study. JAMA internal medicine. 2014;174(12):1955–1962. doi: 10.1001/jamainternmed.2014.5294. [DOI] [PubMed] [Google Scholar]
- 18.Boura-Halfon S, Zick Y. Phosphorylation of IRS proteins, insulin action, and insulin resistance. Am J Physiol Endocrinol Metab. 2009;296(4):E581–591. doi: 10.1152/ajpendo.90437.2008. [DOI] [PubMed] [Google Scholar]
- 19.Salminen A, Kaarniranta K, Haapasalo A, Soininen H, Hiltunen M. AMP-activated protein kinase: a potential player in Alzheimer’s disease. J Neurochem. 2011;118(4):460–474. doi: 10.1111/j.1471-4159.2011.07331.x. [DOI] [PubMed] [Google Scholar]
- 20.Labuzek K, Suchy D, Gabryel B, Bielecka A, Liber S, Okopien B. Quantification of metformin by the HPLC method in brain regions, cerebrospinal fluid and plasma of rats treated with lipopolysaccharide. Pharmacol Rep. 2010;62(5):956–965. doi: 10.1016/s1734-1140(10)70357-1. [DOI] [PubMed] [Google Scholar]
- 21.Hsu CC, Wahlqvist ML, Lee MS, Tsai HN. Incidence of dementia is increased in type 2 diabetes and reduced by the use of sulfonylureas and metformin. J Alzheimers Dis. 2011;24(3):485–493. doi: 10.3233/JAD-2011-101524. [DOI] [PubMed] [Google Scholar]
- 22.Kickstein E, Krauss S, Thornhill P, et al. Biguanide metformin acts on tau phosphorylation via mTOR/protein phosphatase 2A (PP2A) signaling. Proc Natl Acad Sci U S A. 2010;107(50):21830–21835. doi: 10.1073/pnas.0912793107. [DOI] [PMC free article] [PubMed] [Google Scholar]
- 23.Chen Y, Zhou K, Wang R, et al. Antidiabetic drug metformin (GlucophageR) increases biogenesis of Alzheimer’s amyloid peptides via up-regulating BACE1 transcription. Proc Natl Acad Sci U S A. 2009;106(10):3907–3912. doi: 10.1073/pnas.0807991106. [DOI] [PMC free article] [PubMed] [Google Scholar]
- 24.Moroney JT, Bagiella E, Desmond DW, et al. Meta-analysis of the Hachinski Ischemic Score in pathologically verified dementias. Neurology. 1997;49(4):1096–1105. doi: 10.1212/wnl.49.4.1096. [DOI] [PubMed] [Google Scholar]
- 25.Morris JC. Clinical dementia rating: a reliable and valid diagnostic and staging measure for dementia of the Alzheimer type. International psychogeriatrics/IPA. 1997;9(Suppl 1):173–176. doi: 10.1017/s1041610297004870. discussion 177–178. [DOI] [PubMed] [Google Scholar]
- 26.Engelborghs S, De Vreese K, Van de Casteele T, et al. Diagnostic performance of a CSF-biomarker panel in autopsy-confirmed dementia. Neurobiology of aging. 2008;29(8):1143–1159. doi: 10.1016/j.neurobiolaging.2007.02.016. [DOI] [PubMed] [Google Scholar]
- 27.Shaw LM, Vanderstichele H, Knapik-Czajka M, et al. Cerebrospinal fluid biomarker signature in Alzheimer’s disease neuroimaging initiative subjects. Annals of neurology. 2009;65(4):403–413. doi: 10.1002/ana.21610. [DOI] [PMC free article] [PubMed] [Google Scholar]
- 28.Chen Y, Wang DJ, Detre JA. Test-retest reliability of arterial spin labeling with common labeling strategies. J Magn Reson Imaging. 2011;33(4):940–949. doi: 10.1002/jmri.22345. [DOI] [PMC free article] [PubMed] [Google Scholar]
- 29.Xie L, Dolui S, Das SR, et al. A brain stress test: Cerebral perfusion during memory encoding in mild cognitive impairment. Neuroimage Clin. 2016;11:388–397. doi: 10.1016/j.nicl.2016.03.002. [DOI] [PMC free article] [PubMed] [Google Scholar]
- 30.Tzourio-Mazoyer N, Landeau B, Papathanassiou D, et al. Automated anatomical labeling of activations in SPM using a macroscopic anatomical parcellation of the MNI MRI single-subject brain. NeuroImage. 2002;15(1):273–289. doi: 10.1006/nimg.2001.0978. [DOI] [PubMed] [Google Scholar]
- 31.Rosen WG, Mohs RC, Davis KL. A new rating scale for Alzheimer’s disease. Am J Psychiatry. 1984;141(11):1356–1364. doi: 10.1176/ajp.141.11.1356. [DOI] [PubMed] [Google Scholar]
- 32.Egerhazi A, Berecz R, Bartok E, Degrell I. Automated Neuropsychological Test Battery (CANTAB) in mild cognitive impairment and in Alzheimer’s disease. Progress in neuro-psychopharmacology & biological psychiatry. 2007;31(3):746–751. doi: 10.1016/j.pnpbp.2007.01.011. [DOI] [PubMed] [Google Scholar]
- 33.Yesavage JA, Brink TL, Rose TL, et al. Development and validation of a geriatric depression screening scale: a preliminary report. Journal of psychiatric research. 1982;17(1):37–49. doi: 10.1016/0022-3956(82)90033-4. [DOI] [PubMed] [Google Scholar]
- 34.Clark CM, Ewbank DC. Performance of the dementia severity rating scale: a caregiver questionnaire for rating severity in Alzheimer disease. Alzheimer disease and associated disorders. 1996;10(1):31–39. [PubMed] [Google Scholar]
- 35.Laird NM, Ware JH. Random-effects models for longitudinal data. Biometrics. 1982;38(4):963–974. [PubMed] [Google Scholar]
- 36.Bender R, Lange S. Adjusting for multiple testing–when and how? J Clin Epidemiol. 2001;54(4):343–349. doi: 10.1016/s0895-4356(00)00314-0. [DOI] [PubMed] [Google Scholar]
- 37.Frey S, Petrides M. Orbitofrontal cortex: A key prefrontal region for encoding information. Proceedings of the National Academy of Sciences of the United States of America. 2000;97(15):8723–8727. doi: 10.1073/pnas.140543497. [DOI] [PMC free article] [PubMed] [Google Scholar]
- 38.Dai W, Lopez OL, Carmichael OT, Becker JT, Kuller LH, Gach HM. Mild cognitive impairment and alzheimer disease: patterns of altered cerebral blood flow at MR imaging. Radiology. 2009;250(3):856–866. doi: 10.1148/radiol.2503080751. [DOI] [PMC free article] [PubMed] [Google Scholar]
- 39.Greenberg BD, Carrillo MC, Ryan JM, et al. Improving Alzheimer’s disease phase II clinical trials. Alzheimer’s & dementia: the journal of the Alzheimer’s Association. 2013;9(1):39–49. doi: 10.1016/j.jalz.2012.02.002. [DOI] [PubMed] [Google Scholar]
- 40.Cummings JL, Morstorf T, Zhong K. Alzheimer’s disease drug-development pipeline: few candidates, frequent failures. Alzheimer’s research & therapy. 2014;6(4):37. doi: 10.1186/alzrt269. [DOI] [PMC free article] [PubMed] [Google Scholar]
Associated Data
This section collects any data citations, data availability statements, or supplementary materials included in this article.