

SUMMARY
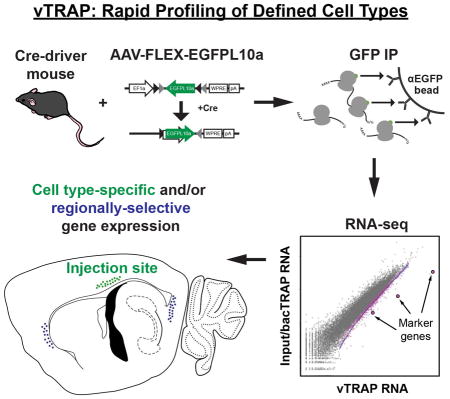
Translational profiling methodologies enable the systematic characterization of cell types in complex tissues such as the mammalian brain, where neuronal isolation is exceptionally difficult. Here, we report a versatile strategy to profile CNS cell types in a spatiotemporally-restricted fashion by engineering a Cre-dependent adeno-associated virus expressing an EGFP-tagged ribosomal protein (AAV-FLEX-EGFPL10a) to access translating mRNAs by TRAP. We demonstrate the utility of this AAV to target a variety of genetically and anatomically defined neural populations expressing Cre recombinase and illustrate the ability of this viral TRAP (vTRAP) approach to recapitulate the molecular profiles obtained by bacTRAP in corticothalamic neurons across multiple serotypes. Furthermore, spatially restricting AAV injections enabled the elucidation of regional differences in gene expression within this cell type. Taken together, these results establish the broad applicability of the vTRAP strategy for the molecular dissection of any CNS or peripheral cell type that can be engineered to express Cre.
Keywords: AAV, molecular profiling, TRAP, MCH, corticothalamic
eTOC
Nectow et al. describe vTRAP, a technology to purify translating mRNAs from genetically defined cell types in a spatiotemporally-restricted fashion. Multiplexing vTRAP with other technologies offers a comprehensive strategy to interrogate the precise role of individual, cell-type specific genes in neural circuit function.
INTRODUCTION
The characterization of the molecular properties of specific cell types within the brain is essential to better understand central nervous system (CNS) function. Differences in the suite of proteins expressed by distinct neuronal populations underlie their unique intrinsic properties, susceptibility to disease, and responses to extrinsic manipulations such as drugs or trauma. Recent advances in translational profiling methods have provided direct access to the translating mRNAs of genetically defined cell populations in complex tissues. The translating ribosome affinity purification (TRAP) technique and its variants rely on targeted transgene expression (Doyle et al., 2008; Heiman et al., 2008), connectivity (Ekstrand et al., 2014; Nectow et al., 2015), or even synaptic activity (Knight et al., 2012) to access cell types and overcome the challenges posed by the heterogeneous organization of the CNS. By directing the expression of an EGFP-tagged ribosome protein L10a (EGFPL10a) to defined cell populations, TRAP enables the isolation of cell type-specific polysome-bound mRNAs from whole tissue homogenates, avoiding potential adaptations and RNA degradation that can result from lengthier cellular isolation methods (Heiman et al., 2014).
The TRAP approach has been employed to profile translation in dozens of cell types in the mouse CNS (Doyle et al., 2008; Mellen et al., 2012; Nakajima et al., 2014; Schmidt et al., 2012; Shrestha et al., 2015) and visceral organs (Grgic et al., 2014; Zhou et al., 2013) and has been valuable in teasing apart neural circuits underlying complex CNS disease. TRAP has been used to identify a single cortical cell type that mediates antidepressant responses (Schmidt et al., 2012), a population of oxytocin receptor expressing interneurons in the prefrontal cortex that modulate sociosexual behavior in females (Nakajima et al., 2014), and cortical cells that integrate stress responses in the context of depressive-like behaviors (Shrestha et al., 2015). It was also applied to identify genes altered in specific neuronal populations in the midbrain (Dougherty et al., 2013) and cerebellum (Mellen et al., 2012) in animal models of neurodevelopmental disorders.
While simple and effective, to date, the application of TRAP to study the mammalian CNS has been dependent on engineered mouse strains for EGFPL10a expression. This has been achieved through the generation of a series of novel bacterial artificial chromosome (BAC) transgenic mouse lines in the “bacTRAP” method (Doyle et al., 2008; Nakajima et al., 2014; Schmidt et al., 2012; Shrestha et al., 2015), or conditional expression requiring either Cre recombinase (Liu et al., 2014; Sanz et al., 2009; Stanley et al., 2013; Zhou et al., 2013) or tetracycline-controlled transcription (Drane et al., 2014). To expand the utility of the TRAP approach, we generated Cre-dependent adeno-associated viral (AAV) vectors to express EGFPL10a. These vectors enable rapid access to translating mRNAs from any discrete neural population engineered to express Cre recombinase while avoiding the need to cross multiple mouse strains harboring independent alleles and unwanted recombination during development. This viral TRAP (vTRAP) approach can be immediately applied for use with any of the scores of commercially available rodent Cre-driver strains or in a combinatorial manner in other species using Cre-expressing viruses.
Here, we demonstrate the incorporation of virally expressed EGFPL10a into endogenous polysomes and validate the vTRAP approach in a number of readily available Cre-driver mouse strains, interrogating cell types in the brainstem, hypothalamus, and cortex as a proof of concept. With a focus on layer 6 corticothalamic (CThal) cells, we show that vTRAP was able to capture cell type-specific translational profiles with high fidelity to the traditional bacTRAP approach. Further, the spatially restricted nature of AAV expression revealed the utility of the vTRAP approach for more localized molecular profiling within neural structures. Taken together, the current work provides a strategy for the rapid and highly efficient targeting of translating ribosomes in a cell-type-specific, anatomically restricted fashion using viral-mediated gene transfer.
RESULTS
Generation and Validation of AAV-FLEX-EGFPL10a
To develop a viral construct that can be used for translational profiling, EGFPL10a was cloned in the reverse orientation into the Cre-dependent pAAV-EF1a-DIO-ChR2-mCherry plasmid, replacing ChR2-mCherry. The flanking loxP and lox2272 sites were left intact, resulting in a virus that had a “double-floxed” inverted open reading frame, or “FLEX switch” (Atasoy et al., 2008), to allow for cell-type-specific expression of the EGFPL10a fusion protein. This construct is hereafter referred to as pAAV-FLEX-EGFPL10a (Figure 1A). In the presence of Cre recombinase, EGFPL10a is reverted back to the “expressed” forward orientation, allowing for conditional expression of a functional protein. Once incorporated into the large ribosomal subunit, the EGFPL10a protein allows for cell-type-specific polysome immunoprecipitation using the TRAP method (Figure 1B). To confirm Cre-dependent expression of the EGFPL10a construct, we co-transfected HEK293T cells with pAAV-FLEX-EGFPL10a and pCAG-Cre-Myc. Immunofluorescent staining for EGFP and c-Myc revealed that expression of the EGFPL10a transgene was restricted only to cells co-stained with anti-Myc and thus contained the Cre plasmid (Figure 1C).
Figure 1. Development and Application of vTRAP Approach.

(A) Schematic depicting the design of the Cre-dependent pAAV-FLEX-EGFPL10a vector.
(B) After expression of EGFPL10a transgene in the targeted cell type, EGFP-labeled polysomes are affinity purified to enrich for cell-specific, polysome-bound, translating mRNAs.
(C) Immunofluorescent staining of HEK293T cells co-transfected with pAAV-FLEX-EGFPL10a (green) and pCAG-Cre (red). Nuclei are labeled with DAPI (blue) in right panel. Scale bar, 20 μm.
(D) Polysome profile plot of sucrose gradient fractions from cortex of Emx1-Cre mice one week after AAV-FLEX-EGFPL10a virus injections. Vertical gray lines indicate fraction divisions. Fractions containing the large subunit (60S, fraction #4), monosome (m, #5), and polysomes (#s 6–16) are labeled.
(E) Western blots showing the distribution of the EGFPL10a transgene, endogenous RPL10a, and RPS6 in the sucrose gradient fractions from D. Short (30 s) and long (5 min) exposures are shown for anti-GFP blot.
(F) Polysome profile plot of sucrose gradient fractions from cortex of Emx1-Cre mice four weeks after AAV-FLEX-EGFPL10a virus injections.
(G) Western blots showing the distribution of the EGFPL10a transgene, endogenous RPL10a, and RPS6 in the sucrose gradient fractions from F. Anti-GFP blot is from a 30 s exposure.
See also Figure S1.
To demonstrate integration of the EGFPL10a construct into translating ribosomes in vivo, pAAV-FLEX-EGFPL10a was packaged into adeno-associated virus (AAV). The viral vectors were then injected into the cerebral cortex of Emx1-IRES-Cre mice which express Cre recombinase in most pyramidal cells throughout the neocortex (Gorski et al., 2002). We looked for incorporation of the EGFPL10a transgene into polysomes at one week and four weeks following virus injections. Polysomes were purified by linear sucrose gradient fractionation of cytosolic lysates from AAV-injected cortex (Figure 1D–G). Western blots of TCA precipitated sucrose gradient fractions revealed that the distribution of EGFPL10a overlapped significantly with endogenous RPL10a as well as RPS6 ribosome subunits, demonstrating that the transgene was inserted into functional polysomes (Figure 1E, G and S1). Immunoblots using anti-GFP antibody showed that even after only one week EGFPL10a could be detected in polysome fractions (Figure 1E, and S1A). However, levels of EGFPL10a protein were substantially higher four weeks after virus injection (Figure 1G and S1B), likely reflecting the timeline needed for maximal AAV expression (Kaspar et al., 2002) and the 2–3.5 turnover rate of ribosomal proteins in the mouse brain (Price et al., 2010). Taken together, these results demonstrate the ability of AAV-FLEX-EGFPL10a to drive Cre-dependent expression of EGFPL10a to label polysomes in vivo.
Using AAV-FLEX-EGFPL10a to Target Genetically Defined Neuronal Populations In Vivo
We next set out to validate functional expression of AAV-FLEX-EGFPL10a in various neural populations throughout the brain. We used existing Cre recombinase transgenic lines to drive expression specifically in dorsal thalamus, cortex, and midbrain (Figure 2A–C). Anti-GFP immunostaining revealed bright puncta within the nucleolus (Figure 2B), the site of ribosomal protein assembly, and is consistent with transgenic EGFPL10a expression in bacTRAP mice.
Figure 2. In vivo Application of vTRAP in Defined Cell Populations.

(A) EGFPL10a expression in cortex of Tlx3-Cre (top) or thalamus of Slc17a6-Cre (bottom) mice injected with AAV-FLEX-EGFPL10a. Schematics of coronal sections, adapted from Franklin and Paxinos (2008), depicting the relative location of the images (red boxes) are shown at left and anti-GFP (green) and NeuN (blue) immunofluorescence are shown on right. Scale bars, 200 μm.
(B) High magnification image of anti-GFP immunofluorescence from cortex of Tlx3-Cre mouse from A. Arrowheads indicate GFP labeling in the nucleolus. Scale bar, 50 μm.
(C) Co-localization between EGFPL10a (EGFP, green) and tyrosine hydroxylase (Th, red) in the VTA of a DAT-Cre mouse (top panels), and EGFPL10a (EGFP, green) and tryptophan hydroxylase 2 (Tph2, red) in the DRN of a SERT-Cre mouse (bottom panels). Schematics at left depict the relative location of the images (red boxes). Scale bars, 100 μm.
(D) qRT-PCR quantification (Mean±SEM) of the expression of marker genes for DA (Slc6a3, Th), 5-HT (Slc6a4, Fev), or GABA (Slc32a1) neurons in VTA (black bars) or DRN (gray bars). ***p<0.001, ****p<0.0001..
To confirm functional integration of EGFPL10a, we performed anti-EGFP immunoprecipitations (IPs) to purify polysomes from specific populations of monoaminergic neurons in the brainstem. We focused on two well-characterized populations each with a set of known cell-specific marker genes: dopaminergic (DA) neurons of the ventral tegmental area (VTA) and serotonergic (5-HT) neurons of the dorsal raphe nucleus (DRN). AAV-FLEX-EGFPL10a was injected into the VTA of DAT-Cre and the DRN of SERT-Cre mice. IPs from each region resulted in substantial RNA yields (average of > 9 ng total RNA per IP, data not shown), suggesting that EGFPL10a protein was incorporated into translating ribosomes in each of these cell types. Quantitative RT-PCR (qRT-PCR) showed significant specificity for known marker genes for each cell type in the IPs from VTA DA and DRN 5-HT neurons (Figure 2D). Dopaminergic marker genes Slc6a3 (16.1-fold) and Th (25.6-fold) were significantly enriched in DA neurons, while serotonergic marker genes Slc6a4 (267.6-fold) and Fev (182.6-fold) were significantly enriched in 5-HT neurons. In contrast, there was no significant difference in Slc32a1 enrichment, which is known to be expressed in both populations. Lastly, AAV-FLEX-EGFPL10a injection into wildtype mice resulted in negligible RNA yields, demonstrating the dependence of this virus on the presence of Cre for detectable EGFPL10a expression (Figure S2A). Together these data demonstrate proper conditional expression and functional integration of the AAV-expressed EGFPL10a transgene in vivo.
Molecular Profiling of Lateral Hypothalamic MCH Neurons
To demonstrate the utility of the vTRAP approach, we characterized the molecular properties of a less well-studied population of neurons in the lateral hypothalamus (LH). The LH is known to be a critical node in controlling survival-related behaviors such as food intake. MCH neurons comprise a significant population within the LH and are known to regulate feeding behavior and sucrose preference (Domingos et al., 2013; Shimada et al., 1998). The sparse distribution of MCH neurons in LH has hindered molecular profiling in the past, making them ideal for comprehensive molecular profiling with vTRAP. We injected AAV-FLEX-EGFPL10a into the LH of Pmch-Cre mice and confirmed cell-type-specific expression of EGFPL10a in MCH neurons (Figure 3A). qRT-PCR on vTRAP RNA showed significant enrichment for the cell type marker Pmch (77.7-fold), as well as Cartpt (15.3-fold) and Tacr3 (12.1-fold), two genes co-expressed in MCH neurons (Croizier et al., 2010; Knight et al., 2012) (Figure 3B). We also found significant depletion of Agrp, a marker for the arcuate nucleus (2.4-fold; Figure 3B).
Figure 3. Molecular Profiling of Lateral Hypothalamic MCH Neurons.

(A) Colocalization between EGFP and MCH. Red box indicates region of interest. Scale bar, 200 μm.
(B) qRT-PCR (Mean±SEM) of cell type marker genes (Pmch, Cartpt, Tacr3) and a non-MCH neuron marker gene (Agrp) after IPs from the hypothalamus. p<0.01 for Pmch and Cartpt, and p<0.05 for Tacr3 and Agrp.
(C) Histogram plotting RNA-seq data from MCH neuron vTRAP, displaying number of genes as a function of fold-enrichment.
(D) Scatter plot of RNA-seq results from MCH vTRAP showing normalized counts from IP (x-axis) and hypothalamus input (y-axis). Gray dots represent individual genes (pink are significantly enriched in the IP). MCH neuron markers (Pmch, Carptpt, Tacr3) are highlighted. Blue line is the best fit curve for all enriched genes.
(E) Schemata for Retro-TRAP (top) and vTRAP (bottom). For Retro-TRAP, a retrograde tracing virus, CAV-GFP, is injected into the NAc of SYN-NBL10 transgenic mice, enabling profiling of NAc inputs from midbrain and hypothalamus. For vTRAP, Cre-dependent AAV-FLEX-EGFPL10a is injected into the LH of Pmch-Cre transgenic mice. Dashed box shows approximate dissection site.
(F) RNA-seq comparison (FPKM Mean±SEM) of genes enriched in both Retro-TRAP (Inputs to NAc; data from (Ekstrand et al., 2014)) and MCH vTRAP (MCH Neurons) data sets. *p<0.05, **p<0.01, ****p<0.0001, #p=0.052.
See also Figure S2.
High-throughput RNA sequencing (RNA-seq) of vTRAP RNA was performed for comprehensive molecular profiling of MCH neurons (Figure 3C). Differential analysis identified 1,761 genes enriched in the IP over LH input. Notably, the most significantly enriched gene in the entire data set was Pmch (99-fold), the driver gene for MCH neurons. Additionally, Cartpt (23.7-fold) and Tacr3 (8.2-fold) were among the top 20 most significantly enriched genes (Figure 3D). A direct comparison of vTRAP with TRAP done on LH from Pmch-Cre mice crossed to the Cre-dependent EGFPL10a reporter line, Rosa26fsTRAP (Zhou et al., 2013), showed substantial reproducibility with regard to control genes (Pmch, Cartpt, Tacr3, Agrp, and Anxa1) and MCH markers identified by vTRAP (Crhbp, Dmrtb1, and Mup6; Figure S2B, C), further validating the efficacy of the viral approach. An earlier study using the Retro-TRAP approach (Ekstrand et al., 2014) identified a number of genes expressed in hypothalamic cells with projections to the nucleus accumbens (NAc) that included but were not restricted to MCH neurons. Comparative analysis of MCH vTRAP results with NAc Retro-TRAP data (Figure 3E) identified a number of transcripts that were significantly enriched in both data sets, including Crhbp (6.9-fold), Dmrtb1 (12.2-fold), and Mup6 (77.1-fold) (Figure 3F). However, we found Anxa1 (p < 0.01; 6.4-fold differential enrichment), a gene specific to midbrain dopaminergic projections to striatum (Ekstrand et al., 2014), and Pmch (15-fold difference; p<0.0001), were significantly differentially expressed between these data sets, reflecting the ability of vTRAP to overcome the heterogeneity of projections to the NAc (Figure 3F). These results suggest that the combined use of vTRAP and Retro-TRAP data can allow comprehensive projection- and cell-type-specific profiling of neural circuits.
vTRAP from Multiple AAV Serotypes Enriches for Cell-Specific Markers in Layer 6 Corticothalamic Neurons
The efficacy of infection of recombinant AAV vectors for different classes of cells is dependent on the nature of the capsid proteins that coat the outer surface of the virus particles. To test whether we could detect noticeable differences in the ability of vTRAP to enrich for cell type specific genes between discrete AAV serotypes, we created pAAV-FLEX-EGFPL10a vectors packaged using three separate capsids commonly used to target neurons in the CNS: AAV2, AAV5, and AAV9 (Aschauer et al., 2013). For these experiments we examined corticothalamic (CThal) projection neurons that reside in layer 6 of the neocortex since this cell population has been targeted by distinct BAC transgenic lines that express either Cre recombinase (Gong et al., 2007) or EGFPL10a (Doyle et al., 2008). A triple cross of Ntsr1-bacTRAP, Ntsr1-Cre, and Rosa26tdTomato reporter mice revealed a nearly complete overlap of EGFPL10a expression and Cre activity in L6 cells in cortex (Figure S3A, B), validating a direct comparison of these lines.
AAV vectors were injected into sensorimotor areas of neocortex of Ntsr1-Cre mice. EGFPL10a expression was detected throughout layer 6 of Ntsr1-bacTRAP mice and in layer 6 at the injection site in the Ntsr1-Cre mice (Figure 4A). Viral-mediated expression of EGFPL10a was relatively higher than transgenic expression in the bacTRAP mice, likely reflecting the constitutive nature of the AAV’s strong EF1a promoter after Cre-mediated recombination. Remarkably, viral expression in Ntsr1-Cre mice led to clear EGFP signal in distal CThal axons and terminal fields in the thalamus (Figure S3C, D). This implies a utility for vTRAP to isolate locally translated transcripts in axons, providing a straightforward strategy for profiling translation from anatomically separated subcellular compartments.
Figure 4. vTRAP Molecular Phenotyping of Layer 6 CThal Cells using Three AAV Serotypes.

(A) Low (top) and high (bottom) magnification images showing EGFPL10a expression restricted to layer 6 in cortex of Ntsr1-bacTRAP (far left) and Ntsr1-Cre mice injected with vTRAP vectors. Anti-EGFP is shown in green and DAPI is shown in blue. Scale bars, 1 mm (top) and 50 μm (bottom).
(B) Scatter plots of TRAP-seq results showing normalized counts from IP (x-axis) and whole cortex input (y-axis) from Ntsr1-bacTRAP (far left) and Ntsr1-Cre mice injected with vTRAP vectors (right). Dots represent individual genes (pink are significantly enriched in IP). The driver gene (Ntsr1) and layer 6 markers (Foxp2, Syt6) are labeled. Blue line is the best fit curve for enriched genes.
(C) Visualization of reads from TRAP-seq data sets shown in B mapped to the genomic locus of three cell-type specific marker genes (Ntsr1, Syt6, and Foxp2), a cortical layer 5 gene (Tmem200a), and a glial gene (Mal). TRAP IP samples are colored blue and their corresponding inputs are shown in gray. RefSeq gene structure is illustrated in black at top (exons are vertical bars). The scale of the y-axis is shown at bottom right for each gene.
(D) qRT-PCR quantification (Mean±SEM) of the expression of control genes shown in C for bacTRAP and vTRAP samples compared to whole cortex input. Positive values indicate enrichment in the IP. Dotted lines represent 2-fold enrichment in either direction. *p<0.05.
See also Figure S3.
To establish translational profiles of the CThal cells, we isolated polysome-bound mRNA by TRAP from cortex of Ntsr1-bacTRAP mice and Ntsr1-Cre mice injected with each of the AAV serotypes. Global differences in gene expression between TRAP IP mRNA (IP) and whole cortex (input) were analyzed by RNA-seq. Despite the inherent variability of virus spread, infection rate, and expression levels between individual virus injections, the biological reproducibility for all vTRAP samples was extremely high (r2 ~0.97–0.98 for all groups; Figure S4A). In each case, greater than 600 genes were shown to be enriched in the Ntsr1 cell population (Figure 4B and S4B). Two layer 6 markers, Foxp2 and Syt6, were highly enriched in the sequencing data from the bacTRAP and vTRAP IPs using AAV5 and AAV9 compared to inputs, while markers for oligodendrocytes (Mal) and for cortical layer 5 neurons (Tmem200a) were depleted (Figures 4B, C and S4C). qRT-PCR confirmed the RNA-seq results, showing that levels of enrichment of Foxp2 and Syt6 in TRAP IP RNA and depletion of Mal and Tmem200a were similar between the bacTRAP, AAV5 vTRAP, and AAV9 vTRAP samples (Figure 4D). Surprisingly, while Ntsr1, Foxp2, and Syt6 were significantly enriched in AAV2 vTRAP IPs, the degree of enrichment was significantly less than the other groups (Figure 4B, D).
Translational Profiles from vTRAP Benchmarked Against bacTRAP
TRAP-seq data from the MCH LH and CThal neurons clearly demonstrate that the vTRAP approach can enrich for cell type specific marker genes similar to transgenic TRAP methods. To ask how well vTRAP translational profiles correlate with those from bacTRAP, we generated a list of genes specific to the CThal population. We applied the “specificity index” (SI) algorithm, a comparative rank-order approach that identifies genes that are unique to each data set (e.g. cell type) in a given analysis (Dougherty et al., 2010), to bacTRAP data from six neuronal and non-neuronal cortical cell types. In addition to CThal cells, our analysis included layer 5a corticostriatal cells, layer 5b corticopontine cells, interneurons, astrocytes, endothelial cells, and whole cortex which included all other cell types (Figure 5A and Table S1). All bacTRAP mouse strains targeting these cell populations have been described elsewhere (Doyle et al., 2008; Nakajima et al., 2014; Schmidt et al., 2012) except for the endothelial cell-specific Abcb1a-bacTRAP line (see Figure S3E, F and Supplemental Information).
Figure 5. The Enrichment of Cell-type specific Genes is Highly Correlated between vTRAP and bacTRAP Approaches.

(A) Schematic depicting the data sets used to target specific cell populations in the cerebral cortex. CStr, corticostriatal; CPn, corticopontine; CThal, corticothalamic.
(B) Heat map of cell specific genes (horizontal axis) from bacTRAP lines representing six distinct cell populations and whole tissue from the cerebral cortex. Color is based on the normalized expression for each cell type and only genes with a p-value (pSI) < 0.05 are shown. Yellow box indicates the CThal (Ntsr1-bacTRAP) specific genes.
(C) Scatter plots comparing the expression of CThal specific genes from B between Ntsr1 bacTRAP (x-axis in each) and Ntsr1 vTRAP (y-axis) vectors. The linear equation and coefficient of determination (r2) is shown at the top of each graph and the best fit curve for each data set is shown as a solid line.
(D) Heat map showing enrichment (TRAP IP/input) of marker genes for L6 projection neurons (left) or glial cells (right) identified by a variety of experimental approaches. Rows are individual replicates from bacTRAP (“bac”) and vTRAP data sets. The cortical region analyzed in each study is labeled on top and color-coded bars at bottom indicate the cell type isolation method. Red box emphasizes genes identified from S1, which overlaps with the vTRAP virus injection site. S1, mouse primary somatosensory; V1, mouse primary visual; hsPFC, human prefrontal cortex.
See also Tables S1, S2, S3, and Figures S4 and S5.
The SI algorithm identified 428 genes with pSI<0.05 for the Ntsr1 CThal population (Figure 5B, Table S2). A direct comparison of sequencing results from vTRAP and bacTRAP revealed an extremely high correlation in the expression of these CThal specific genes between both methods for each serotype (Figure 5C). The coefficient of determination (r2) for each comparison was extremely high (≥0.940) and the slope of the best fit curves were all close to 1.0 (Figure 5C). There was a slight bias towards the bacTRAP data set in all three vTRAP conditions (y-intercept ranged from −0.49 to −0.87), likely due to vTRAP sampling only a subset of Ntsr1-expressing cells located near the injection site. The levels of expression of IP-enriched genes were also very similar between these methods (Figure S5C). These results demonstrate the ability of the viral approach to obtain cell-specific translational profiles with high fidelity to bacTRAP.
To assess the utility of vTRAP in the context of other cell type-specific profiling methods, we compiled a list of layer 6 projection neuron markers in various regions of cortex identified by sorting retrogradely labeled cells (Galazo et al., 2016), in situ hybridization (ISH) (Sorensen et al., 2015), bacTRAP (Doyle et al., 2008), and single cell RNA-seq from mouse (Tasic et al., 2016; Zeisel et al., 2015) or human (Lake et al., 2016) cortex (Table S3). The overwhelming majority these genes were significantly enriched in the vTRAP IPs, including all of the genes identified in studies focused on primary somatosensory cortex (S1), which overlaps with our virus injection site (Figure 4D). In contrast, most astrocyte and oligodendrocyte genes identified by bacTRAP (Doyle et al., 2008), immunopanning (Zhang et al., 2014), or single cell RNA-seq (Tasic et al., 2016) were depleted in vTRAP IPs (Figure 4D, right). The sensitivity of vTRAP compares favorably to single cell RNA-seq with over 92% of the top 1000 genes identified in single cell data sets from three overlapping populations of L6 cells being detected in Ntsr1 cells by vTRAP (Figure S5A, B). Conversely, many low-expressed genes (RPKM<10) significantly enriched in vTRAP IPs were not detected in individual single cell RNA seq data sets (Figure S5D, E).
Direct Comparison of bacTRAP and vTRAP Reveals Regionally Expressed Genes
Because the AAV injections targeted a spatially restricted population of Ntsr1-expressing cells compared to the widely distributed bacTRAP-labeled cells, we asked whether a comparison of these approaches could identify anatomically-restricted genes that may be used to define subregions of cortex. We created lists of “bacTRAP-specific” and “vTRAP-specific” genes, defined as the union of those differentially expressed between bacTRAP and vTRAP AAV9 IP samples and enriched in the IP over input for each approach (Figure S6A). Forty-three bacTRAP-specific genes (Figure 6A, blue circles) and 50 vTRAP-specific genes (Figure 6A, orange circles) were identified. These genes accounted for only a minority of the IP-enriched transcripts in each approach (6.7% for bacTRAP and 8.3% for vTRAP) reflecting the high correlation between the techniques.
Figure 6. Differential Expression between vTRAP and bacTRAP Reveal Regionally Expressed Genes.

(A) Scatter plot of the expression of genes differentially expressed between bacTRAP (x-axis) and vTRAP with the AAV9 vector (y-axis) IP samples. Yellow circles are vTRAP-specific genes and blue circles are bacTRAP-specific. Genes with regional expression outside of the site of AAV injection are circled in red.
(B) Pie charts of the quantification of expression pattern scores of genes significantly enriched in vTRAP IP versus Input and vTRAP over bacTRAP (“vTRAP Specific”) or bacTRAP IP versus Input and bacTRAP over vTRAP (“bacTRAP Specific”).
(C) ISH in cortex of selected bacTRAP-specific genes with regional expression. Green ovals specify the relative injection site of vTRAP vectors and arrowheads identify regions with high expression. Insets show higher magnification of boxed areas 1–6 or the relative AAV injection site (Inj) for each gene.
(D) ISH for endogenous Ntsr1 (top) and anti-EGFP immunolabeling of Ntsr1-bacTRAP mouse brain (bottom) showing expression in entorhinal cortex (arrowheads).
(E) ISH of selected “regional” bacTRAP-specific genes with high expression in the entorhinal cortex (arrowheads). All in situ hybridization images in C–E are © 2015 Allen Institute for Brain Science and were obtained from the Allen Mouse Brain Atlas (www.brain-map.org). See Table S5 for data sets used.
(F) qRT-PCR quantification (Mean±SEM) of the expression (IP/input) of five bacTRAP enriched genes in bacTRAP (white bars) and three vTRAP serotype (gray bars) samples. Cbln1, Cbln4, Cldn1, and Nnat, p<0.05 for IP vs. input for all groups. **p<0.01, ***p<0.001, ****p<0.0001.
Scale bars, 1 mm, except injection site insets in C, 500 μm. See also Figure S6 and Table S4.
ISH data from the Allen Mouse Brain Atlas (Lein et al., 2007) was utilized to examine the distribution of bacTRAP-specific or vTRAP-specific genes in the cortex (see Supplemental Experimental Procedures). While about a third of the genes in each data set were expressed throughout the cortex (Figure 6B, “widespread”), the expression patterns of 37% (16) of the bacTRAP-specific genes were restricted to regions of the cortex that did not overlap with the site of the vTRAP AAV injections (Figure 6B, “Regional”). These included genes such as Col23a1, which was expressed in rostrolateral cortex, and Cbln1, Nnat, and L6g6e, which were found at extreme rostral and caudal cortical sites (Figure 6C and S6C, D). ISH for endogenous Ntsr1 revealed high expression in entorhinal cortex in addition to layer 6 CThal cells and anti-GFP immunostaining confirmed this pattern was recapitulated in the Ntsr1-bacTRAP mice (Figure 6D). Indeed, entorhinal cortex-specific genes Mum1l1, Fam70b, Lef1, Cldn1, Cbln4, and Pth2r were not detected by vTRAP but were all present on the bacTRAP-specific list (Figure 6E and S6C, D). Regionally expressed genes accounted for the majority of those with the highest fold change in bacTRAP over vTRAP (red circles in Figure 6A), including pSI identified CThal genes (Figure S6B). In fact, 31 of the 43 (72%) bacTRAP-specific genes were also significantly enriched when bacTRAP was compared to AAV2 and AAV5 vTRAP data, including 11 of the 16 regional genes, demonstrating remarkable consistency between AAV serotypes. Quantification by qRT-PCR confirmed these differences in expression between bacTRAP and vTRAP with Cbln1, Cbln4, Cldn1, and Nnat, all significantly enriched in bacTRAP IP and significantly depleted in vTRAP IP for each of the AAV vectors used (p < 0.05 for all genes in each group), while Pth2r was significant for AAV9, the data set used to generate the vTRAP-specific list (Figure 6G). Failure to identify vTRAP-specific regional genes may be due to cell-specific genes being enriched in both data sets due to the overlap in expression between bacTRAP and vTRAP, whereas bacTRAP-specific regional genes are depleted from vTRAP data leading to high differential expression.
DISCUSSION
The translating ribosome affinity purification (TRAP) technique has traditionally relied on engineered mouse strains to target the EGFPL10a transgene to cell types of interest. In the current work, we extend the TRAP method to take advantage of viral-mediated gene transfer, enabling rapid and anatomically-restricted molecular profiling of any cell type engineered to express Cre recombinase. The broad availability of Cre-driver lines (Gerfen et al., 2013; Gong et al., 2007; Madisen et al., 2010; Taniguchi et al., 2011) allows the viral TRAP strategy to be applied immediately to myriad cell types without the need to generate novel transgenic strains or cross existing lines to Cre-dependent reporters. AAV-mediated overexpression of the TRAP transgene also enables high quality translational profiling data to be generated as early as three weeks following virus injection, allowing for substantial temporal flexibility when designing experiments. Further, viral delivery of the EGFPL10a transgene into adult mouse tissue overcomes the possibility of off-target recombination due to transient expression of Cre in unwanted cell types during development (Lam et al., 2011; Padilla et al., 2010). Cre driver lines that rely on promoters with temporally dynamic expression patterns (Sanz et al., 2009) impose a significant limitation on the utility of Cre-dependent TRAP and RiboTag reporter strains.
The AAV-mediated strategy expands the utility of TRAP to other mammalian species which have historically proven to be genetically intractable. For example, the AAV-FLEX-EGFPL10a vector can immediately be used with the growing number of Cre-expressing rat strains (Witten et al., 2011) or in combination with Cre-expressing viruses in non-transgenic animals such as monkeys (Oguchi et al., 2015). Projection-specific profiling can also be achieved with vTRAP by combining AAV-FLEX-EGFPL10a with viruses that transduce gene expression in a retrograde fashion, such as rabies or canine adenovirus (Schwarz et al., 2015).
Cell type-specific expression of AAV-FLEX-EGFPL10a in cortex, thalamus, brainstem, and hypothalamus demonstrates the utility of vTRAP to profile a variety of cell types throughout the brain. It also presents a strategy to quickly characterize unknown cell populations labeled with Cre. A simple vTRAP experiment followed by qPCR for selected target genes can easily ascertain neuronal or non-neuronal identity, the neurotransmitter profile (e.g. excitatory, inhibitory, or modulatory), receptor composition, and other properties of the cells without the need for detailed anatomical or electrophysiological investigation. The GENSAT library of Cre driver mice alone contains a number of strains that express Cre in scattered, morphologically ambiguous cells in areas such as the cortex, hypothalamus, hippocampus, midbrain, and brainstem. These may represent uncharacterized cell populations or known cell types which were not genetically labeled previously.
The observation of EGFPL10a expression in distal axons of projection neurons following AAV-FLEX-EGFPL10a injections presents vTRAP as an intriguing approach to profile axon-specific transcripts in vivo. Translational profiling of axonal mRNA (“axon-TRAP”) has previously been achieved in the developing retinotectal system by transplanting transgenic tissue into wildtype animals (Yoon et al., 2012) or relying on very specific transgenic mouse lines with high levels of transgene expression (Shigeoka et al., 2016). The spatial and temporal control of virus injections overcomes these technical hurdles and precludes a reliance on highly restricted Cre driver lines, allowing vTRAP to be exploited for axon profiling of a wider selection of cell types and even across species. Such an application of the technique may be used for understanding neuroplasticity, axonopathy, regeneration, and neurodegeneration.
The extremely high correlation between vTRAP and bacTRAP allows for the targeting and profiling of a single genetically determined cell population by either viral or transgenic approaches. This is particularly useful for cases where anatomical distinction is more easily achieved with viral injection rather than physical dissection. For example, vTRAP can be used with the Slc17a6 (Vglut2) Cre-driver mice, in which all projection neurons in thalamus express Cre, to examine discrete thalamic nuclei; or with dopamine receptor mice to target dorsal or ventral striatal structures. The localized nature of viral injections also enables the exploration of regional differences in gene expression in genetically similar cells within a single neural structure. This was exemplified in the Ntsr1 cells by the discovery that vTRAP failed to enrich for genes expressed in cortical areas distal to the virus injection, establishing a high level of sensitivity in the approach and it’s potential to define molecularly distinct subdivisions of anatomical structures. While methods for sequencing the transcriptomes of single cells have greatly improved in recent years, the higher sensitivity of vTRAP for detecting low expressed cell type-specific genes provides an advantage for unearthing subtle molecular differences that may result from experimental manipulation such as behavior or pharmacological treatments.
Different AAV serotypes are known to have tropism for distinct cell types throughout the brain and body. The success of vTRAP experiments using viruses coated with three different capsid proteins implies that vTRAP is not limited by AAV serotype, making this technique amenable to characterizing a wide variety of cell types. However we found that the AAV2 virus had limited spread in cortex and a number of the layer 6 marker genes were not as highly enriched in the AAV2 data set when compared to the other serotypes and bacTRAP. This emphasizes the need to carefully test and select AAV serotypes which are most appropriate to target the cell type of interest, especially in less well-characterized brain regions or other tissues throughout the body.
AAVs have become indispensable tools that allow neuroscientists to functionally dissect disparate components of neural circuits in vivo. Vectors that deliver light-activated channels and pumps (channelrhodopsins, halorhodopsins, archaerhodopsins), designer receptors (DREADDs), genetically-encoded calcium indicators (GECIs), and siRNAs are widely available from academic and commercial sources. In addition, genome editing technologies such as CRISPR have advanced to the point where it is possible to acutely manipulate gene expression and epigenetic states using viral-mediated gene transfer (Ran et al., 2015). Multiplexing the vTRAP vectors we report here in tandem with the above approaches offers a comprehensive strategy to interrogate the precise role of individual, cell type-specific genes in circuit function. These studies could facilitate our understanding of cell type specific molecular adaptations underlying changes in neural activity, the impact of targeted genetic alterations on cell function, as well as correlated behavioral alterations observed after such experimental perturbations. Such intersectional strategies will enable the study of neural circuitry at a resolution not previously possible.
This study reports a rapid, spatially-restricted tool for translational profiling of cell types that can be applied easily throughout the body. Previous approaches to molecular profiling within complex tissues were restricted to transgenic strategies which took significant amounts of time to generate new and/or cross multiple mouse strains, and could potentially result in contamination from off-target cell populations from ontogenetic expression. The vTRAP technology now enables a rapid and highly anatomically-restricted methodology, which can elucidate marker genes for specific subregions within a given tissue. The utility of the vTRAP approach for translational profiling arises from its rapidity, ease of use, and broad applicability to systems already utilizing adeno-associated viruses.
EXPERIMENTAL PROCEDURES
Animals
All procedures involving animals were approved by The Rockefeller University Institutional Animal Care and Use Committee and were in accordance with National Institutes of Health guidelines. Ntsr1-bacTRAP (TS16), Pmch-Cre, and DAT-Cre mice were generated and maintained at The Rockefeller University and described previously (Doyle et al., 2008; Ekstrand et al., 2014; Jego et al., 2013; Knight et al., 2012). Ntsr1-Cre (GN220) and SERT-Cre (ET33) mice were generated by the GENSAT Project (Gong et al., 2007) and were purchased from the Mutant Mouse Regional Resource Center (Stock IDs 017266-UCD and 031028-UCD, respectively). The generation of Abcb1a-bacTRAP mice used for the Specificity Index is described in Supplemental Experimental Procedures. All mice were bred on a C57BL/6J background and maintained on a 12 hr light-dark cycle. Animals used in the study were male and female. Mice were sacrificed at 10–20 weeks of age within the same circadian period (12:00–16:00).
Generation of AAVs
The plasmid pAAV-FLEX-EGFPL10a was generated by subcloning the EGFPL10a transgene into pAAV-EF1a-DIO-hChR2(H134R)-mCherry-WPRE-HGHpA (Addgene plasmid #20297) in the reverse orientation, replacing ChR2-mCherry. Plasmids were then packaged into AAVs at the University of North Carolina Vector Core or the University of Pennsylvania Vector Core. Virus titers were 1.63×10¹³ gc/ml for AAV5, 4.7×10¹² gc/ml for AAV2, and 7.47×10¹² gc/ml for AAV9. See Supplemental Experimental Procedures for more details.
Stereotaxic Surgeries
Bilateral stereotaxic injections of AAV-FLEX-EGFPL10a into adult (8–20 weeks old) Cre mice (male and female) under ketamine/xylazine (100/10 mg/kg) anesthesia were performed as described in Supplemental Experimental Procedures. Animals were sacrificed 1–4 weeks after surgery and tissue was collected for polysome immmunoprecipitations (IPs), histology, or polysome fractionation as described below.
Immunohistochemistry
Immunofluorescent staining was carried out on free-floating brain sections or adherent HEK293T cells and imaged on either a Zeiss LSM780 or LSM700 confocal microscope. For details, see Supplemental Experimental Procedures.
Translating ribosome affinity purification
Affinity purification of EGFP-tagged polysomes was done 3–4 weeks after virus injections. Three biological replicates consisting of tissue pooled from 3–5 mice (mixed sex) were collected for each condition. IPs and RNA extractions were carried out as previously described (Heiman et al., 2014) and in Supplemental Experimental Procedures. Briefly, brain tissue was homogenized in buffer containing 10 mM HEPES-KOH (pH 7.4), 150 mM KCl, 5 mM MgCl2, 0.5 mM DTT, 100 μg/ml cycloheximide, RNasin (Promega, Madison, WI) and SUPERas-InTM (Life Technologies) RNase inhibitors, and Complete-EDTA-free protease inhibitors (Roche), and then cleared by two-step centrifugation to isolate polysome-containing cytoplasmic supernatant. Polysomes were immunoprecipitated using monoclonal anti-EGFP antibodies (clones 19C8 and 19F7; see Heiman et al., 2008) bound to biotinylated-Protein L (Pierce, Thermo Fisher, Waltham, MA) coated streptavidin-conjugated magnetic beads (Life Technologies) and bound RNA was purified using the Absolutely RNA Nanoprep kit (Agilent). RNA quantity was measured with a Nanodrop 1000 spectrophotometer and quality was assayed on an Agilent 2100 Bioanalyzer. Only samples with RNA integrity values ≥7.0 were used for RNA-seq and qRT-PCR analyses.
RNA-seq and qRT-PCR
For cortical samples, TRAP RNA was amplified using the Ovation RNA-Seq System V2 Kit (NuGEN, San Carlos, CA) and RNA-seq libraries were prepared using the TruSeq RNA Sample Preparation Kit v2 (Illumina, San Diego, CA) following manufacturer’s protocols. MCH neuron RNA-seq libraries were prepared using the SMARTer Ultra Low RNA Kit (Clontech, Mountain View, CA). Sequencing reactions were done using the Illumina HiSeq 2500 platform with three samples multiplexed per sequencing lane. RNA-seq reads were then aligned to annotated exons using the mm10 mouse reference genome with STAR (Dobin et al., 2013) version 2.0.0e_r291 and quantification of aligned reads was done using HTSeq (Anders et al., 2015) version 0.6.0. Differential expression was calculated by DESeq2 (Love et al., 2014) version 1.4.5, filtering for an FDR cutoff of <0.05 and |log2| fold change >1.0. Specificity Index analysis was performed using the pSI (Specificity Index Statistic) R-package version 1.1 (Dougherty et al., 2010; Xu et al., 2014). Detailed methods can be found in Supplemental Experimental Procedures.
The Taqman method was used for qRT-PCR analysis on three biological replicates for each condition using either an Applied Biosystems 7500 Fast or StepOnePlus Fast Real-Time PCR System. Data were normalized to Rpl23 (Figures 2C, 3B and S2) by standard curve or to Actb (Figures 4D and 6G) by the comparative CT (2−ΔΔCT) method (Livak and Schmittgen, 2001).
Polysome fractionation
Polysome fractionations were collected by centrifugation in a sucrose gradient as described previously (Darnell et al., 2011) and in Supplemental Experimental Procedures. Briefly, TCA-precipitated proteins from each fraction were analyzed by Western blot, detected by enhanced chemiluminescence (Western Lightning Plus detection kit, Perkin Elmer), and quantified by densitometry following film scans (Kodak MR film, ImageJ software).
Statistics
All data analysis was performed in Graphpad Prism, Microsoft Excel, or R (R Core Team, 2013). Student’s t-test was used to compare differences in qRT-PCR results between IP and input samples in Figures 2D, 3F, 4D, and 6G. Two-way ANOVA on the log2 fold change values was used to compare each of the vTRAP groups against bacTRAP for the specified genes in Figures 4D and 6G.
Supplementary Material
HIGHLIGHTS.
vTRAP enables rapid, viral-based tagging of translating ribosomes in defined cells
vTRAP faithfully recapitulates molecular profiles obtained from bacTRAP
vTRAP can detect regional, cell type-specific differences in gene expression
vTRAP was used for comprehensive molecular profiling of LH MCH neurons
Acknowledgments
This work was supported by the Howard Hughes Medical Institute (J.M.F. and N.H.), the JPB Foundation (J.M.F.), NIH/NIDA P30 Center DA035756 (N.H.), NIH/NIMH Conte Center PHS MH090963 (N.H.), Brain & Behavior Research Foundation NARSAD Young Investigator Grant 21464 (E.F.S.), the van Ameringen Foundation (E.F.S.), Whitehall Foundation Grant 2014-12-104 (E.F.S.), NIH/NINDS R01NS091722 (E.F.S.) and NSF INSPIRE Award 1343174 (N.H. and E.F.S.). A.R.N. acknowledges support from The Rockefeller University, provided by the David Rockefeller Fellowship. We wish to thank The Rockefeller University Genomics and Bio-Imaging Resource Centers. We also thank Karl Deisseroth for contributing the plasmid pAAV-EF1a-DIO-ChR2-mCherry, Jennifer Darnell for assistance with polysome profiling, Marian Mellen and Juncheng Li for sharing the Dlx1 and bacTRAP sequencing data, and Eva B. Holzner for technical assistance.
Footnotes
ACCESSION NUMBERS
Raw RNA-seq data sets are available from NCBI’s Gene Expression Omnibus GEO Series accession number GSE89737.
AUTHOR CONTRIBUTIONS
A.R.N. and E.F.S. designed all experiments, and A.R.N., E.F.S., M.V.M., K.L.M., C.E.S., and M.I.E. performed all experiments. G.S.R. and K.S. performed and analyzed polysome fractionations. B.C.F. assisted with IHC. A.R.N., E.F.S., M.V.M., M.I.E., Y.L., A.M., J.M.F., and N.H. analyzed data. A.R.N., N.H., and E.F.S. wrote the paper.
COMPETING INTERESTS
The authors declare no financial/non-financial competing interests.
Publisher's Disclaimer: This is a PDF file of an unedited manuscript that has been accepted for publication. As a service to our customers we are providing this early version of the manuscript. The manuscript will undergo copyediting, typesetting, and review of the resulting proof before it is published in its final citable form. Please note that during the production process errors may be discovered which could affect the content, and all legal disclaimers that apply to the journal pertain.
References
- Anders S, Pyl PT, Huber W. HTSeq--a Python framework to work with high-throughput sequencing data. Bioinformatics. 2015;31:166–169. doi: 10.1093/bioinformatics/btu638. [DOI] [PMC free article] [PubMed] [Google Scholar]
- Aschauer DF, Kreuz S, Rumpel S. Analysis of transduction efficiency, tropism and axonal transport of AAV serotypes 1, 2, 5, 6, 8 and 9 in the mouse brain. PLoS One. 2013;8:e76310. doi: 10.1371/journal.pone.0076310. [DOI] [PMC free article] [PubMed] [Google Scholar]
- Atasoy D, Aponte Y, Su HH, Sternson SM. A FLEX switch targets Channelrhodopsin-2 to multiple cell types for imaging and long-range circuit mapping. J Neurosci. 2008;28:7025–7030. doi: 10.1523/JNEUROSCI.1954-08.2008. [DOI] [PMC free article] [PubMed] [Google Scholar]
- Croizier S, Franchi-Bernard G, Colard C, Poncet F, La Roche A, Risold PY. A comparative analysis shows morphofunctional differences between the rat and mouse melanin-concentrating hormone systems. PLoS One. 2010;5:e15471. doi: 10.1371/journal.pone.0015471. [DOI] [PMC free article] [PubMed] [Google Scholar]
- Darnell JC, Van Driesche SJ, Zhang C, Hung KY, Mele A, Fraser CE, Stone EF, Chen C, Fak JJ, Chi SW, et al. FMRP stalls ribosomal translocation on mRNAs linked to synaptic function and autism. Cell. 2011;146:247–261. doi: 10.1016/j.cell.2011.06.013. [DOI] [PMC free article] [PubMed] [Google Scholar]
- Dobin A, Davis CA, Schlesinger F, Drenkow J, Zaleski C, Jha S, Batut P, Chaisson M, Gingeras TR. STAR: ultrafast universal RNA-seq aligner. Bioinformatics. 2013;29:15–21. doi: 10.1093/bioinformatics/bts635. [DOI] [PMC free article] [PubMed] [Google Scholar]
- Domingos AI, Sordillo A, Dietrich MO, Liu ZW, Tellez LA, Vaynshteyn J, Ferreira JG, Ekstrand MI, Horvath TL, de Araujo IE, et al. Hypothalamic melanin concentrating hormone neurons communicate the nutrient value of sugar. eLife. 2013;2:e01462. doi: 10.7554/eLife.01462. [DOI] [PMC free article] [PubMed] [Google Scholar]
- Dougherty JD, Maloney SE, Wozniak DF, Rieger MA, Sonnenblick L, Coppola G, Mahieu NG, Zhang J, Cai J, Patti GJ, et al. The Disruption of Celf6, a Gene Identified by Translational Profiling of Serotonergic Neurons, Results in Autism-Related Behaviors. J Neurosci. 2013;33:2732–2753. doi: 10.1523/JNEUROSCI.4762-12.2013. [DOI] [PMC free article] [PubMed] [Google Scholar]
- Dougherty JD, Schmidt EF, Nakajima M, Heintz N. Analytical approaches to RNA profiling data for the identification of genes enriched in specific cells. Nucleic Acids Res. 2010;38:4218–4230. doi: 10.1093/nar/gkq130. [DOI] [PMC free article] [PubMed] [Google Scholar]
- Doyle JP, Dougherty JD, Heiman M, Schmidt EF, Stevens TR, Ma G, Bupp S, Shrestha P, Shah RD, Doughty ML, et al. Application of a translational profiling approach for the comparative analysis of CNS cell types. Cell. 2008;135:749–762. doi: 10.1016/j.cell.2008.10.029. [DOI] [PMC free article] [PubMed] [Google Scholar]
- Drane L, Ainsley JA, Mayford MR, Reijmers LG. A transgenic mouse line for collecting ribosome-bound mRNA using the tetracycline transactivator system. Frontiers in molecular neuroscience. 2014;7:82. doi: 10.3389/fnmol.2014.00082. [DOI] [PMC free article] [PubMed] [Google Scholar]
- Ekstrand MI, Nectow AR, Knight ZA, Latcha KN, Pomeranz LE, Friedman JM. Molecular profiling of neurons based on connectivity. Cell. 2014;157:1230–1242. doi: 10.1016/j.cell.2014.03.059. [DOI] [PMC free article] [PubMed] [Google Scholar]
- Franklin KBJ, Paxinos G. The mouse brain in stereotaxic coordinates. 3. Amsterdam ; Boston: Elsevier Academic Press; 2008. [Google Scholar]
- Galazo MJ, Emsley JG, Macklis JD. Corticothalamic Projection Neuron Development beyond Subtype Specification: Fog2 and Intersectional Controls Regulate Intraclass Neuronal Diversity. Neuron. 2016;91:90–106. doi: 10.1016/j.neuron.2016.05.024. [DOI] [PMC free article] [PubMed] [Google Scholar]
- Gerfen CR, Paletzki R, Heintz N. GENSAT BAC cre-recombinase driver lines to study the functional organization of cerebral cortical and basal ganglia circuits. Neuron. 2013;80:1368–1383. doi: 10.1016/j.neuron.2013.10.016. [DOI] [PMC free article] [PubMed] [Google Scholar]
- Gong S, Doughty M, Harbaugh CR, Cummins A, Hatten ME, Heintz N, Gerfen CR. Targeting Cre recombinase to specific neuron populations with bacterial artificial chromosome constructs. J Neurosci. 2007;27:9817–9823. doi: 10.1523/JNEUROSCI.2707-07.2007. [DOI] [PMC free article] [PubMed] [Google Scholar]
- Gorski JA, Talley T, Qiu M, Puelles L, Rubenstein JL, Jones KR. Cortical excitatory neurons and glia, but not GABAergic neurons, are produced in the Emx1-expressing lineage. The Journal of neuroscience : the official journal of the Society for Neuroscience. 2002;22:6309–6314. doi: 10.1523/JNEUROSCI.22-15-06309.2002. [DOI] [PMC free article] [PubMed] [Google Scholar]
- Grgic I, Krautzberger AM, Hofmeister A, Lalli M, DiRocco DP, Fleig SV, Liu J, Duffield JS, McMahon AP, Aronow B, et al. Translational profiles of medullary myofibroblasts during kidney fibrosis. Journal of the American Society of Nephrology : JASN. 2014;25:1979–1990. doi: 10.1681/ASN.2013101143. [DOI] [PMC free article] [PubMed] [Google Scholar]
- Heiman M, Kulicke R, Fenster RJ, Greengard P, Heintz N. Cell type-specific mRNA purification by translating ribosome affinity purification (TRAP) Nat Protoc. 2014;9:1282–1291. doi: 10.1038/nprot.2014.085. [DOI] [PMC free article] [PubMed] [Google Scholar]
- Heiman M, Schaefer A, Gong S, Peterson JD, Day M, Ramsey KE, Suarez-Farinas M, Schwarz C, Stephan DA, Surmeier DJ, et al. A translational profiling approach for the molecular characterization of CNS cell types. Cell. 2008;135:738–748. doi: 10.1016/j.cell.2008.10.028. [DOI] [PMC free article] [PubMed] [Google Scholar]
- Jego S, Glasgow SD, Herrera CG, Ekstrand M, Reed SJ, Boyce R, Friedman J, Burdakov D, Adamantidis AR. Optogenetic identification of a rapid eye movement sleep modulatory circuit in the hypothalamus. Nat Neurosci. 2013;16:1637–1643. doi: 10.1038/nn.3522. [DOI] [PMC free article] [PubMed] [Google Scholar]
- Kaspar BK, Vissel B, Bengoechea T, Crone S, Randolph-Moore L, Muller R, Brandon EP, Schaffer D, Verma IM, Lee KF, et al. Adeno-associated virus effectively mediates conditional gene modification in the brain. Proc Natl Acad Sci U S A. 2002;99:2320–2325. doi: 10.1073/pnas.042678699. [DOI] [PMC free article] [PubMed] [Google Scholar]
- Knight ZA, Tan K, Birsoy K, Schmidt S, Garrison JL, Wysocki RW, Emiliano A, Ekstrand MI, Friedman JM. Molecular profiling of activated neurons by phosphorylated ribosome capture. Cell. 2012;151:1126–1137. doi: 10.1016/j.cell.2012.10.039. [DOI] [PMC free article] [PubMed] [Google Scholar]
- Lake BB, Ai R, Kaeser GE, Salathia NS, Yung YC, Liu R, Wildberg A, Gao D, Fung HL, Chen S, et al. Neuronal subtypes and diversity revealed by single-nucleus RNA sequencing of the human brain. Science. 2016;352:1586–1590. doi: 10.1126/science.aaf1204. [DOI] [PMC free article] [PubMed] [Google Scholar]
- Lam DD, Leinninger GM, Louis GW, Garfield AS, Marston OJ, Leshan RL, Scheller EL, Christensen L, Donato J, Jr, Xia J, et al. Leptin does not directly affect CNS serotonin neurons to influence appetite. Cell metabolism. 2011;13:584–591. doi: 10.1016/j.cmet.2011.03.016. [DOI] [PMC free article] [PubMed] [Google Scholar]
- Lein ES, Hawrylycz MJ, Ao N, Ayres M, Bensinger A, Bernard A, Boe AF, Boguski MS, Brockway KS, Byrnes EJ, et al. Genome-wide atlas of gene expression in the adult mouse brain. Nature. 2007;445:168–176. doi: 10.1038/nature05453. [DOI] [PubMed] [Google Scholar]
- Liu J, Krautzberger AM, Sui SH, Hofmann OM, Chen Y, Baetscher M, Grgic I, Kumar S, Humphreys BD, Hide WA, et al. Cell-specific translational profiling in acute kidney injury. J Clin Invest. 2014;124:1242–1254. doi: 10.1172/JCI72126. [DOI] [PMC free article] [PubMed] [Google Scholar]
- Livak KJ, Schmittgen TD. Analysis of relative gene expression data using real-time quantitative PCR and the 2(−Delta Delta C(T)) Method. Methods. 2001;25:402–408. doi: 10.1006/meth.2001.1262. [DOI] [PubMed] [Google Scholar]
- Love MI, Huber W, Anders S. Moderated estimation of fold change and dispersion for RNA-seq data with DESeq2. Genome Biol. 2014;15:550. doi: 10.1186/s13059-014-0550-8. [DOI] [PMC free article] [PubMed] [Google Scholar]
- Madisen L, Zwingman TA, Sunkin SM, Oh SW, Zariwala HA, Gu H, Ng LL, Palmiter RD, Hawrylycz MJ, Jones AR, et al. A robust and high-throughput Cre reporting and characterization system for the whole mouse brain. Nat Neurosci. 2010;13:133–140. doi: 10.1038/nn.2467. [DOI] [PMC free article] [PubMed] [Google Scholar]
- Mellen M, Ayata P, Dewell S, Kriaucionis S, Heintz N. MeCP2 binds to 5hmC enriched within active genes and accessible chromatin in the nervous system. Cell. 2012;151:1417–1430. doi: 10.1016/j.cell.2012.11.022. [DOI] [PMC free article] [PubMed] [Google Scholar]
- Nakajima M, Gorlich A, Heintz N. Oxytocin modulates female sociosexual behavior through a specific class of prefrontal cortical interneurons. Cell. 2014;159:295–305. doi: 10.1016/j.cell.2014.09.020. [DOI] [PMC free article] [PubMed] [Google Scholar]
- Nectow AR, Ekstrand MI, Friedman JM. Molecular characterization of neuronal cell types based on patterns of projection with Retro-TRAP. Nat Protoc. 2015;10:1319–1327. doi: 10.1038/nprot.2015.087. [DOI] [PubMed] [Google Scholar]
- Oguchi M, Okajima M, Tanaka S, Koizumi M, Kikusui T, Ichihara N, Kato S, Kobayashi K, Sakagami M. Double Virus Vector Infection to the Prefrontal Network of the Macaque Brain. PLoS One. 2015;10:e0132825. doi: 10.1371/journal.pone.0132825. [DOI] [PMC free article] [PubMed] [Google Scholar]
- Padilla SL, Carmody JS, Zeltser LM. Pomc-expressing progenitors give rise to antagonistic neuronal populations in hypothalamic feeding circuits. Nat Med. 2010;16:403–405. doi: 10.1038/nm.2126. [DOI] [PMC free article] [PubMed] [Google Scholar]
- Price JC, Guan S, Burlingame A, Prusiner SB, Ghaemmaghami S. Analysis of proteome dynamics in the mouse brain. Proc Natl Acad Sci U S A. 2010;107:14508–14513. doi: 10.1073/pnas.1006551107. [DOI] [PMC free article] [PubMed] [Google Scholar]
- R Core Team. R: A Language and environment for statistical computing. Vienna, Austria: R Foundation for Statistical Computing; 2013. [Google Scholar]
- Ran FA, Cong L, Yan WX, Scott DA, Gootenberg JS, Kriz AJ, Zetsche B, Shalem O, Wu X, Makarova KS, et al. In vivo genome editing using Staphylococcus aureus Cas9. Nature. 2015;520:186–191. doi: 10.1038/nature14299. [DOI] [PMC free article] [PubMed] [Google Scholar]
- Sanz E, Yang L, Su T, Morris DR, McKnight GS, Amieux PS. Cell-type-specific isolation of ribosome-associated mRNA from complex tissues. Proc Natl Acad Sci U S A. 2009;106:13939–13944. doi: 10.1073/pnas.0907143106. [DOI] [PMC free article] [PubMed] [Google Scholar]
- Schmidt EF, Warner-Schmidt JL, Otopalik BG, Pickett SB, Greengard P, Heintz N. Identification of the cortical neurons that mediate antidepressant responses. Cell. 2012;149:1152–1163. doi: 10.1016/j.cell.2012.03.038. [DOI] [PMC free article] [PubMed] [Google Scholar]
- Schwarz LA, Miyamichi K, Gao XJ, Beier KT, Weissbourd B, DeLoach KE, Ren J, Ibanes S, Malenka RC, Kremer EJ, et al. Viral-genetic tracing of the input-output organization of a central noradrenaline circuit. Nature. 2015;524:88–92. doi: 10.1038/nature14600. [DOI] [PMC free article] [PubMed] [Google Scholar]
- Shigeoka T, Jung H, Jung J, Turner-Bridger B, Ohk J, Lin JQ, Amieux PS, Holt CE. Dynamic Axonal Translation in Developing and Mature Visual Circuits. Cell. 2016;166:181–192. doi: 10.1016/j.cell.2016.05.029. [DOI] [PMC free article] [PubMed] [Google Scholar]
- Shimada M, Tritos NA, Lowell BB, Flier JS, Maratos-Flier E. Mice lacking melanin-concentrating hormone are hypophagic and lean. Nature. 1998;396:670–674. doi: 10.1038/25341. [DOI] [PubMed] [Google Scholar]
- Shrestha P, Mousa A, Heintz N. Layer 2/3 pyramidal cells in the medial prefrontal cortex moderate stress induced depressive behaviors. eLife. 2015;4 doi: 10.7554/eLife.08752. [DOI] [PMC free article] [PubMed] [Google Scholar]
- Sorensen SA, Bernard A, Menon V, Royall JJ, Glattfelder KJ, Desta T, Hirokawa K, Mortrud M, Miller JA, Zeng H, et al. Correlated gene expression and target specificity demonstrate excitatory projection neuron diversity. Cereb Cortex. 2015;25:433–449. doi: 10.1093/cercor/bht243. [DOI] [PubMed] [Google Scholar]
- Stanley S, Domingos AI, Kelly L, Garfield A, Damanpour S, Heisler L, Friedman J. Profiling of Glucose-Sensing Neurons Reveals that GHRH Neurons Are Activated by Hypoglycemia. Cell metabolism. 2013;18:596–607. doi: 10.1016/j.cmet.2013.09.002. [DOI] [PubMed] [Google Scholar]
- Taniguchi H, He M, Wu P, Kim S, Paik R, Sugino K, Kvitsiani D, Fu Y, Lu J, Lin Y, et al. A resource of Cre driver lines for genetic targeting of GABAergic neurons in cerebral cortex. Neuron. 2011;71:995–1013. doi: 10.1016/j.neuron.2011.07.026. [DOI] [PMC free article] [PubMed] [Google Scholar]
- Tasic B, Menon V, Nguyen TN, Kim TK, Jarsky T, Yao Z, Levi B, Gray LT, Sorensen SA, Dolbeare T, et al. Adult mouse cortical cell taxonomy revealed by single cell transcriptomics. Nat Neurosci. 2016;19:335–346. doi: 10.1038/nn.4216. [DOI] [PMC free article] [PubMed] [Google Scholar]
- Witten IB, Steinberg EE, Lee SY, Davidson TJ, Zalocusky KA, Brodsky M, Yizhar O, Cho SL, Gong S, Ramakrishnan C, et al. Recombinase-driver rat lines: tools, techniques, and optogenetic application to dopamine-mediated reinforcement. Neuron. 2011;72:721–733. doi: 10.1016/j.neuron.2011.10.028. [DOI] [PMC free article] [PubMed] [Google Scholar]
- Xu X, Wells AB, O’Brien DR, Nehorai A, Dougherty JD. Cell type-specific expression analysis to identify putative cellular mechanisms for neurogenetic disorders. J Neurosci. 2014;34:1420–1431. doi: 10.1523/JNEUROSCI.4488-13.2014. [DOI] [PMC free article] [PubMed] [Google Scholar]
- Yoon BC, Jung H, Dwivedy A, O’Hare CM, Zivraj KH, Holt CE. Local translation of extranuclear lamin B promotes axon maintenance. Cell. 2012;148:752–764. doi: 10.1016/j.cell.2011.11.064. [DOI] [PMC free article] [PubMed] [Google Scholar]
- Zeisel A, Munoz-Manchado AB, Codeluppi S, Lonnerberg P, La Manno G, Jureus A, Marques S, Munguba H, He L, Betsholtz C, et al. Brain structure. Cell types in the mouse cortex and hippocampus revealed by single-cell RNA-seq. Science. 2015;347:1138–1142. doi: 10.1126/science.aaa1934. [DOI] [PubMed] [Google Scholar]
- Zhang Y, Chen K, Sloan SA, Bennett ML, Scholze AR, O’Keeffe S, Phatnani HP, Guarnieri P, Caneda C, Ruderisch N, et al. An RNA-sequencing transcriptome and splicing database of glia, neurons, and vascular cells of the cerebral cortex. J Neurosci. 2014;34:11929–11947. doi: 10.1523/JNEUROSCI.1860-14.2014. [DOI] [PMC free article] [PubMed] [Google Scholar]
- Zhou P, Zhang Y, Ma Q, Gu F, Day DS, He A, Zhou B, Li J, Stevens SM, Romo D, et al. Interrogating translational efficiency and lineage-specific transcriptomes using ribosome affinity purification. Proc Natl Acad Sci U S A. 2013;110:15395–15400. doi: 10.1073/pnas.1304124110. [DOI] [PMC free article] [PubMed] [Google Scholar]
Associated Data
This section collects any data citations, data availability statements, or supplementary materials included in this article.