

Abstract
Bisphenol A (BPA) exposure has been suspected to be associated with deleterious effects on health including obesity and metabolically-linked diseases. Although bisphenols F (BPF) and S (BPS) are BPA structural analogs commonly used in many marketed products as a replacement for BPA, only sparse toxicological data are available yet. Our objective was to comprehensively characterize bisphenols gene targets in a human primary adipocyte model, in order to determine whether they may induce cellular dysfunction, using chronic exposure at two concentrations: a “low-dose” similar to the dose usually encountered in human biological fluids and a higher dose. Therefore, BPA, BPF and BPS have been added at 10 nM or 10 μM during the differentiation of human primary adipocytes from subcutaneous fat of three non-diabetic Caucasian female patients. Gene expression (mRNA/lncRNA) arrays and microRNA arrays, have been used to assess coding and non-coding RNA changes. We detected significantly deregulated mRNA/lncRNA and miRNA at low and high doses. Enrichment in “cancer” and “organismal injury and abnormalities” related pathways was found in response to the three products. Some long intergenic non-coding RNAs and small nucleolar RNAs were differentially expressed suggesting that bisphenols may also activate multiple cellular processes and epigenetic modifications. The analysis of upstream regulators of deregulated genes highlighted hormones or hormone-like chemicals suggesting that BPS and BPF can be suspected to interfere, just like BPA, with hormonal regulation and have to be considered as endocrine disruptors. All these results suggest that as BPA, its substitutes BPS and BPF should be used with the same restrictions.
Introduction
A variety of chemicals has been found to disrupt the endocrine system of animal models, and chemical exposure has been associated with adverse developmental and reproductive effects in fish and other wildlife [1]. Especially, bisphenol A (BPA) exposure has been suspected to contribute to obesity and metabolic disorders [2].
BPA was industrially used to manufacture polycarbonate plastics and epoxy resins, which are used in baby bottles, toys and medical devices, as protective coatings on food containers, for composites and sealants in dentistry, as well as in carbonless thermal papers. The human population has a widespread exposure to BPA as it has been detected in 95% of the samples examined at concentrations ≥0.1 μg/L in urine [3],[4]. Associations were shown between BPA exposure and adverse perinatal, childhood, and adult health outcomes, including reproductive and developmental effects, metabolic disease, and other health effects [5]. High urinary BPA levels were found to be associated with obesity and type 2 diabetes (T2D) in several studies [6],[7],[8], but not all [9].
BPA has been banned from baby’s bottles in EU and more recently in France from any food and beverage containers. New potentially toxic substitutes are emerging: there has been a gradual shift towards the use of bisphenol analogs since manufacturers have begun to remove BPA from their products. Bisphenol S (BPS) and bisphenol F (BPF) are now commonly used as substitutes (S1 Fig). BPS is used for a variety of industrial applications, for example, as a wash fastening agent in cleaning products, an electroplating solvent, and a constituent of phenolic resin. BPS is also used as a developer in thermal paper. BPF is used to make epoxy resins and coatings, especially for systems needing increased thickness and durability such as tank and pipe linings, industrial floors, road and bridge deck toppings, structural adhesives, grouts and electrical varnishes [10]. BPF was also recently demonstrated to be present in mustard which suggested a human exposure to BPF by ingestion [11]. In urine samples collected in 2009–2012 from adults in the United States, BPA was detected at the highest frequency and median concentration (95%, 0.72 ng/mL), followed by BPS (78%, 0.13 ng/mL) and BPF (55%, 0.08 ng/mL) [12]. Human exposure to BPS and BPF is expected to increase due to regulations on BPA.
The effects of BPA on estrogen receptors (ERs) have been extensively studied. Nevertheless, the binding affinity of BPA for estrogen receptors ERα and ERβ is very low and it is now clear that BPA can and does bind multiple other targets within the nucleus and on the cell membrane [13]. Based on text mining data, more than 271 proteins were reported to have a role in different biochemical processes in which BPA has been involved [14]. In addition to estrogenic action, these proteins belong to diverse biochemical pathways and, in particular, can be related to T2D and obesity physiology. Since BPA can target multiple pathways, we hypothesized that bisphenol substitutes may have a similar behavior.
Our main objective, in this study, was to evaluate genome-wide gene expression responses to the exposition of BPA, BPS and BPF. Considering the impact of BPA on obesity [15], we aimed at determining how bisphenols could impair adipocyte physiology. In order to mimic chronic bisphenol exposure, we chose to incubate bisphenols at a physiologically relevant exposure dose, also known as a “low-dose “, i.e. 10 nM. Doses below 1 × 10⁻⁷ M for in vitro BPA effects are currently considered as “low dose” and are levels below the current lowest observed effect level (LOAEL) in traditional toxicological studies [16]. In the human, BPA is absorbed from the gastrointestinal tract quickly, conjugated with glucuronic acid in the liver, and BPA–glucuronide is rapidly filtered from the blood by the kidneys and excreted in urine [17]. Taking into account quick fluctuations of serum BPA concentrations due to time and dose exposures, 10 nM is a concentration described to be within the range of concentrations usually encountered for BPA in biological fluids in a general population [18]. A higher dose (10 μM), frequently used in literature despite poorly relevant to human exposure, was also assayed to detect potential dose-specific effects. In addition, we noted that non-monotonic dose-response relationships were demonstrated for bisphenol A [19], which dissuaded us from trying to get dose-response information and using a wider range of concentrations.
We therefore compared the effects of BPA, BPS and BPF added at 10 nM and at 10 μM in the differentiation medium of primary human pre-adipocytes, on different RNA levels. We used cell cultures derived from three different patients in order to avoid overestimating effects resulting from individual susceptibility and to focus on general mechanisms. In addition, our strategy allowed the study of the broad family of RNAs: mRNA, microRNAs (miRNAs) and other non-coding RNAs in order to determine a potential role of epigenetic mechanisms in bisphenols effects. A microRNA (miRNA) is a small non-coding RNA molecule (constituted of about 22 nucleotides) that plays a role in RNA silencing and post-transcriptional regulation of gene expression [20]. Small nucleolar RNAs (snoRNAs) are a class of small RNA molecules that primarily guide chemical modifications of other RNAs, mainly ribosomal RNAs, transfer RNAs and small nuclear RNAs or may have a role in the regulation of alternative splicing [21]. Long non-coding RNAs (lncRNA) are non-protein coding transcripts longer than 200 nucleotides. They play a role in the regulation of gene transcription and also control various aspects of post-transcriptional mRNA processing [22]. These different non-coding RNA classes are detected with our set of microarrays.
Using modern hypothesis-free genome-wide technologies may contribute to make significant progress in endocrine disruptor mechanistic knowledge and open the way to unsuspected responsive pathways of interest, either for basic science or for public health.
Materials and methods
Chemicals
BPA, BPS, and BPF from Sigma-Aldrich (Darmstadt, Germany; S1 Fig) were diluted in dimethyl sulfoxide (DMSO) and added to the adipocyte differentiation medium. They were used at two concentrations (10 nM and 10 μM) for the microarray experiment.
Adipocyte cell culture
Primary pre-adipocytes coming from subcutaneous fat of non-diabetic Caucasian female patients were used (Lonza, Basel, Switzerland). Pre-adipocytes are precursor cells that develop into adipocytes when fully differentiated. They were supplied with the differentiation kit and the culture medium. Primary human white subcutaneous pre-adipocytes were cultured in PBM-2 medium. Confluent pre-adipocytes were induced to differentiate with PBM-2 medium supplemented with insulin, dexamethasone, isobutylmethylxanthine and indomethacin (all supplied by Lonza) for ten days according to the instructions of the manufacturer. They were induced to differentiate into adipocytes with either the selected chemical or vehicle (DMSO; Fig 1). After ten days, cells were harvested for total RNA extraction.
Fig 1. Experimental design and analysis workflow.

BPA, BPS, BPF and DMSO: respectively Bisphenol A, S and F and dimethyl sulfoxide.
Nucleic acid extraction
Specific kits (Kit Small & Large RNA; Macherey Nagel) were used to extract all species of RNAs. The RNA concentration was determined by absorbance at 260 nm (A260), and the purity was estimated by determining the A260/A230 ratio with a Nanodrop spectrophotometer (Nanodrop Technologies, Wilmington, DE). RNA Integrity Number (RIN) was assessed with a Bioanalyzer (Agilent). This kit allowed the extraction of small and large RNAs with no degradation (RIN>9).
Microarrays
To measure different species of RNAs, the mRNA and lncRNA microarray SurePrint G3 Human V2 (Agilent Technologies) and miRNA microarray SurePrint G3 miRNA release 19.0 (Agilent Technologies) were used. The microarray experiments from Agilent Technologies were performed and analyzed by the Transcriptomics and Applied Genomics (TAG) team in the Institut Pasteur de Lille (Dr David Hot). This combination of microarrays allowed the detection of mRNAs, but also of long intergenic non-protein coding RNAs, small nucleolar RNAs and miRNAs.
Data normalization
Henceforth the term probe will be used to refer to a mRNA, lncRNA, snoRNA or miRNA probe. For mRNAs and other long non-coding RNAs, raw data were composed of 62,976 RNA expressions (probes). A first filter consisted in excluding non-expressed probes. To do so, a detection p-value, provided by Agilent which indicated how well the expressions of the gene were detected in a given sample, was used to filter out undetected probes. Probes, which were expressed in a certain proportion of the samples of interest, were kept for further analysis, leading to 28,244 probes (for the study of differentiation) and 22,935 probes (for the study of BPs on differentiation) in the final datasets. In addition, several normalization steps were applied, such as taking into account housekeeping genes or taking the log2 of the measures. The normalization was performed with the R package limma [23].
For miRNAs, raw data were composed of a total of 62,344 miRNA probes which represented 2,027 miRNAs (30 probes per miRNA + normalization probes). After a preliminary between-array normalization, the first step of the normalization consisted in estimating a summary measure of the miRNA expression using a linear model to take into account the probe affinity over the 30 probes characterizing each one of the miRNA. Secondly, as for the mRNA data, a detection p-value was used to filter out non-expressed miRNA leading to consider 325 (differentiation) or 483 probes (BPs) as expressed. The normalization was performed with the R package AgiMicroRna [24].
Statistical analyses
For each one of the product (BPA, BPF, BPS), 12 assays of cell cultures differentiated without any product (negative control, 4 per patient), 12 assays of cell cultures differentiated with 10 nM (2 per patient) or 10 μM of the given product (2 per patient) were compared. For each product, differentially expressed genes were identified with a mixed model, where the variations of a given probe were explained by a fixed effect of the 10 nM concentration and/or the 10 μM concentration in comparison with the control condition, plus the patients which were not of direct interest, were considered as a random effect. P-values were corrected for multiple testing using Benjamini and Hochberg’s method to control the false discovery rate with a 5% threshold. All the analyses were performed with the R package limma.
Biological analyses
Lists of genes significantly induced or repressed after exposure to BPA were uploaded into Ingenuity Pathway Analysis Software (IPA, Ingenuity Systems, www.ingenuity.com) for biological analysis by comparison with the Ingenuity Knowledge Database. These lists of altered genes were then processed to investigate the functional distribution of the genes, as defined by Gene Ontology. Datasets and known canonical pathway associations were measured by IPA by using a ratio of the number of genes from a dataset that map a specific pathway divided by the total number of genes which map this canonical pathway. Fisher's exact test was used to determine a p-value representing the significance of these associations.
Taqman RT-PCR
The relative quantification of mRNA was performed with a quantitative RT-PCR assay. 400 ng of total RNA was transcribed into cDNA using the cDNA Archive Kit (Life Technologies, Foster City, CA, USA). Each cDNA sample was analyzed by quantitative real-time PCR (qPCR) using the fluorescent TaqMan 5’-nuclease assays (Life Technologies). The analysis was performed with ViiA 7 detection system and software (Life Technologies). Gene expression was standardized to POLR2A expression (2-ΔCt).
miRNAs were reverse transcribed using TaqMan Micro RNA Reverse Transcription Kit (Life Technologies). Taqman microRNA assays (Life Technologies) were used for miRNA quantification.
Results
All microarray data results were deposited on Gene Expression Omnibus website, (http://www.ncbi.nlm.nih.gov/geo/) under the accession number GSE98682 which includes both series of mRNA/lncRNA data (GPL16699) and miRNA data (GPL19730). The samples series providing both the raw and normalized data is accessible through the accession numbers from GSM2609729 to GSM2609851.
Adipocyte differentiation: mRNA/lncRNA and miRNA expression
Pre-adipocytes coming from subcutaneous fat of three non-diabetic obese females of European origin were used (age: 37, 52 and 38 years old and BMI: 30.3, 39.5 and 32.9 respectively). After ten days of differentiation, as expected, an accumulation of refringent lipid droplets was observed in the cytoplasm of the adipocytes of all three patients, evidencing their ability to fully differentiate.
The heatmap representation of the gene expression in the pre-adipocyte and adipocyte demonstrates a clear-cut set of upregulated and downregulated probes (S2 Fig). Among up-regulated genes classical adipocyte differentiation markers are encountered (LPL, ADIPOQ, FABP4, PLIN4,…) which confirms the successful and complete differentiation of the pre-adipocytes.
For mRNA/lncRNA, 28,244 probes were detected in undifferentiated or differentiated adipocytes. Among these, 122 were significantly differentially up-regulated with a log2FC>3 and 275 with a log2FC>2; 23 were down-regulated with a log2FC<-3 and 114 with a log2FC<-2 in differentiated adipocytes compared to undifferentiated adipocytes (S1A Table).
For miRNA, 325 probes were detected in undifferentiated or differentiated adipocytes. Among these, 4 were significantly differentially up-regulated with a log2FC>2 and 36 with a log2FC>1 and 2 were down-regulated with a log2FC<-2 and 23 with a log2FC<-1 in differentiated adipocytes compared to undifferentiated adipocytes (S1B Table).
The analysis of probes differentially expressed with a log2FC>2 for each subject demonstrated that 56% of differentially expressed probes were shared by at least two patients and 36% by the three patients. (S3A Fig). We also performed principal component analysis (PCA) on all the probes which were detected as expressed. S3 Fig provides the sample representation of the PCA of the mRNA/lncRNA probes and the first two axes allowed us to clearly distinguish the three subjects (S3B Fig) and the differentiation stage (S3C Fig). Nevertheless, this disparity can be turned to our advantage to help us to decipher the shared differentially expressed probes relevant to a general mechanism and not to an individual susceptibility.
For miRNAs, the up or down-regulation during adipocyte differentiation observed was less obvious with lower fold changes and a very high variability between patients. With a log2FC>2, no miRNA probe was shared between the three patients (S4A Fig). Shared miRNA probes were detected only with a log2FC>1 (S4B Fig). Only 7% of probes unregulated with a log2FC>1 in the first patient were also up-regulated with a log2FC>1 in the other two patients and 42% of probes up-regulated with a log2FC>1 were down-regulated in at least one of the other two patients. In opposition to the PCA of the mRNA/lncRNA probes, the three patients and the differentiation stage could not be clearly distinguished using the first two principal components for the miRNA probes (S4C and S4D Fig).
On the mRNA/lncRNA microarray, the expression of a specific gene can be measured with several probes. The probes refereeing to the same gene were not aggregated, but analyzed separately since they might capture alternative splicing. Among the 20 most differentially expressed mRNA probes in differentiated adipocytes according to p-values, only up-regulated genes were found (S1A Table). Classical genes of adipocyte differentiation, such as LPL, PLIN1/4, ADIPOQ or FABP4 were found within this top list. For miRNA probes, the observed fold changes were lower along with less significant p-values. In contrast to mRNAs, both up and down-regulated miRNAs were found (S1B Table). Two long intergenic non-coding RNAs (LINC01140, LINC01088) were up-regulated in differentiated adipocytes and one (LINC01048) was down-regulated compared to pre-adipocytes (S1A Table).
Alteration of the global profiles by exposure to bisphenols
mRNA and lncRNA
After an exposition to 10 nM of BPA (or BPS or BPF) during adipocyte differentiation, using a mixed model, 846 probes coding for mRNA and lncRNA (respectively 1,173 and 216) were found to be significantly down-regulated and 417 (respectively 367 and 621) up-regulated when compared to the control cells without bisphenol (S2 Table). After the exposition to the higher dose of 10 μM of BPA (or BPS or BPF) during adipocyte differentiation, using a mixed model, 774 probes (respectively 748 and 1,228) were found to be significantly down-regulated and 1106 (respectively 323 and 989) up-regulated when compared to the control cells without bisphenol (S2 Table). Among the probes detected using mRNA/lncRNA arrays, some long intergenic non-coding RNAs and some small nucleolar RNAs were differentially expressed after exposition to the bisphenols during differentiation (S2 Table).
Considering all the deregulated probes, several of these deregulated probes were shared between concentrations (Table 1) and between bisphenols with the majority in the same direction (Table 2). For example, A_33_P3321657 tagging HSPG2 is in the top 20 of most differentially expressed probes and down-regulated for BPS and BPF at both concentrations.
Table 1. Numbers of differentially down and up-regulated (mRNA/lncRNA) probes amongst the 22,935 probes after the exposition of the pre-adipocytes to 10 nM or 10 μM of bisphenol shared between the concentrations for each bisphenol.
| 10 nM | shared | 10 μM | ||
|---|---|---|---|---|
| BPA | up | 846 | 211 | 774 |
| down | 417 | 126 | 1,106 | |
| BPS | up | 1,173 | 387 | 748 |
| down | 367 | 60 | 323 | |
| BPF | up | 216 | 46 | 1,228 |
| down | 621 | 133 | 989 |
Table 2. Number of differentially down and up-regulated (mRNA/lncRNA) probes amongst the 22,935 probes after the exposition of the pre-adipocytes to 10 nM or 10 μM of bisphenol (A, F and S) during differentiation shared between BPA and BPS or BPF.
| BPS 10 nM | BPF 10 nM | ||||
| 1,173 down | 367 up | 216 down | 621 up | ||
| BPA 10nM | 846 down | 524 | 0 | 43 | 4 |
| 417 up | 0 | 65 | 0 | 77 | |
| BPS 10 μM | BPF 10 μM | ||||
| 748 down | 323 up | 1,228 down | 989 up | ||
| BPA 10μM | 774 down | 260 | 2 | 226 | 1 |
| 1,106 up | 3 | 110 | 8 | 223 | |
To complement the previous results, we represented the global expression profiles of the significantly differentially expressed genes according to the three bisphenols in a heatmap (Fig 2). What is sticking is the great homogeneity within the profiles. Indeed when a gene is over or underexpressed in one concentration of a bisphenol, it tends to have a similar response to the others, both in terms of direction and magnitude of effect. It is worth noting that BPF at 10 nM seems to behave slightly differently and shows an overall reduced magnitude of effect, which might suggest that a higher dose of BPF is required to have a similar effect as BPA and S in terms of expression profile.
Fig 2. Heatmap representation of significantly differentially expressed genes in the three bisphenols at 10 nM and 10 μM.
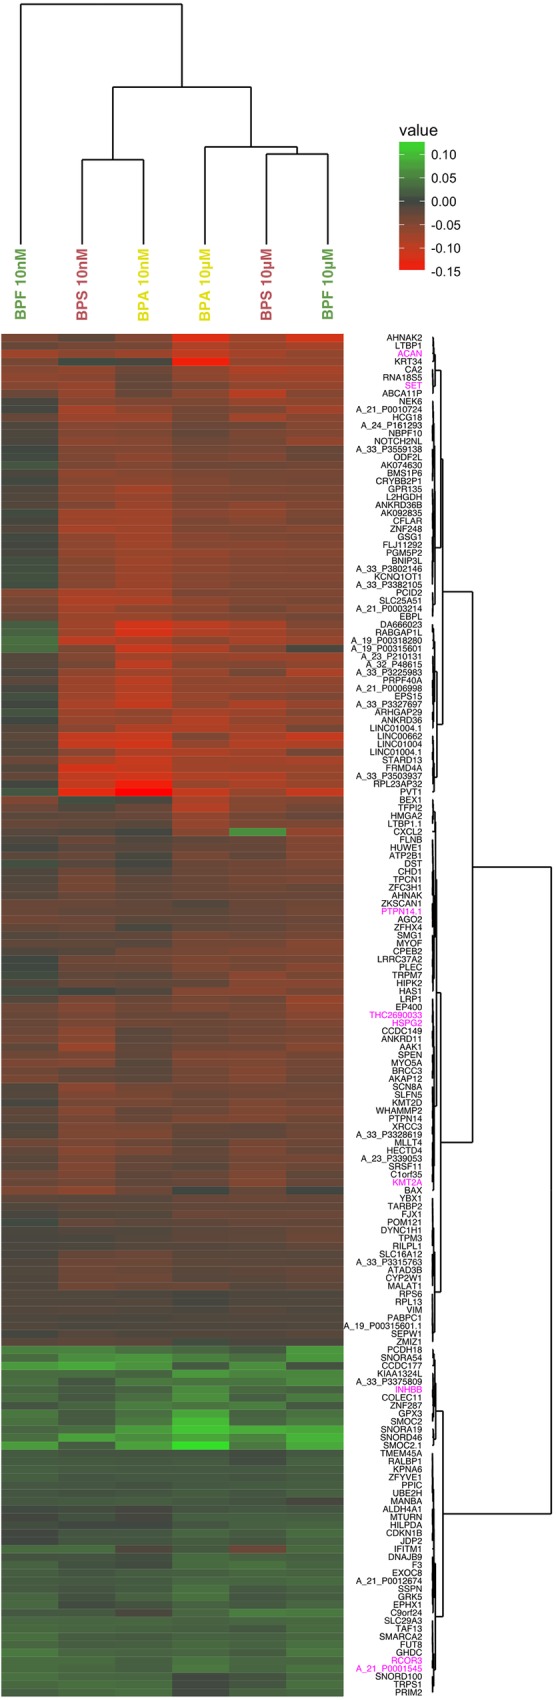
The represented values are log2 fold changes of the ratio of the expression in a given bisphenol and concentration over the control condition which is differentiated without any bisphenol. Genes (probes) highlighted in pink are significant for all concentrations of all bisphenols.
miRNA
After an exposition to 10 nM of BPA (or BPS or BPF) during adipocyte differentiation, 39 probes coding for miRNA (respectively 61 and 0) were found to be significantly down-regulated and 33 (respectively 40 and 12) up-regulated when compared to the control cells without bisphenol (S2 Table). After the exposition to the higher dose of 10 μM of BPA (or BPS or BPF) during adipocyte differentiation, 18 probes (respectively 11 and 50) were found to be significantly down-regulated and 13 (respectively 8 and 48) up-regulated when compared to the control cells without bisphenol (S2 Table).
miRNA probes shared between concentrations and between bisphenols are displayed in Table 3 and Table 4. As for mRNA, shared probes are dysregulated in the same direction. The most significant fold-changes values for miRNA are higher than fold changes observed for mRNA/lncRNA.
Table 3. Numbers of differentially down and up-regulated miRNA probes amongst the 483 probes after the exposition of the pre-adipocytes to 10 nM or 10 μM of bisphenol shared between the concentrations for each bisphenol.
| 10 nM | shared | 10 μM | ||
|---|---|---|---|---|
| BPA | up | 39 | 2 | 18 |
| down | 33 | 0 | 13 | |
| BPS | up | 61 | 3 | 11 |
| down | 40 | 3 | 8 | |
| BPF | up | 0 | 0 | 50 |
| down | 12 | 4 | 48 |
Table 4. Number of differentially down and up-regulated miRNA probes amongst the 483 probes after the exposition of the pre-adipocytes to 10 nM or 10 μM of bisphenol (A, F and S) during differentiation shared between BPA and BPS or BPF.
| BPS 10 nM | BPF 10 nM | ||||
| 61 down | 40 up | 0 down | 12 up | ||
| BPA 10nM | 39 down | 32 | 0 | 0 | 0 |
| 33 up | 0 | 26 | 0 | 0 | |
| BPS 10 μM | BPF 10 μM | ||||
| 11 down | 8 up | 50 down | 48 up | ||
| BPA 10μM | 18 down | 7 | 0 | 3 | 0 |
| 13 up | 0 | 5 | 0 | 2 | |
In addition, we represented the global expression profiles of the significantly differentially expressed miRNAs according to the three bisphenols in a heatmap (Fig 3). We observed, just like for mRNAs/lncRNAs, an overall homogeneity within the expression profiles, although we clearly see a separation in the clustering. As previously stated for the mRNAs/lncRNAs, BPF at 10 nM shows an overall reduced expression and the response to BPF at 10 μM is extremely similar to the response to BPA and S at 10nM.
Fig 3. Heatmap representation of significantly differentially miRNA in the three bisphenols at 10 nM and 10 μM.

The represented values are log2 fold changes of the ratio of the expression in a given bisphenol and concentration over the control condition which is differentiated without any bisphenol.
Analysis of biological functions
Similarities between the alterations of the profile were assessed using Ingenuity Pathway Analysis software. The mRNA differentially expressed in response to 10 nM and 10 μM exposure of all three bisphenols (BPs) were analyzed: top canonical associated pathways, upstream regulators as well as related diseases and disorders are displayed in Table 5. We found shared enriched pathways for all three BPs. For instance, eIF2 signaling was among the top canonical pathways both for BPA and BPF; ESR1, MYCN or MYC were found as upstream regulators; and “cancer” as well as “organismal injury and abnormalities” were shared between the three products. The same analysis performed on the lists of differentially expressed mRNA probes of all three bisphenols (BPs) for the two concentrations gave similar results, suggesting general dose-independent mechanisms.
Table 5. Enrichment analysis using Ingenuity Pathway Analysis on the lists of mRNA probes differentially expressed after exposition to the three bisphenols A, F and S at 10 nM and 10 μM.
| 10nM BPA | 10nM BPS | 10nM BPF | |||||
| Name | p-value | Name | p-value | Name | p-value | ||
| Top canonical pathway | EIF2 Signaling | 1.40E-03 | Mouse Embryonic Stem Cell Pluripotency | 8.50E-05 | EIF2 Signaling | 1.05E-03 | |
| NAD Biosynthesis III | 1.54E-02 | Leptin Signaling in Obesity | 1.05E-04 | Acute Phase Response Signaling | 1.31E-03 | ||
| Aspartate Degradation II | 2.11E-02 | Role of NFAT in Cardiac Hypertrophy | 1.65E-04 | Inhibition of Matrix Metalloproteases | 1.53E-03 | ||
| Sorbitol Degradation I | 3.35E-02 | Human Embryonic Stem Cell Pluripotency | 3.42E-04 | Interferon Signaling | 5.91E-03 | ||
| Netrin Signaling | 4.08E-02 | PPAR/RXR Activation | 1.05E-03 | Heme Degradation | 6.09E-03 | ||
| Top Upstream Regulators | MYCN | 1.19E-04 | HNF4A | 2.76E-06 | TP53 | 1.14E-07 | |
| miR-124-3p (and miRNAs w/seed AAGGCAC) | 9.46E-04 | ESR1 | 1.86E-05 | MYC | 1.31E-06 | ||
| FAAH | 1.71E-03 | OSM | 3.21E-05 | HRAS | 2.04E-06 | ||
| TP53 | 1.93E-03 | P4HB | 7.74E-05 | TGFB1 | 3.63E-06 | ||
| phosphate | 2.42E-03 | MYCN | 1.40E-04 | ESR1 | 4.69E-06 | ||
| Diseases and Disorders | Cancer | 3.35E-02–3.56E-12 | Cancer | 1.14E-02–7.03E-14 | Cancer | 5.75E-03–4.62E-09 | |
| Organismal Injury and Abnormalities | 3.35E-02–3.56E-12 | Gastrointestinal Disease | 1.14E-02–7.03E-14 | Organismal Injury and Abnormalities | 6.08E-03–4.62E-09 | ||
| Gastrointestinal Disease | 3.35E-02–8.11E-09 | Hepatic System Disease | 1.10E-02–7.03E-14 | Infectious Diseases | 6.04E-03–1.56E-08 | ||
| Hepatic System Disease | 1.80E-02–8.11E-09 | Organismal Injury and Abnormalities | 1.14E-02–7.03E-14 | Gastrointestinal Disease | 6.06E-03–4.27E-08 | ||
| Reproductive System Disease | 3.35E-02–1.41E-07 | Renal and Urological Disease | 1.04E-03–3.70E-09 | Reproductive System Disease | 4.51E-03–1.09E-05 | ||
| 10μM BPA | 10μM BPS | 10μM BPF | |||||
| Name | p-value | Name | p-value | Name | p-value | ||
| Top canonical pathway | Axonal Guidance Signaling | 8.60E-06 | Molecular Mechanisms of Cancer | 1.09E-03 | Death Receptor Signaling | 3.16E-04 | |
| Remodeling of Epithelial Adherens Junctions | 1.07E-04 | Aryl Hydrocarbon Receptor Signaling | 3.66E-03 | phagosome maturation | 1.08E-03 | ||
| Molecular Mechanisms of Cancer | 2.66E-04 | Glucocorticoid Receptor Signaling | 3.72E-03 | Mitochondrial Dysfunction | 1.49E-03 | ||
| Sertoli Cell-Sertoli Cell Junction Signaling | 5.92E-04 | Hepatic Fibrosis / Hepatic Stellate Cell Activation | 4.97E-03 | tRNA Charging | 1.63E-03 | ||
| Acute Phase Response Signaling | 6.69E-04 | Cell Cycle: G2/M DNA Damage Checkpoint Regulation | 6.85E-03 | Oxidative Phosphorylation | 2.27E-03 | ||
| Top Upstream Regulators | beta-estradiol | 6.69E-13 | ESR1 | 1.14E-10 | TP53 | 2.10E-09 | |
| Vegf | 8.05E-13 | PDGF BB | 3.41E-10 | IND S1 | 5.50E-08 | ||
| TGFB1 | 9.82E-13 | TP53 | 7.02E-10 | IND S7 | 1.17E-07 | ||
| dexamethasone | 1.14E-11 | tretinoin | 1.47E-09 | CD 437 | 1.61E-07 | ||
| TNF | 1.38E-11 | dexamethasone | 3.13E-09 | MEL S3 | 1.86E-07 | ||
| Diseases and Disorders | Cancer | 8.16E-04–8.06E-22 | Cancer | 1.01E-03–7.01E-19 | Cancer | 6.27E-03–1.40E-15 | |
| Organismal Injury and Abnormalities | 8.16E-04–8.06E-22 | Organismal Injury and Abnormalities | 1.01E-03–7.01E-19 | Organismal Injury and Abnormalities | 6.27E-03–1.40E-15 | ||
| Gastrointestinal Disease | 7.98E-04–1.15E-16 | Gastrointestinal Disease | 9.91E-04–9.85E-17 | Gastrointestinal Disease | 6.27E-03–5.35E-13 | ||
| Reproductive System Disease | 7.25E-04–2.29E-16 | Reproductive System Disease | 7.69E-04–9.39E-15 | Reproductive System Disease | 6.00E-03–7.57E-12 | ||
| Endocrine System Disorders | 6.47E-04–1.67E-10 | Hepatic System Disease | 2.97E-04–2.42E-14 | Infectious Diseases | 5.45E-03–5.58E-09 | ||
For each bisphenol, the five most significantly enriched canonical pathways, top upstream regulators as well as diseases and disorders are displayed with the corresponding p-values. The enrichment is based on the comparison between the number of dysregulated gene involved in a given function in the dataset compared to the number expected by chance. The displayed range of p-values corresponds to the range of p-values encountered for the different annotations in this category.
Probes shared by the three bisphenols
The selection of the probes differentially expressed at a concentration of 10 nM for all three BPs led to highlight 40 (37) mRNA probes (genes), but no miRNA. Among these 40 probes, 16 were up-regulated and 24 were down-regulated (Table 6). Cytoskeleton and ribosomal proteins were found within this set of genes suggesting that crucial mechanisms of cell regulation and of protein traduction could be disrupted in presence of low dose bisphenols. The selection of the probes differentially expressed at a concentration of 10 μM for all three BPs led to highlight 161 (134) mRNA probes (genes), and only one miRNA (hsa-miR-4655-3p). Among these 161 probes, 33 were up-regulated and 128 were down-regulated (S3 Table). If only the probes differentially expressed in both concentrations of all three BPs were selected, we highlighted 12 (10) mRNA probes (genes). Among these ten genes, two were up-regulated and eight were down-regulated; they are highlighted with a grey background in Table 6 (10 nM) and with yellow filling in S3 Table (10 μM). From our analyses, only one miRNA (hsa mir-4655-3p) was differentially expressed in all three BPs, but only at a high concentration of 10 μM for BPA and at both concentrations for BPS and BPF.
Table 6. List of differentially expressed probes deregulated for the three bisphenols A, F and S at 10 nM.
| BPA | BPS | BPF | ||||||
|---|---|---|---|---|---|---|---|---|
| ProbeName | GeneName | Entrez Gene Name | log2FC | P-value | log2FC | P-value | log2FC | P-value |
| A_23_P44139 | PRIM2 | primase (DNA) subunit 2 | 0.216 | 4.81E-05 | 0.189 | 3.78E-04 | 0.131 | 8.26E-03 |
| A_33_P3280044 | ANKRD11 | ankyrin repeat domain 11 | -0.227 | 7.52E-05 | -0.326 | 5.10E-07 | -0.264 | 7.51E-04 |
| A_19_P00315601 | XLOC_014512 | -0.687 | 8.34E-05 | -0.292 | 6.91E-04 | 0.224 | 1.39E-02 | |
| A_24_P232790 | CCDC177 | coiled-coil domain containing 177 | 0.445 | 2.81E-04 | 0.567 | 3.16E-04 | 0.482 | 1.33E-03 |
| A_23_P307310 | ACAN | aggrecan | -0.488 | 3.01E-04 | -0.4 | 6.10E-04 | -0.508 | 7.26E-04 |
| A_33_P3321657 | HSPG2 | heparan sulfate proteoglycan 2 | -0.367 | 4.39E-04 | -0.441 | 3.23E-08 | -0.293 | 7.05E-05 |
| A_23_P90143 | RPL13A | ribosomal protein L13a | -0.165 | 4.52E-04 | -0.156 | 9.83E-04 | -0.133 | 5.30E-03 |
| A_33_P3278407 | AFDN | afadin, adherens junction formation factor | -0.189 | 5.40E-04 | -0.249 | 3.09E-05 | -0.196 | 1.40E-03 |
| A_21_P0014132 | THC2690033 | -0.177 | 5.68E-04 | -0.241 | 1.60E-05 | -0.171 | 5.33E-04 | |
| A_24_P148235 | RPS27 | ribosomal protein S27 | -0.134 | 7.61E-04 | -0.115 | 4.68E-03 | -0.137 | 4.14E-03 |
| A_21_P0013977 | PCID2 | PCI domain containing 2 | -0.395 | 8.31E-04 | -0.429 | 1.07E-03 | -0.273 | 9.76E-03 |
| A_23_P208706 | BAX | BCL2 associated X, apoptosis regulator | -0.257 | 8.38E-04 | -0.467 | 5.43E-04 | -0.359 | 5.66E-03 |
| A_23_P258698 | MANBA | mannosidase beta | 0.149 | 9.52E-04 | 0.135 | 5.83E-04 | 0.111 | 1.03E-02 |
| A_19_P00323413 | PTPN14 | protein tyrosine phosphatase, non-receptor type 14 | -0.159 | 9.97E-04 | -0.156 | 3.87E-03 | -0.192 | 2.26E-03 |
| A_23_P153964 | INHBB | inhibin beta B subunit | 0.196 | 1.48E-03 | 0.136 | 1.25E-02 | 0.206 | 3.90E-03 |
| A_23_P376599 | RALBP1 | ralA binding protein 1 | 0.127 | 1.65E-03 | 0.143 | 9.60E-04 | 0.155 | 1.01E-03 |
| A_24_P142228 | RPL13 | ribosomal protein L13 | -0.161 | 2.07E-03 | -0.14 | 5.52E-03 | -0.137 | 4.01E-03 |
| A_23_P69521 | CCNI | cyclin I | -0.127 | 2.14E-03 | -0.132 | 9.97E-04 | -0.113 | 9.58E-03 |
| A_33_P3361746 | TRPS1 | transcriptional repressor GATA binding 1 | 0.182 | 2.18E-03 | 0.195 | 3.70E-03 | 0.168 | 1.19E-02 |
| A_23_P128956 | ZFYVE1 | zinc finger FYVE-type containing 1 | 0.11 | 3.24E-03 | 0.099 | 1.72E-02 | 0.152 | 2.38E-03 |
| A_23_P214666 | RPS18 | ribosomal protein S18 | -0.174 | 3.35E-03 | -0.144 | 1.74E-02 | -0.145 | 1.66E-02 |
| A_33_P3390570 | KMT2A | lysine methyltransferase 2A | -0.155 | 4.17E-03 | -0.253 | 2.03E-05 | -0.199 | 5.33E-04 |
| A_33_P3344831 | TMEM45A | transmembrane protein 45A | 0.128 | 5.00E-03 | 0.128 | 8.13E-03 | 0.183 | 4.77E-04 |
| A_23_P35148 | TAF13 | TATA-box binding protein associated factor 13 | 0.179 | 5.16E-03 | 0.2 | 6.81E-03 | 0.225 | 9.50E-04 |
| A_23_P217015 | SET | SET nuclear proto-oncogene | -0.175 | 5.19E-03 | -0.439 | 7.38E-09 | -0.35 | 2.28E-03 |
| A_23_P77103 | SORD | sorbitol dehydrogenase | -0.184 | 5.22E-03 | -0.174 | 7.63E-04 | -0.18 | 2.69E-03 |
| A_21_P0001545 | LOC149351 | 0.13 | 6.60E-03 | 0.181 | 2.69E-03 | 0.201 | 2.13E-03 | |
| A_23_P207387 | GHDC | GH3 domain containing | 0.139 | 7.08E-03 | 0.151 | 1.13E-02 | 0.241 | 7.23E-04 |
| A_19_P00317052 | RNF213 | ring finger protein 213 | -0.183 | 7.40E-03 | -0.164 | 1.59E-02 | -0.164 | 1.89E-02 |
| A_23_P46871 | SLC29A3 | solute carrier family 29 member 3 | 0.158 | 7.57E-03 | 0.149 | 1.17E-02 | 0.157 | 1.40E-02 |
| A_21_P0000240 | SNORD100 | small nucleolar RNA, C/D box 100 | 0.138 | 8.18E-03 | 0.142 | 1.61E-02 | 0.189 | 1.14E-02 |
| A_23_P138435 | ZMIZ1 | zinc finger MIZ-type containing 1 | -0.126 | 1.04E-02 | -0.153 | 1.65E-03 | -0.125 | 1.66E-02 |
| A_33_P3234667 | ZKSCAN1 | zinc finger with KRAB and SCAN domains 1 | -0.152 | 1.07E-02 | -0.184 | 1.08E-03 | -0.185 | 7.75E-03 |
| A_24_P276816 | RCOR3 | REST corepressor 3 | 0.119 | 1.07E-02 | 0.174 | 1.42E-03 | 0.174 | 2.27E-03 |
| A_33_P3225760 | PCDH18 | protocadherin 18 | 0.2 | 1.08E-02 | 0.285 | 4.89E-04 | 0.278 | 5.24E-04 |
| A_33_P3210278 | SYNE2 | spectrin repeat containing nuclear envelope protein 2 | -0.196 | 1.17E-02 | -0.175 | 1.16E-02 | -0.166 | 1.14E-02 |
| A_23_P123563 | RPS6 | ribosomal protein S6 | -0.101 | 1.18E-02 | -0.131 | 2.09E-03 | -0.143 | 1.80E-03 |
| A_23_P501822 | JUP | junction plakoglobin | -0.154 | 1.31E-02 | -0.233 | 4.65E-03 | -0.26 | 1.36E-03 |
| A_24_P128563 | KPNA6 | karyopherin subunit alpha 6 | 0.105 | 1.64E-02 | 0.118 | 1.14E-02 | 0.137 | 3.65E-03 |
| A_23_P161190 | VIM | vimentin | -0.131 | 1.68E-02 | -0.179 | 7.25E-03 | -0.151 | 6.93E-03 |
Fold changes (FC) are actually log2 transformed fold changes, therefore if a FC is positive (in bold) the probe is over-expressed in the tested condition compared to the control, whereas it is under-expressed when a FC is negative. Probes differentially expressed for both concentrations (10 nM and 10 μM) are displayed with a grey background.
In addition, we searched with IPA for potential upstream regulators of the latter set of ten genes differentiated for the three bisphenols at both concentrations (Table 7). Among the upstream regulators, beta-estradiol and ESR1 already known to be targeted by BPA were found as potential targets for all three BPs.
Table 7. Upstream regulators provided by Ingenuity Pathway Analysis in the 10 genes differentially expressed at both concentrations (10 nM and 10 μM) for the three bisphenols (A, F and S).
| Upstream Regulator | Molecule Type | P-value of overlap | Target molecules in dataset |
|---|---|---|---|
| beta-estradiol | chemical—endogenous mammalian | 4.82E-03 | CCNI,INHBB,SET,SORD |
| APP | other | 4.98E-03 | HSPG2,KMT2A,SET |
| ESR1 | ligand-dependent nuclear receptor | 1.51E-02 | CCNI,INHBB,SORD |
| Vegf | group | 1.02E-03 | ACAN,INHBB,KMT2A |
| TGFB1 | growth factor | 2.87E-02 | ACAN,HSPG2,INHBB |
| PAX3 | transcription regulator | 3.10E-03 | HSPG2,PTPN14 |
| AGT | growth factor | 1.45E-02 | HSPG2,INHBB |
| GDF9 | growth factor | 1.11E-04 | HSPG2,INHBB |
| dihydrotestosterone | chemical—endogenous mammalian | 2.09E-02 | CCNI,INHBB |
| LY294002 | chemical—kinase inhibitor | 1.83E-02 | ACAN,INHBB |
| IL1B | cytokine | 4.99E-02 | ACAN,HSPG2 |
In order to validate the microarray data by quantitative PCR, we first screened classical housekeeping gene expressions. POLR2A (Polymerase (RNA) II Subunit A) demonstrated no significant differential expression for the three bisphenols at both doses and was chosen as housekeeping gene (S4 Table). Taqman qPCR analysis was performed using “best coverage” probes recommended by the manufacturer (S5 Table).
The direction and values of the expression fold-changes obtained by qPCR were consistent with the data from the microarray analysis for eight of the ten genes studied (S6 Table). SET and SORD showed an up-regulation when analyzed by Taqman qPCR which is opposite to the microarray data. In the microarray analysis, only one probe among three annotated for SET and SORD was differentially expressed therefore different transcripts were evaluated by microarray probes or by qPCR probes: this explains the observed discrepancies. Without SET and SORD probes, the correlation coefficient obtained by Spearman analysis was r = 0.708 (p = 2.56 x 10⁻⁸) in expression between the data from the microarray analysis and from Taqman qPCR (S6 Table). mir-4655-3p expression analyzed by Taqman was very low and was only detectable above the threshold of 35 cycles.
We integrated data from the Comparative ToxicoGenomics Database (CTD, http://ctdbase.org/) which tells us if BPA has already been shown to modulate the expression of a given gene. CTD provides manually curated information about chemical–gene/protein interactions, coming from published microarray data. BPA is highly represented but no association has been curated for BPS and BPF yet. Among the 40 probes deregulated for the three bisphenols at 10 nM, all the probes, with the exception of the probes SNORD100 and ANKRD11, were found to interact with BPA in this database.
Discussion
We have intended here to make progress in toxicology analyses of common chemicals present in the human environment, by the use of human primary cells chronically exposed to these chemicals, at a concentration similar to the range found in human fluids in many studies [18], with a hypothesis-free genomic approach analyzing both coding and non-coding RNA levels. We considered this unbiased strategy important to analyze the differential effects of BPA and of its substitutes, BPS and BPF, on human cellular genomic profiles.
We first validated the use of primary cell cultures derived from three different patients. Indeed, mRNA/lncRNA expression induced by pre-adipocyte differentiation was very consistent between subjects. Despite some expected variability, we were indeed able to highlight classical markers of differentiation (LPL, FABP4, ADIPOQ, PLIN1/4 …) demonstrating both the achievement of differentiation of the cells and the validity of our design. Concerning the miRNA study, we showed that the miRNA profile for adipocyte differentiation is very heterogeneous between individuals. Nevertheless, among the top probes (according to p-values) differentially expressed during pre-adipocyte differentiation, some are consistent with existing literature. miR-26a, which was down-regulated in our study, induces characteristics of brown adipocytes during human adipocyte differentiation [25]. miR-30c up-regulated in our study, was shown to promote human adipocyte differentiation [26]. miR-136, down-regulated in our study, was up-regulated during chondrogenesis of human adipose-derived stem cells suggesting that it can be considered as a player in the switch from white adipocyte to chondrocyte [27].
More importantly, these three cell cultures were sufficient to detect significantly differentially expressed RNA species in response to bisphenols, demonstrating an effect of bisphenols even at “low doses” on cellular metabolism. We showed here that both BPA and its substitutes BPS and BPF, induced a dysregulation of major regulators in cell homoeostasis, which is illustrated by highlighting cancer and translation pathways, whatever the concentration used. Among the mRNA/lncRNA differentially expressed probes for BPA, 46% were shared with BPS and only 10% with BPF. For miRNA probes, 80% were shared between BPA and BPS while none were shared between BPA and BPF. Interestingly, among the mRNA/lncRNA differentially expressed probes for BPA at 10 nM, 46% were shared with probes differentially expressed for BPF, when BPF was used at 10 μM. These results suggest that BPS effect is closer than BPF to BPA effect and that a higher concentration of BPF could be required for an effect on the same probes. Nevertheless, when focusing on the probes deregulated for the three bisphenols, we highlighted extracellular matrix and cytoskeleton genes, transcription regulators, cyclins: all genes implied in cell metabolism regulation. In addition, the analysis of upstream regulators of the set of ten genes differentiated for the three bisphenols at both concentrations highlighted hormones or hormone-like chemicals (beta-estradiol, dihydrosterone) as well as ESR1 (estrogen receptor 1). This suggests that BPS and BPF, can be suspected to interfere, just like BPA, with hormonal regulation, and therefore deserve to undergo the same restrictions from a regulation standpoint.
In this regard, we highlighted an impairment of basic pathways of cell metabolism by bisphenols, such as eIF2 (Eukaryotic Initiation Factor 2) signaling; eIF2 is a eukaryotic initiation factor required in the initiation of translation. Moreover, among the more represented disease categories, corresponding to differentially expressed species, we found “cancer” and “organismal injuries and abnormalities”. It is worth noting that these oncogenic features cannot be attributed to the cellular model since we have used primary cells. Surprisingly, in our conditions, neither adipogenesis nor inflammation probes were overrepresented as it was observed in other cellular adipocyte models [28] [29]. BPA was demonstrated to significantly enhanced adipogenesis via an ER-mediated pathway [29]. BPA has been first considered a weak estrogen, based on its low binding affinity to the nuclear estrogen receptors, however there is also evidence of a potent BPA-estrogenic action through non-classical estrogen pathways e.g. via ERalpha located outside the nucleus [30]. In beta cells 1 nM BPA regulates insulin gene transcription via ERalpha in an estrogen response element independent manner [31]. Extranuclearly located ERbeta mediates rapid actions of BPA (1 nM) as well [32]. The analysis of upstream regulators of the set of ten genes differentiated for the three bisphenols at both concentrations highlighted ESR1 (estrogen receptor 1 or ERalpha). Therefore, our results suggest that BPA, and its substitutes BPS and BPF, are potent estrogens acting at nanomolar concentrations via ERalpha. Further studies are required to determine whether this could occur through the activation of ER-extranuclear signaling pathways, as demonstrated in other models [33].
The originality of our study resides in the origin of our cells: widely used 3T3-L1 [28] [34] are murine pre-adipocytes, in addition many studies have demonstrated an effect only in a micromolar range [35] [36]. More importantly, the differentiation stage is very crucial: in a recent study from Boucher et al. [37], it was nicely demonstrated that 10 nM BPS induces a significant increase of 1.6-fold in PPAR-gamma expression at day 4 in primary human pre-adipocytes, but this over-expression was no longer detectable at day 10. In addition, in this study from Boucher et al., other adipogenic markers such as FABP4, LPL, PLIN were significantly increased only by the use of a 25 μM concentration of BPS.
It is worth mentioning that some long intergenic non-coding RNAs and some small nucleolar RNAs were differentially expressed after the exposition to the bisphenols during differentiation. To our knowledge, there is few data reporting the induction of long intergenic non-coding RNAs or small nucleolar RNAs by any bisphenol. The long non-coding RNA HOTAIR was induced in breast cancer cells by BPA [38]. Fifteen small nucleolar RNAs with C/D motif (SNORD) were shown to be reduced in cultures of primary prostate epithelial cells treated with BPA [39]. SNORD are noncoding, small nucleolar RNAs known to regulate ribosomal RNA assembly and function, suggesting that bisphenol A and its substitutes may also act through epigenetic modifications, as already reported [40].
Interestingly, two references were frequently found along comparison of our data with the Comparative ToxicoGenomics Database. The first one is from Ali et al. [41] and describes a microarray experiment on a rat seminiferous tubule culture model exposed for several days with low dose bisphenol A (1 nM and 10 nM) and intersects 31 of our 40 probes. The culture conditions are very similar to ours and it is striking that in a different model undergoing DNA reprogramming such as meiosis, the same genes can be affected by BPA. The second reference was found for 8 of our 40 probes, and describes the ovarian transcriptome of two fish species exposed to BPA [42].
Among the genes identified by this study as bisphenol targets, inhibin beta B subunit (INHBB) has drawn our attention because it has already been described as a target of estrogens [43]. The beta B subunit forms a homodimer activin B, and in combination with the beta A subunit forms a heterodimer activin AB, both of which stimulate FSH secretion [44]. INHBB produced in adipocytes may play a role in the metabolic syndrome, since it was demonstrated that its expression is high in human adipocytes, reduced by weight loss, and correlates with factors implicated in metabolic disease [45]. In addition, INHBB was shown to inhibit lipolysis in adipocytes [46] and decrease thermogenesis in primary cultures of mouse white adipocytes [47]. Considering that INHBB may be used as a marker of spermatogenesis function and male infertility [48], our results strengthen the need of regulations that guarantee a high level of protection of human health.
In conclusion, our results suggest that human primary adipocytes undergoing chronic exposure to BPA or its substitutes BPS and BPF, during differentiation, present deleterious effects on their transcriptome even at a “low” dose (e.g. frequently encountered in a general population). The upstream regulators of the deregulated genes belong to hormonal chemicals and the most highlighted pathways are related to oncogenesis. We noticed an interaction with different families of non-coding RNAs (miRNA, long non-coding and small nucleolar RNAs) suggesting an effect of the three bisphenols on the regulation of gene transcription and also with various aspects of post-transcriptional mRNA processing. Altogether these data suggest that more caution should be taken for the use of BPA and its so-called “substitutes” as previously unsuspected impaired cellular event could be initiated even at a low dose.
Supporting information
(TIF)
The difference between the average expression in the pre-adipocyte and the adipocyte with the global expression is represented.
(TIF)
A) Venn diagram of differentially expressed probes for each patient before and after ten days of differentiation, a probe is considered as differentially expressed if log2FC>2. B) Individual representation of the first two axes of the principal component analysis on all probes for each patient before and after ten days of differentiation (colored according to patient). C) Individual representation of the first two axes of the principal component analysis on all probes for each patient before and after ten days of differentiation (colored according to differentiation stage).
(TIF)
A) Venn diagram of differentially expressed probes for each patient before and after ten days of differentiation, a probe is considered as differentially expressed if log2FC>2. B) Venn diagram of differentially expressed probes for each patient before and after ten days of differentiation, a probe is considered as differentially expressed if log2FC>1. C) Individual representation of the first two axes of the principal component analysis on all probes for each patient before and after ten days of differentiation (colored according to patient). D) Individual representation of the first two axes of the principal component analysis on all probes for each patient before and after ten days of differentiation (colored according to differentiation stage).
(TIF)
Fold changes are log2 transformed fold changes (log2FC) of the expression in differentiated adipocytes compared to undifferentiated pre-adipocytes (positive when the probe is over-expressed; negative when the probe is under-expressed). P-values are corrected for multiple testing using Benjamini and Hochberg’s method (false discovery rate<5%). Only probes with log2FC>2 or log2FC<-2 for mRNA (A) and log2FC>1 or log2FC<-1 for miRNA (B) are listed. Gene names (A) or miRNA symbols (B) have been determined with Ingenuity Pathway. D indicates the presence of a duplication: two different probes are tagging the same gene. Long non-coding RNA data are displayed with a blue filing. ID corresponds to the probe id.
(XLSX)
Gene names (A) or miRNA symbols (B) have been determined with IPA. D indicates the presence of a duplication: two different probes are tagging the same gene. Fold changes (FC) are actually log2 transformed fold changes (log2FC), therefore if a FC is positive the probe is over-expressed in the tested condition compared to the control, whereas it is under-expressed when a FC is negative. In addition, when a FC is equal to +1 or -1, the probe is twice as over or under-expressed. P-values are corrected for multiple testing using Benjamini and Hochberg’s method to control the false discovery rate with a 5% threshold. Long intergenic non-coding RNAs data are displayed with a blue filing and small nucleolar RNAs data are displayed with a pink filing. ID corresponds to the probe id.
(XLSX)
Fold changes (FC) are actually log2 transformed fold changes, therefore if a FC is the probe is over-expressed in the tested condition compared to the control, whereas it is under-expressed when a FC is negative. Du column: D indicates the presence of a duplication: two different probes are tagging the same gene. Long intergenic non-coding RNAs data are displayed with a blue filling and small nucleolar RNAs data are displayed with a pink filling. Probes differentially expressed for both concentrations (10 nM and 10 μM) are displayed with a yellow filling.
(XLSX)
The significant log2 fold changes along with the p-values are displayed. NS stands for non-significant. The highlighted housekeeping genes (pink background) show no differential expression in any condition compared to the control.
(XLSX)
(XLSX)
The ten genes that were differentially expressed in the microarray analysis for the three bisphenols (A, F and S) at both concentrations (10 nM and 10 μM) were analyzed. The log2 fold changes (positive when the probe is over-expressed; negative when the probe is under-expressed), along with the p-values are displayed for each technology.
(XLSX)
Acknowledgments
We thank David Hot and the Transcriptomics and Applied Genomics Group (Inserm U 1019, CNRS UMR 8204, Institut Pasteur de Lille, University of Lille) for microarrays processing. The authors thank the UMR 8199 LIGAN-PM Genomics platform (Lille, France) which belongs to the 'Federation de Recherche' 3508 Labex EGID (European Genomics Institute for Diabetes; ANR-10-LABX-46) and was supported by the ANR Equipex 2010 session (ANR-10-EQPX-07-01; 'LIGAN-PM') for support in global data processing and qPCR. The LIGAN-PM Genomics platform (Lille, France) is also supported by the FEDER and the Region Nord-Pas-de-Calais-Picardie.
Data Availability
All microarray data results were deposited on Gene Expression Omnibus website, (http://www.ncbi.nlm.nih.gov/geo/) under the accession number GSE98682 which includes both series of mRNA/lncRNA data (GPL16699) and miRNA data (GPL19730). The samples series providing both the raw and normalized data is accessible through the accession numbers from GSM2609729 to GSM2609851.
Funding Statement
This study was funded by the Centre National de la Recherche Scientifique (www.cnrs.fr), the Ministère de l’Ecologie, du Développement Durable et de l’Energie” (MEDDE) according to the “Programme National de Recherche sur les Perturbateurs Endocriniens” (13-MRES-PNRPE-2-CVS-044; http://www.developpement-durable.gouv.fr), and the European Research Council (ERC-2011-ADG; https://erc.europa.eu). The authors thank the UMR 8199 LIGAN-PM Genomics platform (Lille, France) which belongs to the 'Federation de Recherche' 3508 Labex EGID (European Genomics Institute for Diabetes; ANR-10-LABX-46) and was supported by the ANR Equipex 2010 session (ANR-10-EQPX-07-01; 'LIGAN-PM') for support in global data processing and qPCR. The LIGAN-PM Genomics platform (Lille, France) is also supported by the FEDER and the Region Nord-Pas-de-Calais-Picardie. The funders had no role in study design, data collection and analysis, decision to publish, or preparation of the manuscript.
References
- 1.Hutchinson TH, Brown R, Brugger KE, Campbell PM, Holt M, Länge R, et al. Ecological risk assessment of endocrine disruptors. Environ Health Perspect. 2000;108: 1007–1014. [DOI] [PMC free article] [PubMed] [Google Scholar]
- 2.vom Saal FS, Nagel SC, Coe BL, Angle BM, Taylor JA. THE ESTROGENIC ENDOCRINE DISRUPTING CHEMICAL BISPHENOL A (BPA) AND OBESITY. Mol Cell Endocrinol. 2012;354: 74–84. doi: 10.1016/j.mce.2012.01.001 [DOI] [PMC free article] [PubMed] [Google Scholar]
- 3.Magliano DJ, Loh VHY, Harding JL, Botton J, Shaw JE. Persistent organic pollutants and diabetes: a review of the epidemiological evidence. Diabetes Metab. 2014;40: 1–14. doi: 10.1016/j.diabet.2013.09.006 [DOI] [PubMed] [Google Scholar]
- 4.Calafat AM, Kuklenyik Z, Reidy JA, Caudill SP, Ekong J, Needham LL. Urinary concentrations of bisphenol A and 4-nonylphenol in a human reference population. Environ Health Perspect. 2005;113: 391–395. doi: 10.1289/ehp.7534 [DOI] [PMC free article] [PubMed] [Google Scholar]
- 5.Rochester JR. Bisphenol A and human health: a review of the literature. Reprod Toxicol Elmsford N. 2013;42: 132–155. doi: 10.1016/j.reprotox.2013.08.008 [DOI] [PubMed] [Google Scholar]
- 6.Shankar A, Teppala S. Relationship between urinary bisphenol A levels and diabetes mellitus. J Clin Endocrinol Metab. 2011;96: 3822–3826. doi: 10.1210/jc.2011-1682 [DOI] [PMC free article] [PubMed] [Google Scholar]
- 7.Shankar A, Teppala S, Sabanayagam C. Urinary bisphenol a levels and measures of obesity: results from the national health and nutrition examination survey 2003–2008. ISRN Endocrinol. 2012;2012: 965243 doi: 10.5402/2012/965243 [DOI] [PMC free article] [PubMed] [Google Scholar]
- 8.Wang T, Li M, Chen B, Xu M, Xu Y, Huang Y, et al. Urinary bisphenol A (BPA) concentration associates with obesity and insulin resistance. J Clin Endocrinol Metab. 2012;97: E223–227. doi: 10.1210/jc.2011-1989 [DOI] [PubMed] [Google Scholar]
- 9.Rancière F, Lyons JG, Loh VHY, Botton J, Galloway T, Wang T, et al. Bisphenol A and the risk of cardiometabolic disorders: a systematic review with meta-analysis of the epidemiological evidence. Environ Health. 2015;14 doi: 10.1186/s12940-015-0036-5 [DOI] [PMC free article] [PubMed] [Google Scholar]
- 10.Rochester J, Bolden A. Bisphenol S and F: A Systematic Review and Comparison of the Hormonal Activity of Bisphenol A Substitutes. Env Health Perspect. 2015;123: 643–650. [DOI] [PMC free article] [PubMed] [Google Scholar]
- 11.Dietrich D R., Hengstler JG. From bisphenol A to bisphenol F and a ban of mustard due to chronic low-dose exposures? Arch Toxicol. 2016;90: 489–491. doi: 10.1007/s00204-016-1671-5 [DOI] [PubMed] [Google Scholar]
- 12.Zhou X, Kramer JP, Calafat AM, Ye X. Automated on-line column-switching high performance liquid chromatography isotope dilution tandem mass spectrometry method for the quantification of bisphenol A, bisphenol F, bisphenol S, and 11 other phenols in urine. J Chromatogr B. 2014;944: 152–156. doi: 10.1016/j.jchromb.2013.11.009 [DOI] [PubMed] [Google Scholar]
- 13.Mileva G, Baker SL, Konkle ATM, Bielajew C. Bisphenol-A: epigenetic reprogramming and effects on reproduction and behavior. Int J Environ Res Public Health. 2014;11: 7537–7561. doi: 10.3390/ijerph110707537 [DOI] [PMC free article] [PubMed] [Google Scholar]
- 14.Montes-Grajales D, Olivero-Verbel J. Computer-aided identification of novel protein targets of bisphenol A. Toxicol Lett. 2013;222: 312–320. doi: 10.1016/j.toxlet.2013.08.010 [DOI] [PubMed] [Google Scholar]
- 15.Chevalier N, Fénichel P. Bisphenol A: Targeting metabolic tissues. Rev Endocr Metab Disord. 2015;16: 299–309. doi: 10.1007/s11154-016-9333-8 [DOI] [PubMed] [Google Scholar]
- 16.Wetherill YB, Akingbemi BT, Kanno J, McLachlan JA, Nadal A, Sonnenschein C, et al. In vitro molecular mechanisms of bisphenol A action. Reprod Toxicol. 2007;24: 178–198. doi: 10.1016/j.reprotox.2007.05.010 [DOI] [PubMed] [Google Scholar]
- 17.Völkel W, Colnot T, Csanády GA, Filser JG, Dekant W. Metabolism and Kinetics of Bisphenol A in Humans at Low Doses Following Oral Administration. Chem Res Toxicol. 2002;15: 1281–1287. doi: 10.1021/tx025548t [DOI] [PubMed] [Google Scholar]
- 18.Vandenberg LN, Chahoud I, Heindel JJ, Padmanabhan V, Paumgartten FJR, Schoenfelder G. Urinary, Circulating, and Tissue Biomonitoring Studies Indicate Widespread Exposure to Bisphenol A. Environ Health Perspect. 2010;118: 1055–1070. doi: 10.1289/ehp.0901716 [DOI] [PMC free article] [PubMed] [Google Scholar]
- 19.Lagarde F, Beausoleil C, Belcher SM, Belzunces LP, Emond C, Guerbet M, et al. Non-monotonic dose-response relationships and endocrine disruptors: a qualitative method of assessment. Environ Health Glob Access Sci Source. 2015;14: 13 doi: 10.1186/1476-069X-14-13 [DOI] [PMC free article] [PubMed] [Google Scholar]
- 20.Bartel DP. MicroRNAs: Target Recognition and Regulatory Functions. Cell. 2009;136: 215–233. doi: 10.1016/j.cell.2009.01.002 [DOI] [PMC free article] [PubMed] [Google Scholar]
- 21.Dupuis-Sandoval F, Poirier M, Scott MS. The emerging landscape of small nucleolar RNAs in cell biology: Emerging landscape of small nucleolar RNAs. Wiley Interdiscip Rev RNA. 2015;6: 381–397. doi: 10.1002/wrna.1284 [DOI] [PMC free article] [PubMed] [Google Scholar]
- 22.Mercer TR, Dinger ME, Mattick JS. Long non-coding RNAs: insights into functions. Nat Rev Genet. 2009;10: 155–159. doi: 10.1038/nrg2521 [DOI] [PubMed] [Google Scholar]
- 23.Ritchie ME, Phipson B, Wu D, Hu Y, Law CW, Shi W, et al. limma powers differential expression analyses for RNA-sequencing and microarray studies. Nucleic Acids Res. 2015;43: e47–e47. doi: 10.1093/nar/gkv007 [DOI] [PMC free article] [PubMed] [Google Scholar]
- 24.López-Romero P. Pre-processing and differential expression analysis of Agilent microRNA arrays using the AgiMicroRna Bioconductor library. BMC Genomics. 2011;12: 1. [DOI] [PMC free article] [PubMed] [Google Scholar]
- 25.Karbiener M, Pisani DF, Frontini A, Oberreiter LM, Lang E, Vegiopoulos A, et al. MicroRNA-26 Family Is Required for Human Adipogenesis and Drives Characteristics of Brown Adipocytes: MicroRNA-26 Family in Human Adipogenesis. STEM CELLS. 2014;32: 1578–1590. doi: 10.1002/stem.1603 [DOI] [PubMed] [Google Scholar]
- 26.Karbiener M, Neuhold C, Opriessnig P, Prokesch A, Bogner-Strauss JG, Scheideler M. MicroRNA-30c promotes human adipocyte differentiation and co-represses PAI-1 and ALK2. RNA Biol. 2011;8: 850–860. doi: 10.4161/rna.8.5.16153 [DOI] [PubMed] [Google Scholar]
- 27.Zhang Z, Kang Y, Zhang Z, Zhang H, Duan X, Liu J, et al. Expression of microRNAs during chondrogenesis of human adipose-derived stem cells. Osteoarthritis Cartilage. 2012;20: 1638–1646. doi: 10.1016/j.joca.2012.08.024 [DOI] [PubMed] [Google Scholar]
- 28.Ariemma F, D’Esposito V, Liguoro D, Oriente F, Cabaro S, Liotti A, et al. Low-Dose Bisphenol-A Impairs Adipogenesis and Generates Dysfunctional 3T3-L1 Adipocytes. Nadal A, editor. PLOS ONE. 2016;11: e0150762 doi: 10.1371/journal.pone.0150762 [DOI] [PMC free article] [PubMed] [Google Scholar]
- 29.Ohlstein JF, Strong AL, McLachlan JA, Gimble JM, Burow ME, Bunnell BA. Bisphenol A enhances adipogenic differentiation of human adipose stromal/stem cells. J Mol Endocrinol. 2014;53: 345–353. doi: 10.1530/JME-14-0052 [DOI] [PMC free article] [PubMed] [Google Scholar]
- 30.Alonso-Magdalena P, Ropero AB, Soriano S, García-Arévalo M, Ripoll C, Fuentes E, et al. Bisphenol-A acts as a potent estrogen via non-classical estrogen triggered pathways. Mol Cell Endocrinol. 2012;355: 201–207. doi: 10.1016/j.mce.2011.12.012 [DOI] [PubMed] [Google Scholar]
- 31.Alonso-Magdalena P, Ropero AB, Carrera MP, Cederroth CR, Baquié M, Gauthier BR, et al. Pancreatic Insulin Content Regulation by the Estrogen Receptor ERα. Maedler K, editor. PLoS ONE. 2008;3: e2069 doi: 10.1371/journal.pone.0002069 [DOI] [PMC free article] [PubMed] [Google Scholar]
- 32.Soriano S, Alonso-Magdalena P, García-Arévalo M, Novials A, Muhammed SJ, Salehi A, et al. Rapid Insulinotropic Action of Low Doses of Bisphenol-A on Mouse and Human Islets of Langerhans: Role of Estrogen Receptor β. Maedler K, editor. PLoS ONE. 2012;7: e31109 doi: 10.1371/journal.pone.0031109 [DOI] [PMC free article] [PubMed] [Google Scholar]
- 33.Nadal A, Fuentes E, Ripoll C, Villar-Pazos S, Castellano-Muñoz M, Soriano S, et al. Extranuclear-initiated estrogenic actions of endocrine disrupting chemicals: Is there toxicology beyond paracelsus? J Steroid Biochem Mol Biol. 2017; doi: 10.1016/j.jsbmb.2017.01.014 [DOI] [PubMed] [Google Scholar]
- 34.Ahmed S, Atlas E. Bisphenol S- and bisphenol A-induced adipogenesis of murine preadipocytes occurs through direct peroxisome proliferator-activated receptor gamma activation. Int J Obes. 2016; doi: 10.1038/ijo.2016.95 [DOI] [PubMed] [Google Scholar]
- 35.Boucher JG, Husain M, Rowan-Carroll A, Williams A, Yauk CL, Atlas E. Identification of mechanisms of action of bisphenol a-induced human preadipocyte differentiation by transcriptional profiling: Mechanisms of Differentiation by BPA. Obesity. 2014;22: 2333–2343. doi: 10.1002/oby.20848 [DOI] [PubMed] [Google Scholar]
- 36.Boucher JG, Gagné R, Rowan-Carroll A, Boudreau A, Yauk CL, Atlas E. Bisphenol A and Bisphenol S Induce Distinct Transcriptional Profiles in Differentiating Human Primary Preadipocytes. Guillou H, editor. PLOS ONE. 2016;11: e0163318 doi: 10.1371/journal.pone.0163318 [DOI] [PMC free article] [PubMed] [Google Scholar]
- 37.Boucher JG, Ahmed S, Atlas E. Bisphenol S Induces Adipogenesis in Primary Human Preadipocytes From Female Donors. Endocrinology. 2016;157: 1397–1407. doi: 10.1210/en.2015-1872 [DOI] [PubMed] [Google Scholar]
- 38.Bhan A, Hussain I, Ansari KI, Bobzean SAM, Perrotti LI, Mandal SS. Bisphenol-A and diethylstilbestrol exposure induces the expression of breast cancer associated long noncoding RNA HOTAIR in vitro and in vivo. J Steroid Biochem Mol Biol. 2014;141: 160–170. doi: 10.1016/j.jsbmb.2014.02.002 [DOI] [PMC free article] [PubMed] [Google Scholar]
- 39.Ho S-M, Cheong A, Lam H-M, Hu W-Y, Shi G-B, Zhu X, et al. Exposure of Human Prostaspheres to Bisphenol A Epigenetically Regulates SNORD Family Noncoding RNAs via Histone Modification. Endocrinology. 2015;156: 3984–3995. doi: 10.1210/en.2015-1067 [DOI] [PMC free article] [PubMed] [Google Scholar]
- 40.Khan D, Ahmed SA. Epigenetic Regulation of Non-Lymphoid Cells by Bisphenol A, a Model Endocrine Disrupter: Potential Implications for Immunoregulation. Front Endocrinol. 2015;6 doi: 10.3389/fendo.2015.00091 [DOI] [PMC free article] [PubMed] [Google Scholar]
- 41.Ali S, Steinmetz G, Montillet G, Perrard M-H, Loundou A, Durand P, et al. Exposure to low-dose bisphenol A impairs meiosis in the rat seminiferous tubule culture model: a physiotoxicogenomic approach. PloS One. 2014;9: e106245 doi: 10.1371/journal.pone.0106245 [DOI] [PMC free article] [PubMed] [Google Scholar]
- 42.Villeneuve DL, Garcia-Reyero N, Escalon BL, Jensen KM, Cavallin JE, Makynen EA, et al. Ecotoxicogenomics to support ecological risk assessment: a case study with bisphenol A in fish. Environ Sci Technol. 2012;46: 51–59. doi: 10.1021/es201150a [DOI] [PubMed] [Google Scholar]
- 43.Kipp JL, Kilen SM, Bristol-Gould S, Woodruff TK, Mayo KE. Neonatal Exposure to Estrogens Suppresses Activin Expression and Signaling in the Mouse Ovary. Endocrinology. 2007;148: 1968–1976. doi: 10.1210/en.2006-1083 [DOI] [PubMed] [Google Scholar]
- 44.Wijayarathna R, de Kretser DM. Activins in reproductive biology and beyond. Hum Reprod Update. 2016;22: 342–357. doi: 10.1093/humupd/dmv058 [DOI] [PubMed] [Google Scholar]
- 45.Sjöholm K, Palming J, Lystig TC, Jennische E, Woodruff TK, Carlsson B, et al. The expression of inhibin beta B is high in human adipocytes, reduced by weight loss, and correlates to factors implicated in metabolic disease. Biochem Biophys Res Commun. 2006;344: 1308–1314. doi: 10.1016/j.bbrc.2006.04.030 [DOI] [PubMed] [Google Scholar]
- 46.Magnusson B, Svensson P-A, Carlsson LMS, Sjöholm K. Activin B inhibits lipolysis in 3T3-L1 adipocytes. Biochem Biophys Res Commun. 2010;395: 373–376. doi: 10.1016/j.bbrc.2010.04.022 [DOI] [PubMed] [Google Scholar]
- 47.Koncarevic A, Kajimura S, Cornwall-Brady M, Andreucci A, Pullen A, Sako D, et al. A novel therapeutic approach to treating obesity through modulation of TGFβ signaling. Endocrinology. 2012;153: 3133–3146. doi: 10.1210/en.2012-1016 [DOI] [PMC free article] [PubMed] [Google Scholar]
- 48.Myers GM, Lambert-Messerlian GM, Sigman M. Inhibin B reference data for fertile and infertile men in Northeast America. Fertil Steril. 2009;92: 1920–1923. doi: 10.1016/j.fertnstert.2008.09.033 [DOI] [PubMed] [Google Scholar]
Associated Data
This section collects any data citations, data availability statements, or supplementary materials included in this article.
Supplementary Materials
(TIF)
The difference between the average expression in the pre-adipocyte and the adipocyte with the global expression is represented.
(TIF)
A) Venn diagram of differentially expressed probes for each patient before and after ten days of differentiation, a probe is considered as differentially expressed if log2FC>2. B) Individual representation of the first two axes of the principal component analysis on all probes for each patient before and after ten days of differentiation (colored according to patient). C) Individual representation of the first two axes of the principal component analysis on all probes for each patient before and after ten days of differentiation (colored according to differentiation stage).
(TIF)
A) Venn diagram of differentially expressed probes for each patient before and after ten days of differentiation, a probe is considered as differentially expressed if log2FC>2. B) Venn diagram of differentially expressed probes for each patient before and after ten days of differentiation, a probe is considered as differentially expressed if log2FC>1. C) Individual representation of the first two axes of the principal component analysis on all probes for each patient before and after ten days of differentiation (colored according to patient). D) Individual representation of the first two axes of the principal component analysis on all probes for each patient before and after ten days of differentiation (colored according to differentiation stage).
(TIF)
Fold changes are log2 transformed fold changes (log2FC) of the expression in differentiated adipocytes compared to undifferentiated pre-adipocytes (positive when the probe is over-expressed; negative when the probe is under-expressed). P-values are corrected for multiple testing using Benjamini and Hochberg’s method (false discovery rate<5%). Only probes with log2FC>2 or log2FC<-2 for mRNA (A) and log2FC>1 or log2FC<-1 for miRNA (B) are listed. Gene names (A) or miRNA symbols (B) have been determined with Ingenuity Pathway. D indicates the presence of a duplication: two different probes are tagging the same gene. Long non-coding RNA data are displayed with a blue filing. ID corresponds to the probe id.
(XLSX)
Gene names (A) or miRNA symbols (B) have been determined with IPA. D indicates the presence of a duplication: two different probes are tagging the same gene. Fold changes (FC) are actually log2 transformed fold changes (log2FC), therefore if a FC is positive the probe is over-expressed in the tested condition compared to the control, whereas it is under-expressed when a FC is negative. In addition, when a FC is equal to +1 or -1, the probe is twice as over or under-expressed. P-values are corrected for multiple testing using Benjamini and Hochberg’s method to control the false discovery rate with a 5% threshold. Long intergenic non-coding RNAs data are displayed with a blue filing and small nucleolar RNAs data are displayed with a pink filing. ID corresponds to the probe id.
(XLSX)
Fold changes (FC) are actually log2 transformed fold changes, therefore if a FC is the probe is over-expressed in the tested condition compared to the control, whereas it is under-expressed when a FC is negative. Du column: D indicates the presence of a duplication: two different probes are tagging the same gene. Long intergenic non-coding RNAs data are displayed with a blue filling and small nucleolar RNAs data are displayed with a pink filling. Probes differentially expressed for both concentrations (10 nM and 10 μM) are displayed with a yellow filling.
(XLSX)
The significant log2 fold changes along with the p-values are displayed. NS stands for non-significant. The highlighted housekeeping genes (pink background) show no differential expression in any condition compared to the control.
(XLSX)
(XLSX)
The ten genes that were differentially expressed in the microarray analysis for the three bisphenols (A, F and S) at both concentrations (10 nM and 10 μM) were analyzed. The log2 fold changes (positive when the probe is over-expressed; negative when the probe is under-expressed), along with the p-values are displayed for each technology.
(XLSX)
Data Availability Statement
All microarray data results were deposited on Gene Expression Omnibus website, (http://www.ncbi.nlm.nih.gov/geo/) under the accession number GSE98682 which includes both series of mRNA/lncRNA data (GPL16699) and miRNA data (GPL19730). The samples series providing both the raw and normalized data is accessible through the accession numbers from GSM2609729 to GSM2609851.