Abstract
In this work, we propose a novel method to improve texture based tumor segmentation by fusing cell density patterns that are generated from tumor growth modeling. In order to model tumor growth, we solve the reaction-diffusion equation by using Lattice-Boltzmann method (LBM). Computational tumor growth modeling obtains the cell density distribution that potentially indicates the predicted tissue locations in the brain over time. The density patterns is then considered as novel features along with other texture (such as fractal, and multifractal Brownian motion (mBm)), and intensity features in MRI for improved brain tumor segmentation. We evaluate the proposed method with about one hundred longitudinal MRI scans from five patients obtained from public BRATS 2015 data set, validated by the ground truth. The result shows significant improvement of complete tumor segmentation using ANOVA analysis for five patients in longitudinal MR images.
Keywords: Tumor segmentation, tumor growth model, reaction-diffusion equation, Lattice-Boltzmann method, cell density, longitudinal MRI
1 INTRODUCTION
Glioblastoma (GBM), a grade IV astrocytoma, is one of the most common and aggressive tumor in brain. It is highly diffusive and infiltrative to surrounding tissues and very difficult to cure. Even though there are many advanced treatments available, patients with GBM have median survival of 14.6 months after diagnosis [1]. Brain tumor segmentation from MRI is a crucial task of identifying and locating tumor for neurosurgeons, oncologists and radiologists for treatment planning and disease managment. Manual segmentation is a time consuming, tedious and error-prone work. Therefore, automatic tumor segmentation techniques are needed. However, robust automatic tumor segmentation is still a very challenging task in medical image analysis due to tumor heterogeneity, variations size, shape, location and intenisty, unpredictable apperance of multiple abnormal tissues and infiltrations of cancesorous cells among surrounding tissues [2]. The many different techniques for brain tumor segmentation in literature can be broadly catergorized as discriminative and generative approaches [3]. Discriminative method defines the model based on the voxel labels with intensities [2] [4] [5], while the generative method defines the model by computing the joint probability distribution of voxel labels [3] [6] [7]. The generative approaches use registration technique for aligning tumor bearing images with a normative atlas. However, the assumption of localized spatial support does not hold due the present of tumor or lesion. Few methods use other techniques such as over-segmentation of the tumor bearing MRI images [8] [9] to avoid challenges in deformable image registration
In our previous work, we developed a texture based brain tumor tissue segmentation in multimodality MRI using public datasets [2]. The work obtains novel texture features such as piece-wise triangular prism surface area (fractal), multi-fractional Brownian motion (mBm) and Garbor-like textons and utlize classical random forest (RF) classifier for tumor segmentation. Howerver, for longtitudinal MRI scans, tumor growth modeling may provide additional information over time that may be used to facilitate predictive segmentation. There have been few growth modeling methods used for longitudinal tumor segmentation in literature [3], [8], [10] and [11]. In [3], the authors let tumor seed grow in atlas, then register the simulated tumor beairng atlas with patient MRI to achieve tumor segmentation. In [8], the authors use joint label fusion to segment tumor by integrating tumor label prediction of tumor growth. In [10] and [11], authors work with conditional random field for tumor segmentation. However, none of these methods explicitly obtains tumor segmentation using growth patterns as features.
Consequently, this work proposes a method that fuses features obtained from tumor growth modeling with our prior texture and intensity features to obtain improved tumor segmentation in longitudinal data. We use the cell density information obtained from the growth patterns as new feature to segment the abnormal tissues in the brain MRI. The tumor growth model is based on reaction-diffusion equation and solved using Lattice-Boltzmann method (LBM), a class of computational fluid dynamics (CFD) method for fluid simulation [12].
The rest of this paper is organized as follows. Section 2 introduces the related background, including texture based tumor segmentation and tumor growth modeling. We obtain mathematical derivation for the reaction diffusion-based tumor growth model in section 3. Section 4 discusses the experiments and results, and conclusion is discussed in section 5.
2 BACKGROUND
2.1 Texture based brain tumor segmentation
In previous work, we developed a stochastic model for characterizing tumor texture in MR images [2] [4]. In the method, we fuse fractal and multi-scale spatially variable mBm texture features with intensity and intensity difference among different MRI modalities. Random forest is used to obtain multiclass tumor tissue segmentation where threefold cross-validation varies from 73% to 87% using Dice overlap for tumor core and complete tumor. More details on these fractal-based texture features may be found in [2] and [4].
2.2 Tumor growth model
Tumor growth is the abnormal growth of tissue, which usually involves cell invasion and mass effect. In cell invasion, tumor cells migrate as a cohesive and multicellular group with retained cell-cell junctions and penetrate to surrounding health tissues [13]. Mass effect is the effect of the growing tumor mass that results in secondary pathological effects by pushing on or displacing surrounding tissues. Reaction-diffusion equation has been widely used to model tumor growth, using a diffusion and a logistic proliferation term as follows,
| (1) |
| (2) |
where ns is the tumor cell density, D is the infiltrating diffusion coefficient, and ρ is the proliferation rate. Equation (2) enforces Neumann boundary conditions on the brain domain Ω, and is unit normal vector on the ∂Ω pointing inward to the domain.
3 METHODS
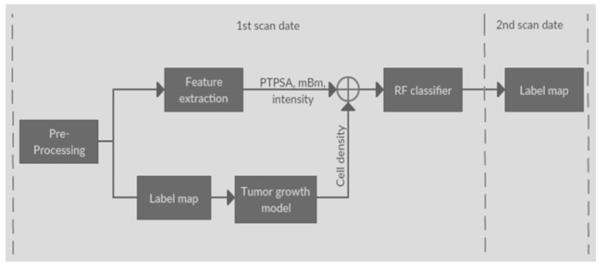
The proposed method utilize tumor growth patterns as novel features to improve texture based tumor segmentation in longitudinal MRI. The growth patterns are obtained as cell density for different tissues in a tumor growth model. The proposed pipeline is showing in Figure 1. We extract texture (e.g., fractal, and mBm), and intensity features and also obtain the ground truth label map for different tissues from MRI scans at the first time point. We use the label maps to obtain tumor growth modeling and predict cell density for next time point. Finally, we consider cell density pattern as a new feature, fuse cell density with other features using a random forest classifier to generate the label of second time point data.
Figure 1.
Pipeline of the proposed method. At the 1st scan date, we use the label map of 1st scan image as input of tumor growth model, so that we can predict the cell density distribution of 2nd scan data. Adding the cell density with other features, such as fractal, mBm and intensity, etc., applying to the RF classifier for predict the label of 2nd scan data.
3.1 Lattice-Boltzmann method
In order to solve the partial-differential equation (PDE) for tumor growth, shown equation (1), we use Lattice-Boltzmann method (LBM) since LBM method is computationally efficient and may be easily parallelized. The LBM is defined as [14]:
| (3) |
where is the one particle distribution function of specifies s with velocity at time t and dimensionless position . is nonreactive term. is active term.
| (4) |
where τ is the relaxation time. , the equilibrium distribution function, depends on and t corresponding to a system with zero mean flow given as:
| (5) |
Two-dimensional nine-velocity (D2Q9) model is commonly used in 2D cases. The nine discrete velocities are as follows,
| (6) |
Let’s define:
| (7) |
Here, ns is the cell density as defined in equation (1), and ws,i is dependent on the lattice system. In our case:
| (8) |
By using LBM, the reaction-diffusion equation can be recovered as:
| (9) |
| (10) |
Setting offers solution for Eq. (1).
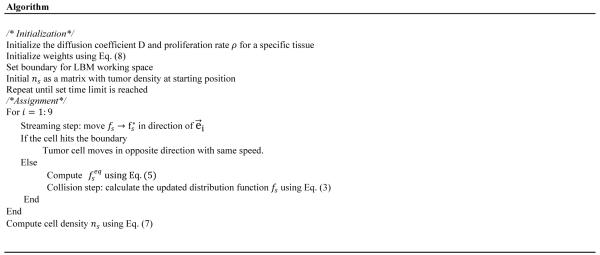
3.2 Algorithm for tumor growth model
We obtain the following algorithm to solve the tumor growth modeling.
4 EXPERIMENT AND RESULTS
The section demonstrates the experiment of tumor growth model and texture based brain tumor segmentation with cell density information. We also discuss the result at end.
4.1 Data
We evaluate the proposed method using patient data from BRATS 2015 [15]. Among the high grade patients’ data in BRATS 2015, there are 5 longitudinal cases with tumor increase, for each patient there are four MRI modalities (T1, contrast enhanced T1, T2, FLAIR) and a ground truth. All four modalities images are co-registered and skull-stripped. Abnormal tissue types include necrosis, edema, non-enhancing tumor, enhancing tumor and everything else.
4.2 Experiment for tumor growth model
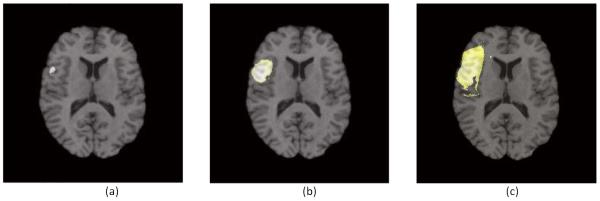
To solve brain tumor growth model by using LBM, there are three parameters that impact the performance: diffusion coefficient D, proliferation rate ρ and simulated days t. The diffusion coefficient and proliferation are variable in the model. Choosing the value of these variables is a challenging task and also varies due to tissue variability. In [16], the value of D is chosen within[0.02, 1.5] mm2/day, and ρϵ[0.002, 0.2]day−1 for enhancing tumor tissue. For example, we choose D = 0.05, and ρ = 0.01, and set the enhancing tumor cell density threshold as 0.8. Figure 4 shows an example of tumor growth modeling.
Figure 4.
An example of tumor growth modeling. Tumor seed locates at position (90, 73). We set D = 0.05, ρ = 0.01 and threshold = 0.8. Location of cell density over the threshold will be assigned as tumor. (a) is showing tumor with 200 days, (b) is simulation of tumor with 250 days and (c) is for 300 days.
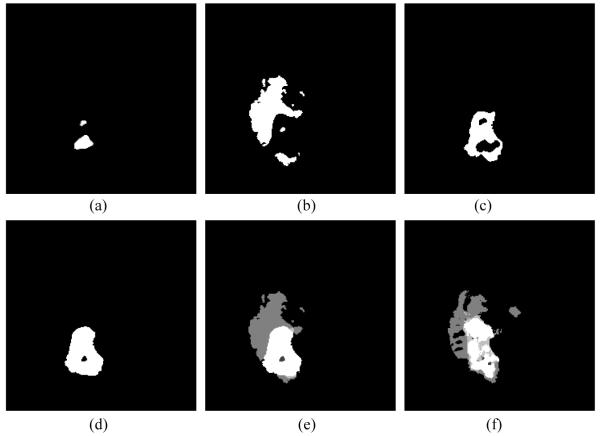
We then apply the tumor growth model to real patient data from BRATS 2015. For each patient, it may have all necrosis, edema, non-enhancing tumor and enhancing tumor. We simulate all abnormal tissues separately, then fuse all into the final label of the patient. Parameters vary among the tissues. Figure 5 shows an example of tumor growth in an MRI slice for a patient in BRATS 2015 data.
Figure 5.
An example of tumor growth model by using proposed method for one slice of patient 439. (a) Simulated necrosis with D = 0.052, ρ = 0.01. (b) Edema with D = 0.06, ρ = 0.009. (c) Non-enhancing tumor with D = 0.03, ρ = 0.014. (d) Enhancing tumor with D = 0.05, ρ = 0.01. (e) Fused label and (f) ground truth of the second scan data.
4.3 Experiment for tumor segmentation
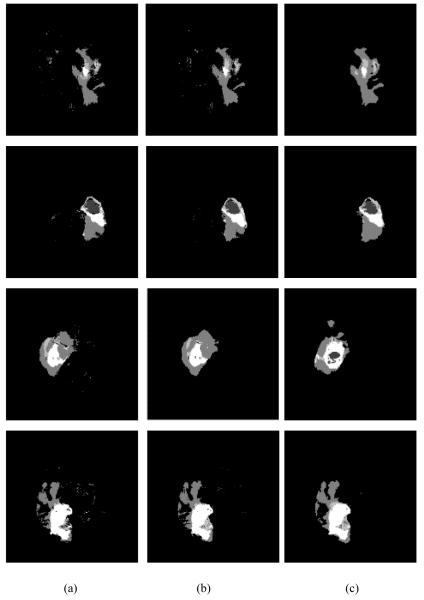
By using the proposed method, we obtain the cell density patterns for non-enhancing tumor core enhancing tumor and complete tumor (includes all tissues including edema and necrosis) tissues respectively. Following our previous work [2], we use a total 30 features, including fractal, mBm, intensity and intensity difference among MRI modalities. By adding cell density as a new feature type, we now have 34 features (necrosis density, edema density, non-enhancing tumor density and enhancing tumor density) extracted from each MRI slice. We evaluate our method using 5 patients with 20 slices for each patient. Figure 6 shows an example of Dice similarity coefficient (DSC) comparison between tissue segmentation obtained before and after adding cell density as a feature type for a patient.
Figure 6.
Examples of tumor segmentation by using the proposed method. (a) Tumor segmentation without cell density feature, (b) tumor segmentation with cell density feature, and (c) the ground truth of second time scan.
DSC of two sets A and B is defined as:
| (11) |
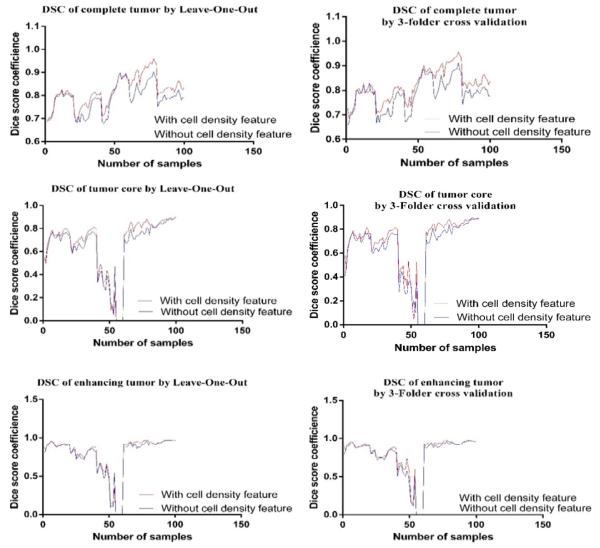
Tumor region is defined as complete tumor, tumor core and enhancing tumor [15]. We evaluate the performance of the proposed method for all 100 MRI slices using both leave-one-out (LOO) and 3-fold cross validation as shown in Figure 7.
Figure 7.
Comparison of DSC between with and without cell density feature by using Leave-One-Out (left column) and 3-Folder cross validation (right column) for all slices, respectively.
Table 1 shows the mean DSC for three tumor tissues for both validation methods. We further obtain statistical validation using analysis of variance (ANOVA) for all 100 MRI slices and the result is shown in Table 2.
Table 1.
Comparison of Dice similarity coefficient without/with cell density feature by using different methods.
| Method | Mean DSC without tumor cell density | Mean DSC with tumor cell density | ||||
|---|---|---|---|---|---|---|
| Complete tumor |
Tumor core |
Enhancing tumor |
Complete tumor |
Tumor core |
Enhancing tumor |
|
| Leave-One- Out |
0.78848 | 0.640672 | 0.925987 | 0.819302 | 0.671435 | 0.943215 |
| 3-Folder cross validation |
0.78621 | 0.645407 | 0.78284 | 0.82122 | 0.685811 | 0.812388 |
Table 2.
ANOVA for all patients by using leave-one-out and 3-folder cross validation.
| p-value | Complete tumor | Tumor core | Enhancing tumor |
|---|---|---|---|
| Leave-One-Out | 0.0007 | 0.2303 | 0.6249 |
| 3-Folder cross validation |
0.0001 | 0.1108 | 0.3729 |
The experimental cross-validation using both LOO classification and 3-Fold suggests that adding cell density feature improves the complete tumor segmentation. Furthermore, ANOVA analysis shows that fusion of tumor growth pattern with texture and intensity features offers significant improvement for the complete tumor tissue segmentation. In general, 3-fold cross validation method shows better performance over LOO for this work.
5 CONCLUSION AND FUTURE WORK
In this paper, we propose an improved texture based brain tumor segmentation method in longitudinal MR images by fusing tumor cell density patterns obtained from computational tumor growth modeling with other features. ANOVA analysis suggests the validity of the method for tumor core tissues for five patients in BRATS competition. In order for the method to be useful, we need to extend the proposed method to improve segmentation of other abnormal tissues associated with brain tumor. We further plan to evaluate our method with large number of patients. In addition, another future work may be to develop a more realistic tumor growth model by considering the treatment modalities.
Figure 2.
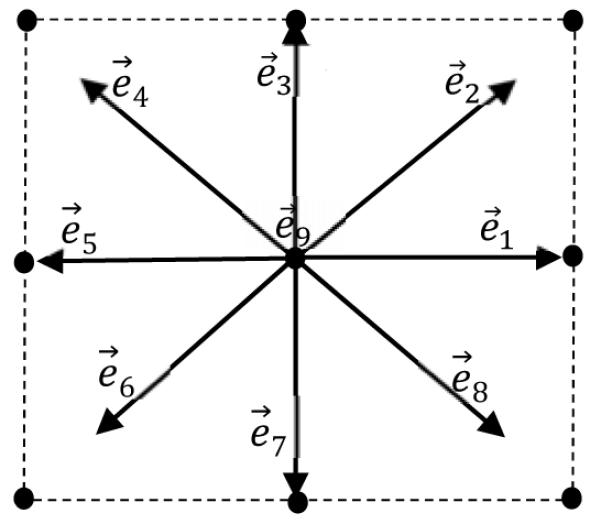
Illustration of a lattice with D2Q9 model.
Figure 3.
Algorithm for tumor growth model by using LMB.
ACKNOWLEDGEMENTS
This work was partially funded through grants by NCI/NIH (R15CA115464) and NIBIB/NIH (R01EB020683).
REFERENCES
- [1].Burzynski SR, Burzynsk GS, Janicki TJ. Recurrent Glioblastoma Multiforme - A Strategy for Long-Term Sruvival. Journal of Cancel Therapy. 2014:957–976. [Google Scholar]
- [2].Reza SM, Iftekharuddin KM. SPIE Medical Imaging. International Society for Optics and Photonics; 2014. Multi-fractal texture features for brain tumor and edema segmentation. [DOI] [PMC free article] [PubMed] [Google Scholar]
- [3].Gooya A, Pohl KM, Bilello M, Cirillo L, Biros G, Melhem ER, Davatzikos C. GLISTR: Glioma Image Segmentation and Registration. IEEE Transactions on Medical Imaging. 2012;31(no. 10):1941–54. doi: 10.1109/TMI.2012.2210558. [DOI] [PMC free article] [PubMed] [Google Scholar]
- [4].Islam A, Reza SM, Iftekharuddin KM. Multifractal Texture Estimation for Detection and Segmentation of Brain Tumors. IEEE Transactions of Biomedical Engineering. 2013;60(no. 11):3204–3215. doi: 10.1109/TBME.2013.2271383. [DOI] [PMC free article] [PubMed] [Google Scholar]
- [5].Kwon D, Shinohara RT, Akbari H, Davatzikos C. Combining Generative Models for Multifocal Glioma Segmentation and Registration. Med Image Comput Comput Assist Interv. 2014;17:763–770. doi: 10.1007/978-3-319-10404-1_95. no. 0 0. [DOI] [PMC free article] [PubMed] [Google Scholar]
- [6].Sabuncu MR, Yeo B. T. Thomas, Leemput KV, Fischl B, Golland P. A Generative Model for Image Segmentation Based on Label Fusion. IEEE Transactions on Medical Imaging. 2010;29(no. 10):1714–29. doi: 10.1109/TMI.2010.2050897. [DOI] [PMC free article] [PubMed] [Google Scholar]
- [7].Huang M, Yang W, Wu Y, Jiang J, Chen W. Brain Tumor Segmentation Based on Local Independent Projection-Based Classification. IEEE Transactions on Biomedical Engineering. 2014;61(no. 10):2633–2645. doi: 10.1109/TBME.2014.2325410. [DOI] [PubMed] [Google Scholar]
- [8].Pei L, Reza SM, Iftekharuddin KM. Improved Brain Tumor Growth Prediction and Segmentation in Longitudinal Brain MRI. 2015 IEEE International Conference on Bioinformatics and Biomedicine (BIBM); Washington DC. USA. 2015. [Google Scholar]
- [9].Wang H, Yushkevich PA. Multi-Atlas Segmentation without Registration: A Supervoxel-based Approach. Med Image Comput Comput Assist Interv. 2013;16(no. 0 3):535–542. doi: 10.1007/978-3-642-40760-4_67. [DOI] [PMC free article] [PubMed] [Google Scholar]
- [10].Alberts E, Charpiat G, Tarabalka Y, Huber T, Weber M-A, Bauer J, Zimmer C, Menze BH. Brainlesion: Glioma, Multiple ScIerosis, Stroke and Traumatic Brain Injuries. Springer; Munich, Germany: 2015. A Nonparametric Growth Model for Brain Tumor Segmentation in Longitudinal MR Sequences; pp. 69–79. [Google Scholar]
- [11].Bauer S, Tessier J, Krieter O, Notle L-P, Reyes M. Medical Computer Vision. Large Data in Medical Imaging. Springer; Nagoya, Japan: 2014. Integrated Spatio-Temporal Segmentation of Longitudinal Brain Tumor Imaging Studies; pp. 74–83. [Google Scholar]
- [12].Dawson SP, Chen S, Doolen GD. Lattice Boltzmann computations for reaction-diffusion equations. The Journal of Chemical Physics. 1993;98(no. 2):1514–1523. [Google Scholar]
- [13].Wong KC, Summers RM, Kebebew E, Yao J. Tumor growth prediction with reaction-diffusion and hyperelastic biomechanical model by physiological data fusion. Medical Image Analysis. 2015;25(no. 1):72–85. doi: 10.1016/j.media.2015.04.002. [DOI] [PMC free article] [PubMed] [Google Scholar]
- [14].Ngamsaad W, Triampo W, Kanthang P, Tang I-M, Nuttawut N, Modjung C. A one-dimensional Lattice Boltzmann method for modeling the dynamic pole-to-pole oscillations of Min proteins for determining the position of the midcell division plane. Journal of the Korean Physical Society. 2005;46(no. 4):1025–1030. [Google Scholar]
- [15].B. [Accessed 2 3 2016];brats2015-MICCAI-BRATS2016. 2015 [Online]. Available: https://sites.google.com/site/braintumorsegmentation/home/brats2015.
- [16].Le M, Delingette H, Kalpathy-Cramer J, Gerstner ER, Batchelor T, Unkelbach J, Ayache N. MICCAI - Medical Image Computing and Computer Assisted Intervention. Munich, Germany: 2015. Bayesian Personalization of Brain Tumor Growth Model. [Google Scholar]


