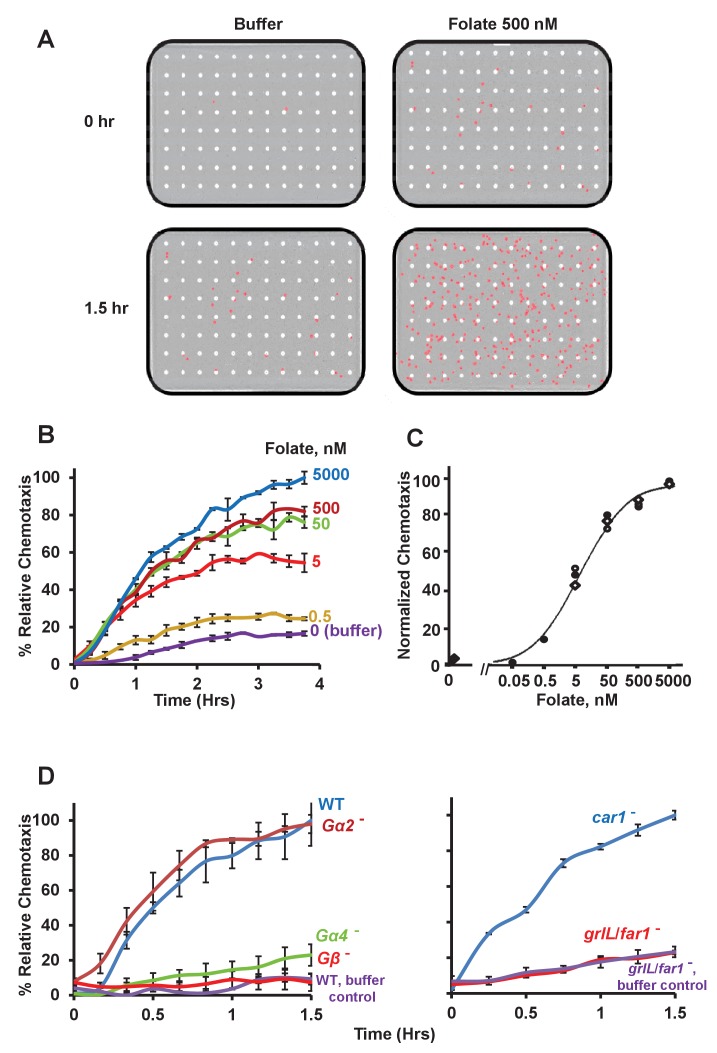
Figure 1. Chemotactic dose-response to folate.
(A) Images of Dictyostelium (in red) that have migrated through membrane pores (in white) in response to either control buffer or the chemoattractant folate, at 0 and 1.5 hr. (B) Time-course quantification of Dictyostelium migration to various dose concentrations of folate. Relative chemotaxis is normalized to 5000 nM folate at 4 hr. Standard deviations are shown based upon three replicates. (C) Quantified dose-response for Dictyostelium chemotaxis to folate. Curve fit is for an EC50 = 5 nM. Symbols presented are means from three separate experiments at 2 hr. (D) Time-course quantification of WT and Gα2-, Gα4-, Gβ-, car1-, and grlL/far1-null Dictyostelium migration to 500 nM folate or to buffer controls. Relative chemotaxis is normalized to WT (or car1-null) Dictyostelium at 1.5 hr; WT shows 10–20% higher relative chemotaxis to folate at 1.5 hr than does car1-null. Standard deviations are shown based upon three replicates.


