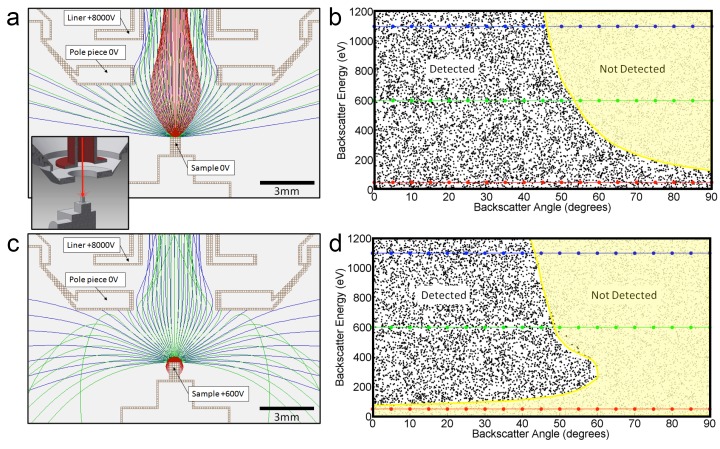
Figure 14. Positive bias applied to the sample suppresses secondary electrons but leaves most backscattered electrons unaffected.
In effect, this converts the SEM’s InLens ‘secondary’ detector into an efficient high-bandwidth backscatter detector well suited for FIB-SEM. (a) Electron flight simulation (using SIMION software package) showing paths of 1.1 keV (blue), 600 eV (green), and 50 eV (red) electrons emerging from an unbiased sample surface at a range of angles (−90o to 90o in 5o increments). After emerging from the sample surface, electrons are attracted by the +8 kV liner tube of the Zeiss Gemini column. (Kumagai and Sekiguchi, 2009) Inset shows the 3D CAD model that this simulation was based on. (Only electrostatic elements were modeled, not the magnetic field of the objective lens.) The lowest energy electrons (red) are all funneled up the column and thus potentially impact the InLens detector of the Gemini column. Here, we assume that all electrons that make it into the liner tube are in fact detected. For higher energy electrons (blue and green) only the central angles (−45° to 45°) are detected. (b) 10,000 electrons paths were simulated in the same model, covering a uniform range of starting energies (0 to 1.2 keV) and angles (−90° to 90°), allowing the detected vs. non-detected regions in energy vs. angle space to be plotted. All electrons below 100 eV are detected (i.e. make it into the liner tube) in this 0 V bias condition. 1.1 keV (blue), 600 eV (green), and 50 eV (red) electrons simulated in (a) are superimposed on this plot for cross-reference. (c) Same simulation as in (a) but with +600 V bias on the sample. This has a dramatic effect on the paths of the lowest energy (red) electrons, which are all pulled back onto the sample. (d) This filtering of low-energy (secondary) electrons is clearly seen in this corresponding energy vs. angle detection plot. Comparing (d) to (b) one can see that sample bias has only slight effect on the detection of higher energy electrons. The overall detection efficiency is determined by this acceptance mask, combined with the backscattered electrons distribution of Figure 13.

