Abstract
The invasive/metastatic potential of cancer cells is an important factor in tumor progression. The redox ratios obtained from ratios of the endogenous fluorescent signals of NADH and FAD, can effectively respond to the alteration of cancer cells in its mitochondrial energy metabolism. It has been shown previously that the redox ratios may predict the metastatic potential of cancer mouse xenografts. In this report, we aimed to investigate the metabolic state represented by the redox ratios of cancer cells in vitro. Fluorescence microscopic imaging technology was used to observe the changes of the endogenous fluorescence signals of NADH and FAD in the energy metabolism pathways. We measured the redox ratios (FAD/NADH) of breast cancer cell lines MDA-MB-231, MDA-MB-468, MCF-7, and SKBR3. We found that the more invasive cancer cells have higher FAD/NADH ratios, largely consistent with previous studies on breast cancer xenografts. Furthermore, by comparing the fluorescence signals of the breast cancer cells under different nutritional environments, including starvation and addition of glutamine, pyruvate and lactate, we found that the redox ratios still effectively distinguished the highly invasive MDA-MB-231 cells from less invasive MCF-7 cells. These preliminary data suggest that the redox ratio may potentially provide a new index to stratefy breast cancer with different degrees of aggressiveness, which could have significance for the diagnosis and treatment of breast cancer.
Keywords: Invasive potential, Redox ratio, Breast cancer, NADH, FAD
1 Introduction
Although in the past few decades, the 5-year survival rate of breast cancer patient has increased significantly in the USA, about 23% of the surviving patients have a metastatic disease that will kill about 40,000 people each year [1,2]. It is estimated that 20–30% of patients with node-negative breast cancer will eventually develop a metastatic disease [3]. Thus, cancer metastasis is the key determinant of cancer prognosis. The invasion of surrounding tissue is the first step of the metastasis and the highly metastatic cancer cells generally have a higher invasive potential. Studying the invasive potential of cancer cells may help us understand cancer metastasis and develop methods to inhibit it and reduce the mortality rate of cancer patients.
NADH and FAD are two coenzymes with endogenous fluorescence and play key roles in the mitochondrial bioenergetics. NADH and FADH2 pass their hydrogen atoms to oxygen to generate ATP and water in the electron transport chain. NADH and FADH2 are oxidized to NAD+ and FAD, respectively. Chance et al. demonstrated that the redox ratio, calculated by the fluorescence intensities of NADH and FAD, could be used to represent the metabolic redox state of mitochondria [4, 5].
In this study, we used the endogenous fluorescence signals from NADH and FAD, to study the energy states of breast cancer cells. Previously, our group has used the low-temperature fluorescence imaging method, i.e., the Chance redox scanner, to study the metabolic state of the melanoma xenografts in nude mice [6]. It was found that the tumors with different degrees of metastatic potential exhibited different redox ratios and their normalized FAD redox ratios, FAD/(FAD+NADH), correlate positively with the increase of invasive potential of cell lines. It has also been found that MDA-MB-231 xenografts with a higher metastatic potential presented a more oxidized state in the localized tumor regions than MCF-7 xenografts, which have a lower metastatic potential [7]. Based on these results, we aimed to investigate the correlation between the redox state and the invasive potential of cultured breast cancer cells in vitro. We also measured the redox state of breast cancer cell lines after adding nutrients (e.g. glucose, glutamine, pyruvate and lactate) to cell culture environment, in order to test whether cellular environment may affect the relationship between redox state and invasive potential.
2 Methods
NADH and FAD fluorescence signals were obtained by DeltaVision Deconvolution Microscope System which has a xenon lamp as an excitation light source, a 12-bit CCD, and an objective of 40X/0.95 NA. The imaging system (except the eyepiece) is covered by a thermally controlled chamber to maintain the samples at 37 °C. The excitation wavelengths of NADH and FAD channels are 360/40 nm and 470/40 nm, respectively. The emission wavelengths of NADH and FAD channels are 455/50 nm and 520/40 nm, respectively. Typically for each cell culture dish, three to five fields of views (FOVs) were alternatively taken with an exposure time of 3 s for each channel. In order to decrease the fluorescence background, the culture medium RPMI 1640 was replaced with Live Cell Imaging Solution (LCIS, Life Technologies) 1 h before imaging. LCIS can keep cells healthy for up to 4 hours at ambient atmosphere and temperature. To make sure light exposure did not cause photobleaching in living cells, ten images were acquired consecutively at exposure time of 1 s. The fluorescence intensity of the tenth image did not show a significant difference from that of the first image.
To validate that the fluorescence signals came from NADH and FAD, rotenone (a mitochondrial inhibitor) dissolved in DMSO was added to MCF-7 cells (final concentration 10 μM, treatment time 5 min before imaging) to observe the responses of NADH and FAD signals in the presence of 10 mM glucose in the imaging solution. We also measured the redox ratios of four breast cancer cell lines (MDA-MB-231, MDA-MB-468, MCF-7, and SKBr3 cells). The microenvironmental changes of MDA-MB-231 and MCF-7 cells were achieved by adding no glucose to the media (starvation) or adding glutamine, lactate, or pyruvate (final concentration 20 mM for each nutrient in the presence of 10 mM glucose) 1 h before imaging. The reference condition was 10 mM glucose in LCIS.
For data analysis, we calibrated the excitation light intensity according to the photosensor readings that was automatically recorded for each channel as the intensity of illumination on the samples. The FAD/ NADH ratio images were constructed from FAD and NADH images pixel by pixel. The background intensity of each channel was obtained from a randomly selected cell-free area. FAD and NADH intensities were calculated by first subtracting their background intensity, respectively, then thresholding at the three times of the standard deviation of the background. For individual FOVs, the mean values for both FAD and NADH were calculated, and the value of FAD/NADH was calculated by the FAD mean value divided by the NADH mean value. The FAD, NADH, and FAD/NADH were finally reported as averages across all FOVs. For the experiments where four lines were imaged, the MDA-MB-231 cancer cell line was used as a reference, and the mean values of FAD, NADH, and FAD/NADH of other cell lines were normalized by dividing the respective reference values of MAD-MB-231. The standard errors of the means (SEM) and the p-values of Student’s t test were reported based on the number of FOVs.
3 Results
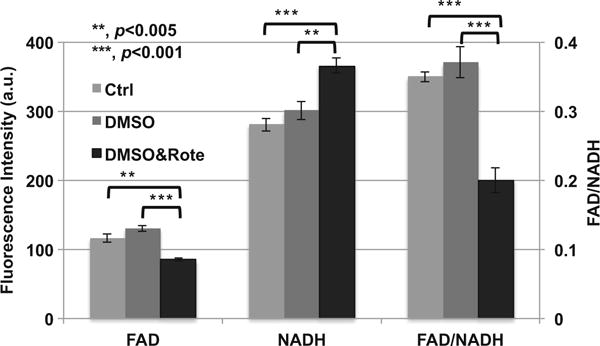
Figure 16.1 shows the effect of rotenone treatment on MCF-7 cells. Rotenone, as a mitochondrial inhibitor, can disrupt the electron transport chain in the mitochondria, and lead to a decreased production of ATP and cell death. Since DMSO was used as the solvent for rotenone, we also studied its effects on the cellular metabolic states. From Fig. 16.1 we can see that, after adding 8 μl DMSO to the imaging solution (1 ml), NADH, FAD, and FAD/NADH did not present statistical differences from the controls (p > 0.05). The small dose of DMSO did not have a significant effect on cellular redox state. Compared with the control or DMSO group, the rotenone treatment group (DMSO&Rote) had a significantly decreased FAD, increased NADH, and decreased FAD/NADH. Therefore, we demonstrated that rotenone treatment did lead to an accumulation of NADH and a decrease of FAD, and the cellular redox state became more reduced. These results were consistent with the reported effects of rotenone on mitochondrial energy pathways.
Fig. 16.1.

The addition of rotenone to MCF-7 cells (number of FOVs = 6 from two dishes at one experimental session) results in an increase in NADH fluorescence, a decrease in FAD fluorescence, and a decrease in FAD/NADH ratio. Left Y-axis is for NADH and FAD, and the right Y-axis for FAD/NADH ratio. Bar height represents the mean and error bar represents the standard error (SE). Ctrl represents the control group. There was 10 mM glucose in the imaging solution as the basic supply of nutrient for each of the three groups. For the DMSO group, 8 μl DMSO was added into 1 ml imaging solution. DMSO&Rote represents the group in which 8 μl DMSO with rotenone was added into 1 ml imaging solution. The final concentration of rotenone was 10 μM
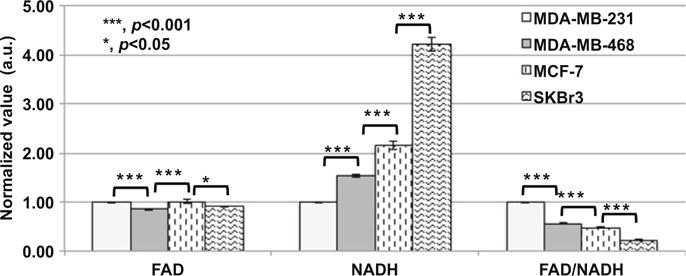
The imaging results comparing four breast cancer cell lines are shown in Fig. 16.2. The FAD of the MDA-MB-468 cells had the lowest intensity and was significantly lower than that of the MDA-MB-231 cells (p < 0.001). FAD of the MDA-MB-231 cells was not statistically different from that of the MCF-7 cells or the SKBr3 cells. However, NADH signals showed a very different rank order from that of FAD signals. NADH signals of these four cell lines followed the rank order: MDA-MB-231 <MDA-MB -468<MCF-7<SKBr3. Therefore, FAD/NADH ratio falls in the following rank order: MDA-MB-231>MDA-MB-468>MCF-7>SKBr3. This rank order is identical to the order of the invasive potential measured by Boyden chamber method as reported in literature [8, 9], i.e., when the invasive potential is higher, the FAD/NADH ratio is also consistently higher.
Fig. 16.2.

Normalized FAD, NADH, and FAD/NADH values of MDA-MB-231, MDA-MB-468, MCF-7, and SKBr3 breast cancer cell lines (three experiments at different days, duplicated dishes each time, with total number of FOVs = 24). There was 10 mM glucose in the imaging solutions of all groups. Bar height represents the mean and the error bar represents the SE
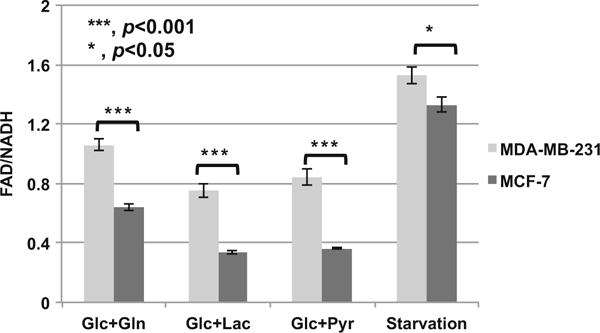
From the above results, we postulated that metabolic fluorescence signals effectively differentiate between breast cancer cells with different invasive potential in the case of a sufficient supply of glucose (10 mM glucose in the imaging solution). When cells were under starvation, by comparing the MDA-MB-231 cells with higher invasive potential and MCF-7 cells with lower invasive potential, we still found significant differences in the metabolic fluorescence signals of two cell lines. Despite that redox ratio difference between the two lines was mitigated compared to the control condition with high glucose (Fig. 16.2), FAD/NADH of the more invasive MDA-MB-231 cells was significantly higher than that of the less invasive MCF-7 cells (Fig. 16.3). We came to the same conclusion for redox ratios when cells with glucose were additionally supplied with 20 mM glutamine, lactate, or pyruvate, respectively (Fig. 16.3). Therefore, even though the redox state was dependent on the nutrition supplies or micro-environmental conditions, the relative correlation between the redox ratio and invasive potential was maintained for these two breast tumor cell lines.
Fig. 16.3.

Comparison of FAD/NADH ratios of MDA-MB-231 and MCF-7 when the microenvironments were changed (three experiments at different days, duplicated dishes each time, with total number of FOVs = 24). Starvation indicates there was no nutrition in the media. Glc+Gln, Glc+Lac, and Glc+Pyr represent 10 mM glucose + 20 mM glutamine, 10 mM glucose + 20 mM lactate, and 10 mM glucose + 20 mM pyruvate in the media, respectively
4 Discussions and Conclusions
In this study, the endogenous fluorescence signals of four breast cancer cell lines measured in vitro demonstrated a correlation between the higher redox ratios and their rank order of invasive potentials using reported results in the literature. We acknowledge that the rank order of invasive potential between some breast cancer lines (e.g. MCF7 vs. SKBR3) might not be consistent among the literature reports [8–11]. In our future study, we should measure the invasive potential of cancer cell lines via Boyden chamber and directly test the correlation between the invasiveness and redox ratios. Even though the redox states of the cancer cells changed when their microenvironments were changed, the endogenous fluorescent metabolic signals still effectively distinguished between the highly invasive cells and the slightly invasive ones; furthermore, the positive correlation between the rank order of invasive potentials and the redox ratio was maintained. The results from this study are consistent with our previous results obtained with cancer mouse xenografts [5,6]. These results suggest the potential value of optical redox imaging for predicting tumor invasive/ metastatic potential in clinical practice so that physicians may tailor therapy based on redox indices. Indeed we have applied the method to imaging clinical specimens of breast cancer patients [12–14]. Work is in progress to test whether optical redox imaging indices have any prognostic values.
Lastly we note that our experiments did not measure and control the pH and pO2 in cell cultures, which may affect redox state as well. In the future we will investigate whether these factors will affect the correlation between the redox ratio and invasive potential of cancer cells.
Acknowledgments
The work was financially supported in part by grants from the US National Institute of Health (R01-CA155348 and CA191207). This work was also supported and funded by the China’s Program of Introducing Talents to Universities on Photonics and Optoelectronics Science & Technology (111 Plan Program No. B07038).
Contributor Information
Nannan Sun, Department of Radiology, Perelman School of Medicine, University of Pennsylvania, Philadelphia, PA, USA; Britton Chance Laboratory of Redox Imaging, Johnson Research Foundation, Perelman School of Medicine, University of Pennsylvania, Philadelphia, PA, USA; Department of Biomedical Engineering, MoE Key Laboratory for Biomedical Photonics, Huazhong University of Science and Technology, Wuhan, Hubei, China; Britton Chance Center for Biomedical Photonics, Wuhan National Laboratory for Optoelectronics, Wuhan, Hubei, China.
He N. Xu, Department of Radiology, Perelman School of Medicine, University of Pennsylvania, Philadelphia, PA, USA Britton Chance Laboratory of Redox Imaging, Johnson Research Foundation, Perelman School of Medicine, University of Pennsylvania, Philadelphia, PA, USA.
Qingming Luo, Britton Chance Center for Biomedical Photonics, Wuhan National Laboratory for Optoelectronics, Huazhong University of Science and Technology, Wuhan, Hubei, China.
Lin Z. Li, Molecular Imaging Laboratory, Department of Radiology, Perelman School of Medicine, University of Pennsylvania, Philadelphia, PA, USA. Britton Chance Laboratory of Redox Imaging, Johnson Research Foundation, Perelman School of Medicine, University of Pennsylvania, Philadelphia, PA, USA
References
- 1.Roth BJ, Krilov L, Adams S, et al. Clinical cancer advances 2012: annual report on progress against cancer from the american society of clinical oncology. J Clin Oncol. 2013;31(1):131–161. doi: 10.1200/JCO.2012.47.1938. [DOI] [PubMed] [Google Scholar]
- 2.DeSantis C, Siegel R, Bandi P, et al. Breast cancer statistics, 2011. CA Cancer J Clin. 2011;61(6):409–418. doi: 10.3322/caac.20134. [DOI] [PubMed] [Google Scholar]
- 3.Cianfrocca M, Goldstein LJ. Prognostic and predictive factors in early-stage breast cancer. Oncologist. 2004;9:606–616. doi: 10.1634/theoncologist.9-6-606. [DOI] [PubMed] [Google Scholar]
- 4.Chance B, Schoener B, Oshino R, et al. Oxidation-reduction ratio studies of mitochondria in freeze-trapped samples. NADH and flavoprotein fluorescence signals. J Biol Chem. 1979;254(11):4764–4771. [PubMed] [Google Scholar]
- 5.Li LZ, Xu HN, Ranji M, et al. Mitochondrial redox imaging for cancer diagnostic and therapeutic studies. J Innov Opt Health Sci. 2009;2(4):325–341. doi: 10.1142/S1793545809000735. [DOI] [PMC free article] [PubMed] [Google Scholar]
- 6.Li LZ, Zhou R, Xu HN, et al. Quantitative magnetic resonance and optical imaging biomarkers of melanoma metastatic potential. Proc Natl Acad Sci USA. 2009;106:6608–6613. doi: 10.1073/pnas.0901807106. [DOI] [PMC free article] [PubMed] [Google Scholar]
- 7.Xu HN, Nioka S, Glickson J, et al. Quantitative mitochondrial redox imaging of breast cancer metastatic potential. J Biomed Opt. 2010;15:036010. doi: 10.1117/1.3431714. [DOI] [PMC free article] [PubMed] [Google Scholar]
- 8.Thompson EW, Paik S, Brunner N, et al. Association of increased basement membrane invasiveness with absence of estrogen receptor and expression of vimentin in human breast cancer cell lines. J Cell Physiol. 1992;150:534–544. doi: 10.1002/jcp.1041500314. [DOI] [PubMed] [Google Scholar]
- 9.Freund A, Chauveau C, Brouillet JP, et al. IL-8 expression and its possible relationship with estrogen-receptor-negative status of breast cancer cells. Oncogene. 2003;22(2):256–265. doi: 10.1038/sj.onc.1206113. [DOI] [PMC free article] [PubMed] [Google Scholar]
- 10.Neve RM, Chin K, Fridlyand J, et al. A collection of breast cancer cell lines for the study of functionally distinct cancer subtypes. Cancer Cell. 2006;10(6):515–527. doi: 10.1016/j.ccr.2006.10.008. [DOI] [PMC free article] [PubMed] [Google Scholar]
- 11.Gordon LA, Mulligan KT, Maxwell-Jones H, et al. Breast cell invasive potential relates to the myoepithelial phenotype. Int J Cancer. 2003;106(1):8–16. doi: 10.1002/ijc.11172. [DOI] [PubMed] [Google Scholar]
- 12.Xu HN, Tchou J, Chance B, et al. Imaging the redox states of human breast cancer core biopsies. Adv Exp Med Biol. 2013;765:343–349. doi: 10.1007/978-1-4614-4989-8_48. [DOI] [PMC free article] [PubMed] [Google Scholar]
- 13.Xu HN, Tchou J, Li LZ. Redox imaging of human breast cancer core biopsies: a preliminary investigation. Acad Radiol. 2013;20:764–768. doi: 10.1016/j.acra.2013.02.006. [DOI] [PMC free article] [PubMed] [Google Scholar]
- 14.Xu HN, Li LZ. Redox subpopulations and the risk of cancer progression: A new method for characterizing redox heterogeneity. Proc SPIE. 2016;9689:96893Z-1-7. [Google Scholar]


