

Abstract
Under covariate adaptive randomization, the covariate is tied to both randomization and analysis. Misclassification of such covariate will impact the intended treatment assignment; further, it is unclear what the appropriate analysis strategy should be. We explore the impact of such misclassification on the trial’s statistical operating characteristics. Simulation scenarios were created based on the misclassification rate and the covariate effect on the outcome. Models including unadjusted, adjusted for the misclassified, or adjusted for the corrected covariate, were compared using logistic regression for a binary outcome and Poisson regression for a count outcome. For the binary outcome using logistic regression, type I error can be maintained in the adjusted model but the test is conservative using an unadjusted model. Power decreased with both increasing covariate effect on the outcome as well as the misclassification rate. Treatment effect estimates were biased towards the null for both the misclassified and unadjusted models. For the count outcome using a Poisson model, covariate misclassification led to inflated type I error probabilities and reduced power in the misclassified and the unadjusted model. The impact of covariate misclassification under covariate-adaptive randomization differs depending on the underlying distribution of the outcome.
Keywords: Covariate-adaptive randomization, Generalized linear regression, Covariate misclassification
1. Introduction
The randomized controlled trial (RCT) is considered the gold standard for valid inference regarding the efficacy of an intervention. One of the key elements of an RCT is its randomization procedure which assures the validity and generalizability of the trial’s results. Simple randomization is often used due to its ease of implementation; however, large imbalance in baseline covariates across treatment arms may result, especially when sample size is not sufficiently large. Covariate-adaptive randomization has been frequently used in order to control the imbalance.1–8 A trial well-balanced on prognostic covariates is more powerful in the comparison of the treatment effect and yields a more convincing result.9 However, under covariate-adaptive randomization, the intended type I error probability can be maintained only when the model is correctly specified, which means that all covariates included in the randomization procedure are also included in the analytic model.10,11
Unfortunately, covariates are sometimes measured with error, and in the case of categorical covariates, we consider these subjects to be misclassified. The rate of misclassification may vary from trial to trial and from covariate to covariate. For example, according to the review of Data and Safety Monitoring Board, in the Interventional Management of Stroke (IMS) III trial,12 about 2% of subjects with severe stroke were misclassified as having a moderate stroke, and similarly about 2% of subjects with moderate stroke were misclassified as having a severe stroke at the time of randomization. In the Progesterone for Traumatic Brain Injury: Experimental Clinical Treatment (ProTECT™ III) trial,13 8% of the subjects with most severe traumatic brain injury (TBI) were misclassified as having a moderate to severe TBI; 7% and 3% of moderate severe TBI were misclassified as having a most severe and moderate TBI, respectively; 1% and 14% of moderate TBI were misclassified as most severe and moderate severe TBI.
Under the covariate-adaptive randomization scheme, the treatment assignment is tied to the misclassified covariate; as a result, it is not clear whether the analysis should be based on the misclassified covariate information or the corrected data. Intuitively, corrected values are preferred when available; however, under intention to treat (ITT) analysis, misclassified variables should be analyzed in order to remain true to the randomization scheme. Naïve analysis which ignores the misclassification (either via a model with misclassified covariates or without adjustment) may cause biased estimates of the treatment effect, which may directly impact the power of the trial, as well as its validity and reliability.14–19 Moreover, unlike simple randomization, covariate-adaptive randomization may have some “add-on” effect, especially on the power and/or type I error. Therefore, it is important to understand the impact of misclassification errors in the context of RCTs, where the power, type I error and bias in the treatment effect are important components to the success of a trial.
With classic linear regression, if the covariate is only correlated with the outcome but not the treatment, an unbiased estimate for treatment effect can always be obtained whether or not that covariate is included in the model.20 Therefore, covariate misclassification will not impact the point estimate of the treatment effect but will reduce the power of hypothesis testing for the treatment effect. Under the generalized linear regression frame work, where the outcomes have an underlying binomial or Poisson distribution, the impact of covariate adjustment is different.20 For a binary outcome with logistic regression, if the true outcome distribution is conditioned on the covariate (i.e. there is covariate effect on the outcome), failure to adjust for the covariate results in a biased estimate for the treatment effect.20,21 On the other hand, inclusion of the covariate increases the variance of the estimate for the treatment effect. That is, adjusting for a prognostic covariate will reduce the precision of the treatment effect estimate, but still results in power gain for the test of treatment in terms of the asymptotic relative efficiency.20
Given the above impact of covariate adjustment in both randomization and analysis, it is necessary to explore the influence of covariate misclassification on type I error, power and estimation bias for the treatment effect under covariate-adaptive randomization. In this paper, we investigate this impact, with a focus on analysis via generalized linear regression models in the scenario where the true covariate value is available at the time of the analysis. We provide the results of a simulation study conducted under covariate-adaptive randomization. Section 2 provides a theoretical explanation for the simulation result. The simulation methods are described in Section 3 and the results shown and explained in Section 4. We provide the conclusion and discussion about the impact in practice and some recommendations in the last section.
2. The validity of the tests when covariate is misclassified
2.1 Outcome with underlying binomial distribution
Shao et al.11 has shown that under covariate-adaptive randomization, the nominal level of the test will be maintained only when the covariates are adjusted for in the analysis; the test without covariates is conservative unless there is no covariate effect on the outcome. When the covariate adjusted for is misclassified, the nominal level of the test will still be maintained. To show this, suppose a pooled table and sub-tables are set up as in Table 1; where Y, Z, X and G represent outcome, treatment assignment, true covariate and misclassified covariate respectively. The prevalence of the covariate in the data is m, i.e. .
Table 1.
Expected cell frequencies for pooled and sub-tables
| Pooled Table | Sub-table X = 1 | Sub-table X = 0 | |||||||||
|---|---|---|---|---|---|---|---|---|---|---|---|
|
| |||||||||||
| Y = 1 | Y = 0 | Total | Y = 1 | Y = 0 | Total | Y = 1 | Y = 0 | Total | |||
| Z=1 | a | b | N1 | Z=1 | a1 | b1 | N1m | Z=1 | a0 | b0 | N1(1−m) |
| Z=0 | c | d | N0 | Z=0 | c1 | d1 | N0m | Z=0 | c0 | d0 | N0(1−m) |
Assume the misclassification probabilities are non-differential with respect to the outcome Y, i.e. . Then the resulting expected cell frequencies for the sub-tables stratified by the misclassified covariate G are in Table 2.Then,
| (2.1) |
| (2.2) |
Under the null distribution where there is no treatment effect, given , the probabilities in (2.1) and (2.2) are equal, i.e. . This can also be written as , where t is the constant ratio between a1 and c1, as well as N1 and N0. Then a1 and N1 can be expressed as a1=tc1 and N1=tN0. The ratio between a0 and c0 equals to t as well because given X=0, under the null distribution, and .When there is misclassification as in Table 2, the probability of Y=1 can be expressed as:
| (2.3) |
| (2.4) |
Using the ratio notation defined above, then, (2.3) becomes
That is, although the proportion of is altered by the misclassification process from (2.1) to (2.3), the magnitude of the change is the same across treatment arms under the null distribution. Thus, if there is no treatment effect given the true covariate value X=1, there is no treatment effect given the misclassified covariate . The same approach can be used to demonstrate the impact given and .Therefore, the type I error probability is not affected by the misclassifi-cation, regardless of whether adjustment is made for the true covariate or the misclassified covariate.
Table 2.
Expected cell frequencies for sub-tables by misclassified covariate
| Sub-table G = 1 | Sub-table G = 0 | ||||||
|---|---|---|---|---|---|---|---|
|
| |||||||
| Y = 1 | Y = 0 | Total | Y = 1 | Y = 0 | Total | ||
|
|
|
||||||
| Z=1 | a1*(1−k1) +a0*k0 | b1*(1−k1) +b0*k0 | N1(1−m)*k0 + N1m*(1−k1) | Z=1 | a1*k1+ a0*(1−k0) | b1*k1+ b0*(1−k0) | N1m *(1−k0) + N1(1−m)*k1 |
|
|
|
||||||
| Z=0 | c1*(1−k1) +c0*k0 | d1*(1−k1) +d0*k0 | N0(1−m)*k0 + N0m*(1−k1) | Z=0 | c1*k1+ c0*(1−k0) | d1*k1+ d0*(1−k0) | N0m *(1−k0) + N0(1−m)*k1 |
2.2 Outcome with underlying Poisson distribution
The asymptotic property of the Poisson log-linear regression models was also developed by Shao et al.11. With the quasi-Poisson regression models, the estimated variability of the outcome based on the unadjusted model then becomes , where is the estimated over-dispersion parameter and is greater than 1 if the data are over-dispersed. Therefore, an extension to the equation in Shao et al. becomes:
, which reduces to , and the test is conservative in the unadjusted model of quasi-Poisson regression under covariate-adaptive randomization. However, the estimated over-dispersion parameter in a naïve model of quasi-Poisson regression will depend on the amount of misclassification in G, the misclassified covariate. And the overall variability could be estimated correctly. Thus the type I error could be maintained. The same rationale works for the negative binomial regression model.
3. Simulation scenarios and hypothesis testing
Suppose a randomized controlled trial is going to be carried out with a goal of detecting an absolute 10% difference in a favorable outcome, with a 40% success rate assumed in the control group. This yields an unadjusted odds ratio of 1.5 for the treatment effect. A sample size of 1,000 (500 subjects per group) is estimated in order to obtain 90% power to detect this unadjusted effect at a 5% significance level. This is similar to the assumptions specified in the IMS III trial design.12 For each scenario described below, 10,000 trials are simulated using Monte Carlo simulation method. The operating characteristics – type I error, power and bias with respect to the treatment effect – are compared between simple randomization and covariate-adaptive randomization.
In each trial, there are three variables of primary interest: Z is a dichotomous treatment assignment, X is a prognostic covariate which is dichotomous and subject to misclassification, and Y is the outcome of interest. We assume Z is perfectly measured (i.e., recorded without error). We also assume that the misclassification error of X is non-differential with respect to the treatment and the covariate itself, i.e. the misclassification probabilities are the same for both treatment arms as well as at both levels of the covariate. No interaction between the treatment effect and the covariate is considered. Dichotomized variables X and Z are generated from a Bernoulli distribution with p = 0.5, i.e. Prob(X = 1) = Prob(X = 0) = Prob(Z = 1) = Prob(Z = 0) = 0.5. A misclassified version of X, denoted as G, is also generated, with the same misclassification rates for each level of X (i.e. Prob(G = 1| X = 0) = Prob (G = 0 | X= 1)), varying from 0 to 40%. Under simple randomization, X (as well as G) and Z are generated independently, while under covariate-adaptive randomization, Z is generated within each level of G, the misclassified version of the covariate. Both permuted block randomization and biased-coin randomization are incorporated for covariate-adaptive randomization. Based on published recommendations, the block size for permuted block randomization is set at 4,22,23 and the probability assigned to the biased-coin is 0.8524,25.
We investigate two different types of outcome, binary and count data, both of which are analyzed using generalized linear regression models. For the dichotomous outcome, the response variable Y is generated from a Bernoulli distribution; when the outcome represents count data, the response variable Y is generated from a Poisson distribution. In both cases, the linear combination of X (the correct version of the covariate), Z (treatment assignment), and their corresponding prespecified coefficients are used to define the distributional parameters: the probability for the Bernoulli distribution and the rate for the Poisson distribution. For both outcomes, the beta coefficient for Z is fixed at 0.405 under all scenarios. This is equivalent to either an unadjusted OR of 1.5 or rate ratio of 1.5 between treatment groups. For logistic regression, the coefficient for X also varies from −3 to +3, which results in a wide range of X effects on Y on the scale of odds ratio (ranged from 0.064 to 23.2). For Poisson log-linear regression, the coefficient for X is fixed at 1.6 (rate ratio = 4.95) with varying misclassification rate.
Hypothesis testing for the effect of treatment Z is based on three analysis approaches (described below) applied to the simulated data. All models include treatment Z. Model (1) is the true model, adjusting for the corrected version of the covariate X. Model (2) is the misclassified model, adjusting for the misclassified covariate G. Model (3) is the unadjusted model including only treatment Z:
| (1) |
| (2) |
| (3) |
In each model, g(p) is the link function – logit when Y is binary or log when Y is count; p is parameter for the distribution, either Prob (Y=1 |·) or Pois(λ|·). For count data, in addition to the Poisson log-linear regression, quasi-Poisson and negative binomial regression are also considered given the potential in practice for over-dispersion.
4. Simulation Results
Figures 1–6 show the results under simple randomization (Panel A) and that under covariate-adaptive randomization (Panel B). We only present the results under stratified permuted block randomization for covariate-adaptive randomization, because the results are similar under stratified permuted block randomization and stratified biased coin randomization. Supplemental Tables S1–S3 provide detailed numerical examples with pre-specified coefficients describing and comparing the change pattern for type I error, power and bias. Throughout the simulation, the bias is defined as the difference between the estimated beta coefficient and 0.405, the true parameter value.
Figure 1.

Change pattern of Type I error under simple randomization (Panel A) and under covariate-adaptive randomization (Panel B). Each plot represents a different misclassification rate of 0, 0.10, 0.25, and 0.40. The X-axis represents the beta coefficients of the covariate, which ranged from −3 to +3.
Figure 6.
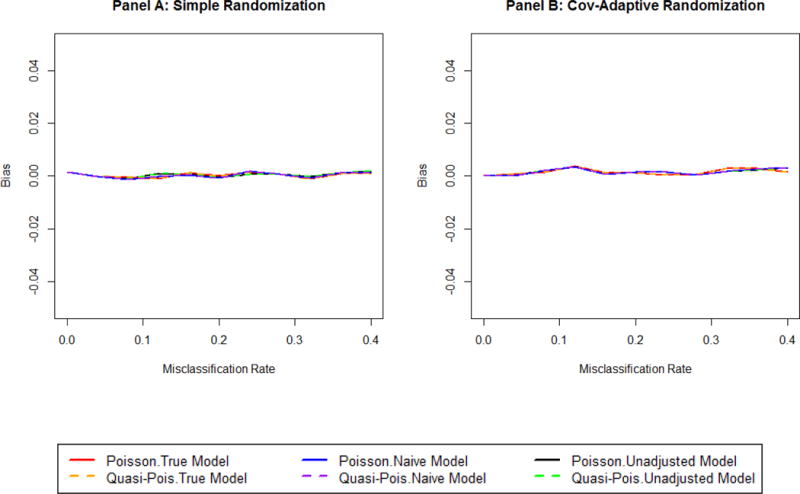
Change pattern of bias for count data under simple randomization (Panel A) and Cov-Adaptive randomization (Panel B) using Poisson regression (solid lines: True, red; Naïve, blue; Unadjusted, black) and quasi-Poisson regression (dashed lines: True, orange; Naïve, purple; Unadjusted, green). βx = 1.6; βz = 0.4, λtreat/ λcontrol = 1.5
4.1 Dichotomized outcome: logistic regression with logit link
The operating characteristics for each model are presented as follows: the true model (Model (1)) is represented in red, the misclassified or naive model (Model (2)) is represented in blue, and the unadjusted model (Model (3)) is represented in black.
4.1.1 Under simple randomization
Under simple randomization, where covariate information is not adjusted for during the randomization process, misclassification impacts the hypothesis testing and parameter estimation only through covariate adjustment in the analysis. The type I error is maintained in all three models (Figure 1, Panel A)The true model has the smallest power loss, while the unadjusted model has maximum power loss (Figure 2 Panel A). The power loss of the misclassified model depends on the misclassification rate, as well as the magnitude of the effect of covariate X on the outcome Y. With increasing rate of misclassification or increasing magnitude of the effect of covariate X, the amount of power loss increases. As expected based on the literature19,21, the estimated beta coefficient of treatment Z is biased towards the null in the unadjusted model, while the estimate in the true model is unbiased (Figure 3 Panel A). The direction of the bias caused by misclassification in the misclassified model is the same as that caused by failing to adjust, and is towards the null. The magnitude of this bias in the adjusted misclassified model increases with increasing misclassification rates as well as with increasing absolute magnitude ofβx, the covariate effect.
Figure 2.

Change pattern of Power under simple randomization (Panel A) and under covariate-adaptive randomization (Panel B). Each plot represents a different misclassification rate of 0, 0.10, 0.25, and 0.40. The X-axis represents the beta coefficients of the covariate, which ranged from −3 to +3.
Figure 3.
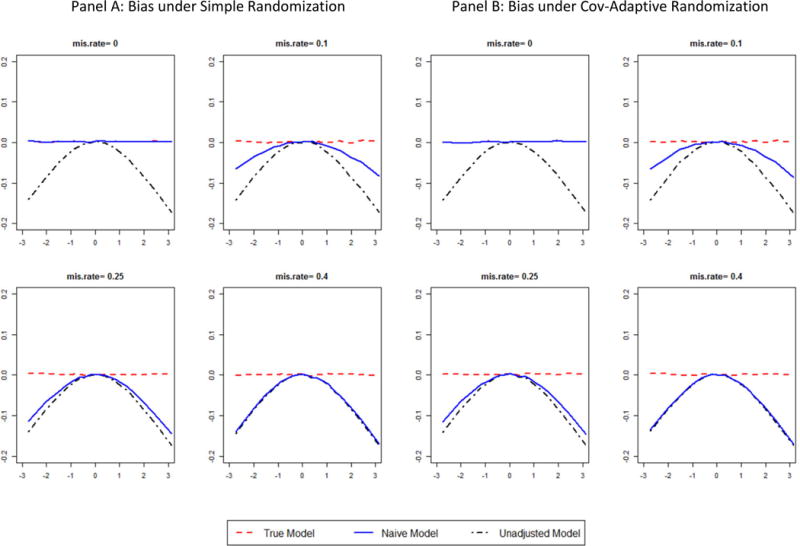
Change pattern of Bias under simple randomization (Panel A) and under covariate-adaptive randomization (Panel B). Each plot represents a different misclassification rate of 0, 0.10, 0.25, and 0.40. The X-axis represents the beta coefficients of the covariate, which ranged from −3 to +3. Bias is defined as the difference between the estimated beta coefficient and 0.405, the true parameter value.
4.1.2 Under covariate-adaptive randomization
Under covariate-adaptive randomization, information from covariate G is adjusted for during the randomization. Either X or G is adjusted for in the final analytic model. Hypothesis testing for the treatment effect is conservative using the unadjusted model, while both the misclassified model and the true model preserve the nominal type I error (Figure 1 Panel B). With increasing misclassification rate, the type I error of the unadjusted model approaches the nominal level.
The impact of covariate misclassification on power under covariate-adaptive randomization is the same as that under simple randomization (Figure 2) with respect to both the pattern and magnitude of the impact. The true models have the smallest power loss under all scenarios. The magnitude of power loss is not trivial using the unadjusted model when the covariate effect is large relative to the treatment effect. The power loss caused by adjusting for the misclassified covariate depends on both the magnitude of the covariate effect as well as the misclassification rate, similar to what is observed for simple randomization. For example, when βx= −2.0 and βz=0.405, the power of the true model is about 80%, while the power of the unadjusted model is only 70%, although the study is designed to have 90% power. The power for the misclassified model is in between that of the true model and the unadjusted model. A direct comparison between simple randomization and covariate- adaptive randomization can be seen in the supplementary document (Figure S1). The resulting power for the unadjusted/ misclassified/true model under covariate-adaptive randomization is very close to each of those under simple randomization.
Also, the pattern in the changes in the bias under covariate-adaptive randomization was similar to that under simple randomization (Figure 3). The maximum bias was observed in the unadjusted model; with approximately 10% misclassification, the bias observed in the misclassified model was about a half of what was observed in the unadjusted model. At higher rates of misclassification (30% or higher), adjusting for a misclassified covariate was similar to not adjusting for the covariate in terms of bias in the estimated treatment effect.
4.2 Count of events as outcome: Poisson, quasi-Poisson and negative binomial regression with log link
For the simulated count data, we fit 3 sets of log-linear regression models: Poisson regression, quasi-Poisson regression and negative binomial regression. Each set of regression models includes an unadjusted model, a model adjusted for the misclassified covariate and a model adjusted for the corrected covariate.
With Poisson regression (Figure 4–6, solid lines), under simple randomization the type I error (Figure 4 Panel A) is maintained only in the true model (red line). Both the unadjusted (black line) and misclassified (blue line) models have inflated type I error probabilities, with the magnitude of inflation increasing with increasing misclassification rate in the misclassified model, and maximized in the unadjusted model. Pre-specified power (Figure 5 Panel A) is obtained using the true model only. The unadjusted model has the maximum power loss, and the power loss observed in the misclassified model increases with increasing misclassification rate. No bias (Figure 6 Panel A) is observed for the estimate of the treatment effect in any of three models. Under covariate-adaptive randomization, the true model (red line) maintained the type I error (Figure 4 Panel B) at the nominal level. In data with no misclassification, the type I error is also maintained in the unadjusted model (black line). However, with increasing misclassification rate, type I error probabilities are inflated in both the unadjusted (black line) and misclassified (blue line) models with a similar magnitude. The loss in power under covariate –adaptive randomization (Figure 5 Panel B) is similar to that under simple randomization. Bias is neglegible for all three models (Figure 6 Panel B).
Figure 4.

Change pattern of Type I error for count data under simple randomization (Panel A) and Cov-Adaptive randomization (Panel B) using Poisson regression (solid lines: True, red; Naïve, blue; Unadjusted, black) and quasi-Poisson regression (dashed lines: True, orange; Naïve, purple; Unadjusted, green). βx = 1.6; βz = 0.4, λtreat/ λcontrol = 1.5.
Figure 5.

Change pattern of power for count data under simple randomization (Panel A) and Cov-Adaptive randomization (Panel B) using Poisson regression (solid lines: True, red; Naïve, blue; Unadjusted, black) and quasi-Poisson regression (dashed lines: True, orange; Naïve, purple; Unadjusted, green). βx = 1.6; βz = 0.4, λtreat/ λcontrol = 1.5.
Quasi-Poisson regression and negative binomial regression behave similarly to each other. To better demonstrate graphically, only results of quasi-Poisson regression are shown in Figure 4–6 (dashed lines).While use of the quasi-Poisson or negative binomial regression captures the over-dispersion described earlier, the target power is maintained only by the true model. In fact, failure to adjust is associated with an even larger power reduction for these over-dispersed models than for the typical Poisson regression model. As previously demonstrated, the magnitude of power loss in the misclassified models depends on the misclassification rate. Under simple randomization (Figure 4, Panel A), all models maintain the nominal type I error. However, using the unadjusted quasi-Poisson (green line) or negative binomial regression model (result not shown), more significant power loss than that of the unadjusted Poisson regression model (black line) is identified. The magnitude of power loss in the misclassified models (purple line) depends on the misclassification rate. Under covariate-adaptive randomization (Figure 4, Panel B), both of the adjusted models with either the true covariate (orange line) or the misclassified covariate (purple line) maintains type I error, while the unadjusted models are conservative. The misclassified models again demonstrate substantial power loss (almost double) compared to that of the misclassified Poisson model (blue solid line). The estimated dispersion parameter increases in the misclassified model (Figure 7) as well, where the estimated dispersion parameter is maximized in the unadjusted model and fixed, regardless of the misclassification rate. Again, no bias is identified in any of the models under either randomization procedure.
Figure 7.

Estimated overdispersion parameter for quasi-Poisson model
4. Conclusions and discussion
When the misclassification rate is high, covariate-adaptive randomization performs more like simple randomization. With increasing misclassification rate, especially when the misclassification rate is relatively large (e.g. 40%), the covariates are not informative during the covariate-adaptive randomization process. Under simple randomization, where the covariate is not involved during randomization procedure, covariate misclassification will only cause power loss and biased estimation through analytic models, and this result is consistent with the literature.15, 19, 20 However, the results under covariate-adaptive randomization indicate that the impact of the randomization scheme depends on the underlying distribution of the outcome.
For binary outcome with logistic regression, covariate-adaptive randomization does not have an additive effect on bias and power loss caused by covariate misclassification, even when the misclassified covariate is adjusted for in the randomization procedure and in the model. While the type I error probability can be maintained through adjustment for the misclassified covariate, the resulting power is less than targeted, whereas adjustment for the corrected covariate will minimize the power loss and maintain nominal type I error probability. The bias of the estimate for the treatment effect has the same direction in the misclassified model as that in the unadjusted model, with a smaller magnitude in the misclassified model. The magnitude of the bias depends on the misclassification rate as well as the effect of the covariate on the outcome. The amount of bias and power loss is not trivial, especially when the covariate effect on the outcome is relatively large compared to the treatment effect. The operating characteristics of misclassified models are more similar to that of the unadjusted models as the misclassification rate increases. The results presented pertain to the scenario where the covariate prevalence is 50% (i.e. ). Additional simulations (results presented in the supplementary document, Figure S2) demonstrate that, for a given covariate effect and misclassification rate, the effect of the misclassification on the power and the bias is slightly lessened when the covariate prevalence is away from 50%, but the pattern remains the same. This is likely because the variability in the covariate is maximized when the prevalence is 50%. When the prevalence is much larger than 50%, the information gained by inclusion of the covariate is reduced, as is the noise introduced by the misclassification.
For count of events with Poisson regression, on the other hand, the randomization scheme does have additional influence on power and type I error. No bias is observed using either an adjusted or unadjusted model under either randomization scheme. This is consistent with the finding by John et al.19 and Gail et al.21 Under simple randomization, the magnitude of power loss and type I error inflation is maximized in the unadjusted model regardless of covariate misclassification, but increases with increasing misclassification rates in the misclassified model. However, under covariate-adaptive randomization, the operating characteristics of the misclassified model and the unadjusted model are similar, where power loss and type I error rate inflation in both models depends on the rate of misclassification.
Due to misclassification, only part of the variability of the covariate is accounted for through the randomization procedure. With either the unadjusted model which excludes the covariate or the misclassified model, the “residual” variability due to the covariate results in over-dispersion. This over-dispersion will not be estimated correctly using Poisson regression since the estimated variance is assumed to be equal to the expected count. Thus under covariate-adaptive randomization, with Poisson regression, the variability for the outcome in an unadjusted model or misclassified model will be underestimated with the amount depending on the misclassification rate. As a result, power is reduced and type I error is inflated. Quasi-Poisson and negative binomial models are very often used for data with anticipated over-dispersion. Given the flexibility to estimate the variance differently from the expected count in these two models, the variability in the covariate, which is not sufficiently accounted for because of covariate misclassification during randomization, can be estimated through the adjusted model. However, with the unadjusted model, where no information about the covariate is included in the model, the amount of “residual” variability can’t be accurately estimated. Instead, the unadjusted quasi-Poisson and negative binomial models will be estimating over-dispersion, which does not truly exist (or at least partly) since the variability (or part of the variability) of the covariate is eliminated under covariate-adaptive randomization.
The work described herein assumes that the true value of the prognostic covariate is observable, which is not always the case. The main purpose is to show how misclassification in the covariates affects the estimation of the treatment effect. The results remain relevant when the truth is not observable, although the manner in which such misclassification would be identified and corrected is left as a topic for future work. One limitation of this work is that we only considered non-differential misclassification of the covariate with respect to treatment assignment; differential misclassification may have more complicated impact on the treatment effect estimation if the treatment effect itself is expected to vary according to the covariate. In addition, we only investigated two types of covariate-adaptive randomization, other randomization algorithms may also be considered in the future.
Overall, adjustment for the covariate is always recommended in the final analysis even when the quality of the covariate is questionable. Effort should be made to identify potential misclassification and adjust for the corrected covariate in the analysis in order to minimize power loss and to more accurately estimate the treatment effect. On the other hand, given the fact that the effect of prognostic covariates on the outcome reported in the literature varies, statistical methods, and perhaps sample size reassessment, should be considered to correct the bias in estimating treatment effect if there is anticipated or observed covariate misclassification.
Supplementary Material
Acknowledgments
Funding
This work is supported by a National Institute of Neurological Disorders and Stroke (NINDS) grant, U01 NS054630, P.I.: Yuko Y. Palesch, Ph.D. and Neurological Emergencies Treatment Trials (NETT) Network grant, U01 NS059041, P.I.: Yuko Y. Palesch, Ph.D.
References
- 1.Thall PF, Wathen JK. Covariate-adjusted adaptive randomization in a sarcoma trial with multi-stage treatments. Stat Med. 2005;24:1947–64. doi: 10.1002/sim.2077. [DOI] [PubMed] [Google Scholar]
- 2.Krag DN, Anderson SJ, Julian TB, et al. Sentinel-lymph-node resection compared with conventional axillary-lymph-node dissection in clinically node-negative patients with breast cancer: overall survival findings from the NSABP B-32 randomised phase 3 trial. Lancet Oncol. 2010;11:927–33. doi: 10.1016/S1470-2045(10)70207-2. [DOI] [PMC free article] [PubMed] [Google Scholar]
- 3.Atagi S, Kawahara M, Yokoyama A, et al. Thoracic radiotherapy with or without daily low-dose carboplatin in elderly patients with non-small-cell lung cancer: a randomised, controlled, phase 3 trial by the Japan Clinical Oncology Group (JCOG0301) Lancet Oncol. 2012;13:671–8. doi: 10.1016/S1470-2045(12)70139-0. [DOI] [PubMed] [Google Scholar]
- 4.Sherrington C, Lord SR, Vogler CM, et al. A post-hospital home exercise program improved mobility but increased falls in older people: a randomised controlled trial. PloS one. 2014;9:e104412. doi: 10.1371/journal.pone.0104412. [DOI] [PMC free article] [PubMed] [Google Scholar]
- 5.Ellis RJ, Letendre S, Vaida F, et al. Randomized trial of central nervous system-targeted antiretrovirals for HIV-associated neurocognitive disorder. Clin Infect Dis. 2014;58:1015–22. doi: 10.1093/cid/cit921. [DOI] [PMC free article] [PubMed] [Google Scholar]
- 6.Ybarra ML, Holtrop JS, Prescott TL, et al. Pilot RCT results of stop my smoking USA: a text messaging-based smoking cessation program for young adults. Nicotine Tob Res. 2013;15:1388–99. doi: 10.1093/ntr/nts339. [DOI] [PMC free article] [PubMed] [Google Scholar]
- 7.Ersek M, Polissar N, Pen AD, et al. Addressing methodological challenges in implementing the nursing home pain management algorithm randomized controlled trial. Clin Trials. 2012;9:634–44. doi: 10.1177/1740774512454243. [DOI] [PMC free article] [PubMed] [Google Scholar]
- 8.Weir CJ, Lees KR. Comparison of stratification and adaptive methods for treatment allocation in an acute stroke clinical trial. Stat Med. 2003;22:705–26. doi: 10.1002/sim.1366. [DOI] [PubMed] [Google Scholar]
- 9.Kundt G. Comparative evaluation of balancing properties of stratified randomization procedures. Methods Inf Med. 2009;48:129–34. doi: 10.3414/ME0538. [DOI] [PubMed] [Google Scholar]
- 10.Hu Y, Hu F. Asymptotic properties of covariate-adaptive randomization. Ann Stat. 2012;40:1794–815. [Google Scholar]
- 11.Shao J, Yu X. Validity of tests under covariate-adaptive biased coin randomization and generalized linear models. Biometrics. 2013;69:960–9. doi: 10.1111/biom.12062. [DOI] [PubMed] [Google Scholar]
- 12.Joseph Broderick UoC. Interventional Management of Stroke Trial (IMS III): A Phase III Clinical Trial Examining Whether a Combined Intravenous (IV) and Intra-Arterial (IA) Approach to Recanalization is Superior to Standard IV Rt-PA (Activase®) Alone. Available from: http://clinicaltrials.gov/show/NCT00359424 NLM Identifier: NCT00359424.
- 13.David Wright EU. Phase 3 Clinical Trial to Determine if Progesterone Along With Standard Medical Care for Brain Injury is More Effective at Limiting the Amount of Damage Cause by a Traumatic Brain Injury Than Standard Medical Care Alone. Available from: http://clinicaltrials.gov/show/NCT00822900 NLM Identifier : NCT00822900.
- 14.Luo S, Chan W, Detry MA, et al. Binomial regression with a misclassified covariate and outcome. Stat Methods Med Res. 2012 Mar; doi: 10.1177/0962280212441965. [DOI] [PMC free article] [PubMed] [Google Scholar]
- 15.Greenland S. The effect of misclassification in the presence of covariates. Am J Epidemiol. 1980;112:564–9. doi: 10.1093/oxfordjournals.aje.a113025. [DOI] [PubMed] [Google Scholar]
- 16.Flegal KM, Brownie C, Haas JD. The effects of exposure misclassification on estimates of relative risk. Am J Epidemiol. 1986;123:736–51. doi: 10.1093/oxfordjournals.aje.a114294. [DOI] [PubMed] [Google Scholar]
- 17.Reade-Christopher SJ, Kupper LL. Effects of exposure misclassification on regression analyses of epidemiologic follow-up study data. Biometrics. 1991;47:535–48. [PubMed] [Google Scholar]
- 18.Spiegelman D, Rosner B, Logan R. Estimation and Inference for Logistic Regression with Covariate Misclassification and Measurement Error in Main Study/Validation Study Designs. Journal of the American Statistical Association. 2000;95:51–61. [Google Scholar]
- 19.John MNN, Jewell P. A geometric approach to assess bias due to omitted covariates in generalized linear models. Biometrika. 1993;80:807–15. [Google Scholar]
- 20.Robinson LD, Jewell NP. Some Surprising Results about Covariate Adjustment in Logistic Regression Models. Int Stat Rev. 1991;59:227–40. [Google Scholar]
- 21.Gail MH, Wieand S, Piantadosi S. Biased Estimates of Treatment Effect in Randomized Experiments with Nonlinear Regressions and Omitted Covariates. Biometrika. 1984;71:431. [Google Scholar]
- 22.Efron B. Forcing a Sequential Experiment to be Balanced. Biometrika. 1971;58:403–17. [Google Scholar]
- 23.Matts JP, Lachin JM. Properties of permuted-block randomization in clinical trials. Control Clin Trials. 1988;9:327–44. doi: 10.1016/0197-2456(88)90047-5. [DOI] [PubMed] [Google Scholar]
- 24.Smith RL. Properties of Biased Coin Designs in Sequential. Clin Trials. 1984:1018–34. [Google Scholar]
- 25.Zelen M. The randomization and stratification of patients to clinical trials. J Chronic Dis. 1974;27:365–75. doi: 10.1016/0021-9681(74)90015-0. [DOI] [PubMed] [Google Scholar]
Associated Data
This section collects any data citations, data availability statements, or supplementary materials included in this article.