

Abstract
Background
The cancer‐anorexia‐cachexia syndrome (CACS) negatively affects survival and therapy success in cancer patients. Inflammatory mediators and tumour‐derived factors are thought to play an important role in the aetiology of CACS. However, the central and peripheral mechanisms contributing to CACS are insufficiently understood. The area postrema (AP) and the nucleus tractus solitarii are two important brainstem centres for the control of eating during acute sickness conditions. Recently, the tumour‐derived macrophage inhibitory cytokine‐1 (MIC‐1) emerged as a possible mediator of cancer anorexia because lesions of these brainstem areas attenuated the anorectic effect of exogenous MIC‐1 in mice.
Methods
Using a rat hepatoma tumour model, we examined the roles of the AP and of vagal afferents in the mediation of CACS. Specifically, we investigated whether a lesion of the AP (APX) or subdiaphragmatic vagal deafferentation (SDA) attenuate anorexia, body weight, muscle, and fat loss. Moreover, we analysed MIC‐1 levels in this tumour model and their correlation with tumour size and the severity of the anorectic response.
Results
In tumour‐bearing sham‐operated animals mean daily food intake significantly decreased. The anorectic response was paralleled by a significant loss of body weight and muscle mass. APX rats were protected against anorexia, body weight loss, and muscle atrophy after tumour induction. In contrast, subdiaphragmatic vagal deafferentation did not attenuate cancer‐induced anorexia or body weight loss. Tumour‐bearing rats had substantially increased MIC‐1 levels, which positively correlated with tumour size and cancer progression and negatively correlated with food intake.
Conclusions
These findings demonstrate the importance of the AP in the mediation of cancer‐dependent anorexia and body weight loss and support a pathological role of MIC‐1 as a tumour‐derived factor mediating CACS, possibly via an AP‐dependent action.
Keywords: Cancer, Food intake, Energy balance, Brainstem, Muscle, AP‐lesion, Subdiaphragmatic vagal deafferentation
Introduction
The anorexia‐cachexia syndrome (ACS) is characterized by reduced eating and body weight loss, which is the consequence of reduced fat and muscle mass.1 More than 80% of patients with advanced cancer suffer from loss of appetite and body weight.2 Cancer ACS (CACS) negatively affects the clinical status, increases mortality, deteriorates treatment success, and reduces quality of life.3, 4 Inflammatory signalling molecules (e.g. cytokines) that are released during malignancy by the host immune system or by the tumour itself are important mediators of CACS.5, 6
The area postrema (AP) is a sensory circumventricular organ of the caudal hindbrain, which is anatomically linked to and interacts in a reciprocal manner with the nucleus tractus solitarii (NTS).7 Because of the lack of a functional blood‐brain barrier, neurons of the AP represent targets for blood‐borne hormones and pathological signalling molecules. The AP appears to be involved in pathological anorexia because lesions of the AP and the adjacent NTS region attenuate TNF‐α‐induced anorexia in rats.8 Moreover, AP neurons are activated in tumour‐bearing (TB) rats carrying hepatoma tumours.9
The NTS is an integrative relay centre for a variety of peripheral signals that control food intake.10 It is the main projection site of vagal afferents from the gastrointestinal tract that transmits sensory visceral information to the brain. Vagotomy attenuated sickness‐associated behaviours such as a decrease in social exploration induced by IL‐1β or by the inflammatory endotoxin lipopolysaccharide (LPS).11, 12 On the other hand, subdiaphragmatic vagal deafferentation (SDA) failed to influence the anorectic effects of intraperitoneally injected LPS, muramyl dipeptide or IL‐1β, indicating that vagal afferents are not necessary for the eating inhibition by these inflammatory mediators.13, 14 Experimental evidence for a role of the AP or vagal afferents in cancer anorexia is scarce. The only study addressing this question was conducted using a rat Leydig cell tumour model, which is characterized by endocrine activity of oestrogens.15 Given that oestrogens act via the AP/NTS regions to reduce food intake,16 the outcome of that study may reflect the consequences of hyperestrogenemia rather than specific tumour‐dependent signalling mechanisms. Moreover, the lesioning approach in this study was not specific for the AP because the lesion included major parts of the NTS, resulting in a destruction of vagal terminal fields. Therefore, knowledge about the general role of the AP in cancer anorexia is very limited, and a better dissociation between vagal and AP‐dependent mechanisms is required.
In the present study, we used neurosurgical approaches to examine the role of the AP and vagal afferents in the mediation of cancer anorexia and body weight loss in a rat hepatoma tumour model. A vacuum aspiration approach allowing the specific removal of the AP without compromising the structural integrity the NTS was used.17 Moreover, we used the SDA technique, which is the most sophisticated deafferentation method because it disrupts all subdiaphragmatic vagal afferents while leaving about 50% of vagal efferents intact. The remaining vagal efferents are sufficient for maintaining the control of gastrointestinal function.18 The comparison of APX and SDA approaches allows for the dissociation of vagal and AP mediated effects on CACS.
Despite their importance for disease‐related anorexia, the classic pro‐inflammatory cytokines including interleukins, TNF‐α and IFN‐γ do not seem to be required for the anorexia in the hepatoma tumour model.9, 19 There is cumulating evidence pointing to the AP as a target site for the signalling molecule MIC‐1, also known as growth differentiation factor 15 (GDF15). Tumour cell dependent expression of MIC‐1 can increase serum levels by up to 100‐fold.20, 21, 22, 23 MIC‐1 produced by xenografted tumours and recombinant protein both reduce food intake and lead to cachectic body weight loss in mice that can be inhibited by specific monoclonal antibodies.24 Additionally, systemic injection of recombinant MIC‐1 leads to rapid induction of c‐Fos in the AP/NTS region, and a lesion of this brain area blocks the anorectic effect of exogenous MIC‐1 in mice.25 Given the recent evidence for a hindbrain‐dependent suppression of food intake by MIC‐1 and to further support the importance of MIC‐1 signalling in CACS, we also sought to analyse MIC‐1 blood levels at different time points during cancer progression.25
Materials and methods
Animals and housing conditions
Male Buffalo rats were used (Charles River Laboratory, USA). The animals were housed at controlled temperature (21 ± 1 °C) under a 12‐h artificial light cycle with ad libitum access to standard laboratory rat chow (890 25 W16, Provimi Kliba, AG, Kaiseraugst, Switzerland). All experiments were approved by the Veterinary Office of the Canton Zurich.
Cell culture and tumour model
The hepatoma tumour model was described previously.9, 26 Morris hepatoma 7777 cells (McA‐RH7777, Catalog No. CRL‐1601, ATCC, USA) were cultured under standard conditions in DMEM supplemented with 10% foetal bovine serum and 1% penicillin‐streptomycin. Semi‐confluent McA‐RH7777 Petri dishes were washed with DMEM repeatedly to detach the cells from the surface. After confirming viability of the cells with trypan blue, 107 cells were inoculated subcutaneously between the scapulae in 250 μL PBS under short isoflurane anaesthesia. Control animals were also anaesthetized and injected with PBS.
Area postrema lesion
The APX was conducted as described.27 Briefly, animals (200–230 g) were placed in a stereotactic frame with the head flexed ventrally in order to visualize the crista occipitalis. The atlanto‐occipital membrane was dissected, and the meninges were carefully incised under surgical microscope control. The AP was then visualized and removed by vacuum aspiration using a blunted 26 G cannula connected to a water vacuum pump. The animals were allowed 2 weeks for recovery before the start of the behavioural trials.
A histological verification of successful AP lesion was performed post‐mortem. Microscopic coronal sections of the AP/NTS region were analysed. Only those animals in which the AP was removed without visible damage of the adjacent NTS were included in the study. Photomicrographs were taken at 20× magnification, using a Zeiss Imager Z2 microscope fitted with a digital camera system (Zeiss Axiocam).
Subdiaphragmatic vagal deafferentation
This surgical technique consists in a left‐side intracranial transection of the vagal afferent rootlets and an ipsilateral transection of the dorsal subdiaphragmatic trunk of the vagus nerve resulting in complete SDA as previously described.18 Rats (210–250 g) were pretreated with ip injections of 50 µg/kg atropine, antibiotics, and then anaesthetized with isoflurane. For sham‐SDA surgery, the vagal rootlets and the dorsal subdiaphragmatic vagus trunk were exposed without disrupting them. Five millitre of warm saline and an analgesic were injected ip after suturing the abdomen. Post‐surgical treatment with antibiotics and the analgesic continued for the following 2 days.
Two histological tests aimed to verify the completeness of SDA. These tests were based on published techniques for retrograde labelling of vagal motor neurons in the dorsal motor nucleus of the vagus (DMN) and anterograde labelling of vagal afferents in the NTS.28, 29, 30 Rats were anaesthetized with isoflurane, and a midline incision at the level of the throat was made to expose the left nodose ganglion. A glass micropipette was inserted into the ganglion using a micromanipulator. A water solution (1.5 μL) containing the anterograde tracer biotinylated dextran amine (BDA, 5%) and 1% blue food colouring (Trawosa AG, St. Gallen, Switzerland) was pressure injected (PicoSpritzer 3; Parker Instrumentation, Fairfield, NJ) during 3–5 min. Three days after surgery the animals were shortly anaesthetized with isoflurane and 2 mg of the retrograde tracer fluorogold (FG) in 1 mL saline (Fluorochrome, Denver, CO) were injected intraperitoneally. After 2 days of tracer migration, the rats were perfused and the brains were removed as described below. The procedure for visualizing BDA‐positive vagal projections in the NTS involved an incubation with the avidin‐biotin‐peroxidase complex followed by an incubation in 3,3′‐diaminobenzidine solution (0.05% 3,3′‐diaminobenzidine, 0.009% H2O2, 0.04% NiCl2, 0.08% CoCl2 in 0.05 M Tris‐HCl). Absence of labelling was interpreted as successful transection of vagal afferents. To confirm completeness of unilateral subdiaphragmatic trunk vagotomy, an observer who was blind to the rat's surgery, counted the number of fluorogold‐labelled neurons in the left and right DMN at the level of the AP. If the number of labelled cells found in the right DMN was less than 3% of the number found in the left DMN, and if vagal afferent fibres were absent in the NTS, the SDA surgery was considered successful. Sham‐SDA rats were only included if FG‐positive DMN neurons were labelled bilaterally and dense vagal afferent terminals were detected histologically. Photomicrographs were taken as described earlier.
Behavioural and metabolic studies
Using non‐operated TB rats, we first sought to dissociate the effects of tumour anorexia on body weight and muscle loss from eating‐independent effects. Non‐tumour‐bearing (NTB), pair‐fed (PF), and TB rats (220–250 g) were single‐housed in BIODAQ cages (Research Diets, NJ, USA) equipped with an external food hopper allowing precise 24‐h food intake measurements. Rats were adapted to the housing conditions for 14 days before tumour cell injection. Daily food intake and body weight were measured shortly before dark‐onset. Nine days after tumour induction, PF animals received the same amount of food as was consumed the previous day by the TB group. At the end of the experiment, the animals were euthanized for blood and tissue collection.
We then assessed the impact of tumour growth on metabolic rate and locomotor activity in this model. This experiment, which involved TB and NTB rats (130–150 g), was conducted in an open‐circuit indirect calorimetric system (TSE Phenomaster, Bad Homburg, Germany) equipped with internal food hoppers and water bottles connected to scales, which allow for continuous recording of food and water consumption. The animals were single‐housed in metabolic cages and adapted to the housing conditions for 7 days before the start of the experiment. Body weight was measured daily before dark onset. Food intake and respiratory gas exchange (O2 and CO2) were recorded automatically at 17‐min intervals throughout the entire experiment. Locomotor activity (i.e. number of horizontal movements) was recorded using a frame of horizontal infrared beams (Accuscan, Columbus, Ohio).
Behavioural and metabolic studies with APX and SDA rats were also conducted in the same open‐circuit indirect calorimetric system. In both studies, the animals were kept and adapted to the experimental conditions as described earlier. Food intake and body weight were recorded daily.
Terminal tissue and blood collection
Rats were anaesthetized shortly before dark onset after injection of pentobarbital (100 mg/kg ip). The thorax was opened and blood was collected from the right ventricle for subsequent MIC‐1 measurements. Immediately afterwards, the rats were transcardially perfused with 0.1 M PB followed by 4% phosphate‐buffered paraformaldehyde. The brains were removed, post‐fixed for 4 h in 4% phosphate‐buffered paraformaldehyde and then cryoprotected for 2 days in 20% sucrose in 0.1 M PB at 4°C. Brains were subsequently frozen in hexane. Three series of coronal brainstem sections containing the AP/NTS region (20 µm) were cut with a cryomicrotome (CM3050S, Leica Microsystems, Germany), thaw‐mounted on glass slides and then stored at −20°C until further processing.
MIC‐1 measurements
Rats were single‐housed in BIODAQ cages as described earlier. Food intake and body weight were measured daily and tumour growth was induced in all animals. Blood was obtained by puncturing the sublingual vein under mild isoflurane anaesthesia. Sampling was conducted 3 days before tumour induction (baseline) and 11 days and 17 days after induction, that is, shortly after the onset of anorexia and during fully developed anorexia, respectively. Blood was collected in EDTA containing tubes (Sarstedt, Nümbrecht, Germany) and centrifuged at 7000 × g (4°C, 7 min) to obtain plasma, which was stored in aliquots at −80°C for subsequent analysis. The levels MIC‐1 were measured with using an ELISA (R&D Systems, USA) according to the manufacturers' instructions.
Body composition analysis and muscle and tumour weight measurements
After euthanizing the rats, tumours were resected and weighed. Total carcass lean and fat mass were measured by magnetic resonance imaging (EchoMRI, Echo Medical Systems, Texas, USA). Two consecutive measurements were taken to ensure instrument precision and averaged for the subsequent statistical analysis. The left gastrocnemius, tibialis, and soleus muscles were dissected at the level of their upper to lower tendons and weighed.
Data evaluation and statistical analysis
Mean daily food intake, body weight, body composition (lean and fat mass), and MIC‐1 levels were expressed as mean ± SEM. In the pair‐feeding experiment, body weight changes were calculated by subtracting the weight of the animal at the day of tumour induction from the final body weight. In the experiments involving AP‐lesioned and vagotomized animals, food intake was corrected for body weight because at least in the APX study, the surgery had an effect on body weight. This effect is in line with previous studies in which APX animals tended to gain less weight than sham‐APX because of moderately decreased total food intake.17 Weekly body weight change after tumour‐induction was calculated by subtracting the body weight at the beginning of each week from the body weight at the end of same week. Food intake and body weight changes were quantified across a 3‐week period starting one week before the onset of anorexia. Presumably, because of general biological variability, anorexia in the APX study started a week later than in the SDA study, that is, 3 instead of 2 weeks after tumour induction. Metabolic rate was calculated from O2 consumption and CO2 production as described previously.31 Metabolic rate data were normalized for body weight. The calculation was based on the following equation: total EE (kcal/kg/h) = (3.9 × VO2 + 1.1 × VCO2) / 1000. The average values obtained between Days 1 and 3 after tumour inoculation were used as baseline (i.e. prior to the onset of anorexia) and compared with the average values during three consecutive days in each week after tumour induction. The number of horizontal movements (i.e. locomotor activity) was monitored across continuous 5‐min intervals over 24 h and expressed as average of three consecutive days.
Statistical comparisons between multiple groups were performed using one‐way ANOVA followed by Tukey's post‐hoc test. Unpaired Student's t‐test (two‐sided) was used for comparison between two groups. Linear regression analysis was used to examine the correlation between MIC‐1 levels, tumour weight and food intake. For all statistical tests, a P‐value less than 0.05 was considered significant. Data were analysed using Prism GraphPad 5.0.
Results
Effects of tumour growth on food intake, body weight and muscle, fat and lean mass
Tumours became palpable between Days 9 and 11, which coincided with the onset of the anorectic response. TB rats showed significantly lower food intake than NTB animals from Day 11 after tumour cell inoculation. Daily food intake stabilized at a lower level with an average reduction of 45% in comparison to NTB animals (Figure 1A). While NTB animals displayed constant body weight gain during the experimental period, TB animals showed a marked loss of body weight, which became significant 12 days after tumour induction. Pair‐feeding reduced body weight gain, which led to a significantly lower body weight compared with NTB on Days 18–19. Pair‐feeding did not, however, lower body weight to the level of the TB animals; these animals were significantly heavier than the TB rats on Day 13 (Figure 1B–C). TB animals had lower lean carcass mass in comparison with healthy controls and PF animals (Figure 1D). TB rats also had lower fat mass than controls and PF rats. Furthermore, TB rats had lower gastrocnemius and tibialis muscle mass than NTB animals (Figure 1E), while muscle weight of the PF group did not differ from NTB controls. The tumour weight was 13.2 ± 1.5 g at the end of experiment.
Figure 1.
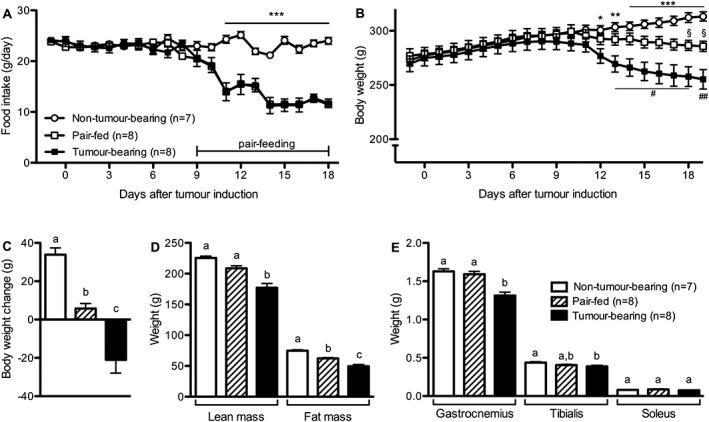
Tumour‐induced body weight loss and muscle degradation are partly independent of anorexia. (A–C) Tumour‐bearing rats developed anorexia and lost body weight. Pair‐feeding only led to an attenuation of body weight gain that was calculated by subtracting the body weight at the time of tumour induction from the body weight at the end of the experiment. (D) Tumour‐bearing animals had lower lean and fat carcass mass compared with both control groups. (E) Tumour‐bearing rats had lower gastrocnemius and tibialis muscle mass compared with Non‐Tumour‐bearing animals and lower gastrocnemius muscle mass compared with the pair‐fed group. Data analysed with Student's t‐test (A) or with one‐way ANOVA followed by Tukey's post‐hoc test (B–E). Means with different letter or symbols are significantly different from each other; * P < 0.05, ** P < 0.01, *** P < 0.001, same for # and §).
Effects of tumour growth on metabolism and locomotor activity
Energy expenditure and activity were analysed in a separate cohort of TB and NTB rats. The food intake of these animals following tumour induction decreased, leading to significantly lower body weight in TB rats compared to NTB controls (Figure 2A–B). While the metabolic rate of the NTB controls did not significantly change during the experiment, TB animals showed a slight but significant reduction in metabolic rate during the third week after tumour induction (Figure 2C). Daily locomotor activity was similar between the two experimental groups (Figure 2D) and there were no differences in the diurnal and nocturnal activity pattern (data not shown).
Figure 2.
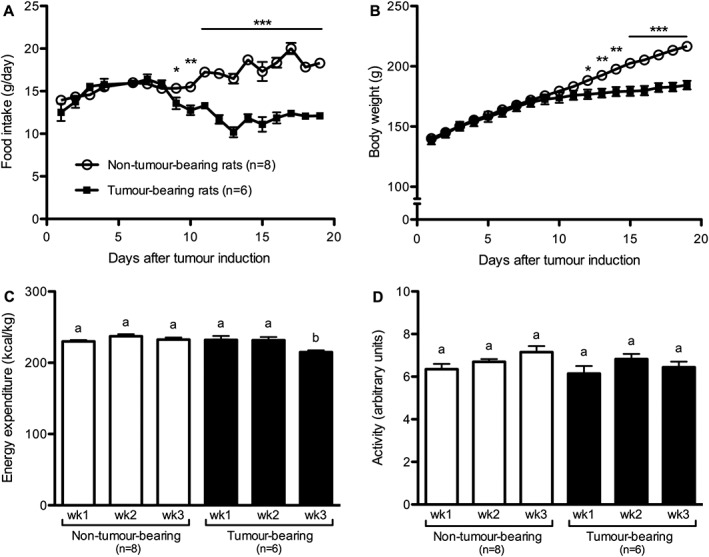
Tumour growth reduced metabolic rate without affecting locomotor activity. Tumour‐bearing rats developed anorexia (A) and showed reduced body weight gain (B), but did not show differences in metabolic rate (C) or locomotor activity (D), except during Week 3 in which tumour‐bearing rats showed reduced metabolic rate. Data analysed with Student's t‐test (A–B), * P < 0.05, ** P < 0.01, *** P < 0.001. Data analysed with one‐way ANOVA followed by Tukey's post‐hoc test (C–D). Means with different letters are significantly different from each other (P < 0.05).
Area postrema lesion blocked anorexia and attenuated tumour‐induced body weight loss and muscle degradation
Body weight before tumour induction was lower in the APX animals compared with sham‐APX rats (APX: 225 ± 9 vs. sham‐APX 262 ± 8.5 g). However, no significant differences in food intake between the experimental groups occurred prior to tumour anorexia when food intake was corrected for body weight (APX: 7.2 ± 0.2 vs. sham‐APX: 7.6 ± 0.2 g/100 g BW). The food intake of the sham‐APX rats decreased following tumour induction, resulting in a significant reduction of 40 ± 3% between Weeks 2 and 4 (Figure 3A). This effect was accompanied by a decline in body weight gain, leading to net body weight loss in Week 4 (Figure 3B). Strikingly, and in contrast to its effect in sham‐APX rats, tumour growth did not affect food intake in APX animals (Figure 3A). The weekly body weight gain of the APX rats only significantly decreased in Week 4. In contrast to sham‐APX rats, however, APX animals did not lose body weight following tumour growth (Figure 3B). Furthermore, APX rats had higher gastrocnemius and soleus muscle weights than controls (Figure 3C). The metabolic rate was similar between APX and sham‐APX animals. Tumour growth decreased metabolic rate in both surgical groups similarly with a significant reduction between Weeks 2 and 3. No further decrease occurred between Weeks 3 and 4 (APX vs. sham‐APX, wk2: 185.8 ± 10.3 vs. 186.1 ± 5.4; wk3: 160.6 ± 2.6, 160.0 ± 1.3; wk4: 162.2 ± 4.8 vs. 159.6 ± 3.4 kcal/kg/d). Locomotor activity was similar in APX and sham‐APX animals and no significant changes occurred between the two groups following tumour induction (APX vs. sham‐APX, wk2: 5.5 ± 0.5 vs. 5.6 ± 0.4; wk3: 6.6 ± 0.4 vs. 6.7 ± 0.5; wk4: 6.0 ± 0.5 vs. 6.7 ± 0.3 arbitrary units). Importantly, tumour weight did not differ significantly between APX and sham‐APX rats at the end of the experiment (9.6 ± 0.7 vs. 7.7 ± 2.3 g). Representative histological sections of the AP/NTS region from a sham‐APX and an APX animal are shown in Figure 3D.
Figure 3.
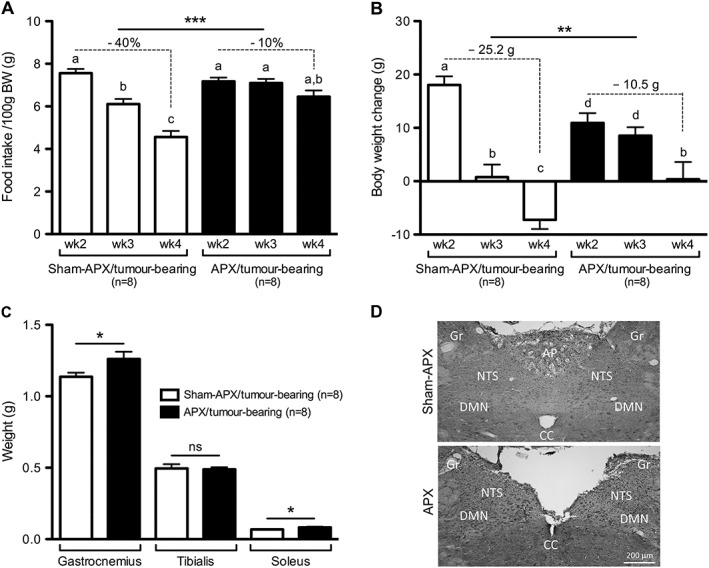
Lesion of the area postrema attenuated anorexia, body weight loss and muscle degradation induced by tumour growth. (A–B) Area postrema lesioned (APX) animals were protected against tumour‐induced anorexia and showed markedly attenuated body weight loss following tumour induction. (C) Area postrema lesioned rats show higher gastrocnemius and soleus mass compared to area postrema‐sham lesioned (sham‐APX) tumour‐bearing animals. (D) Coronal sections of the area postrema/nucleus tractus solitarii of a sham‐lesioned control (upper image) and an area postrema lesioned animal (lower image). AP, area postrema; NTS, nucleus tractus solitarii; DMN, dorsal motor nucleus of the vagus; Gr, gracile nucleus; CC, central canal. Data analysed with one‐way ANOVA followed by Tukey's post‐hoc test (A–B), means with different letters are significantly different from each other (P < 0.05). Changes in food intake, differences in body weight change between Weeks 2 and 4, and muscle weights were analysed using the Student's t‐test (A‐C), * P < 0.05, ** P < 0.01, *** P < 0.001.
Subdiaphragmatic vagal deafferentation did not prevent tumour‐induced anorexia and body weight loss
In line with previous reports, daily food intake did not differ between SDA and sham‐SDA animals prior to tumour induction (21.8 ± 0.9 SDA vs. 22.3 ± 0.5 g sham‐SDA).32, 33 Moreover, body weight did not differ between the two groups before the surgery (SDA: 253 ± 4 vs. sham‐SDA: 246 ± 3 g) and prior to tumour induction (SDA: 252 ± 5 vs. sham‐SDA: 248 ± 4 g). In contrast to APX, SDA did not affect tumour‐induced anorexia. Tumour growth reduced food intake in SDA and sham‐SDA rats similarly, leading to a food intake reduction of 39 ± 3 and 41 ± 2% between Weeks 1 and 3 in SDA and sham‐SDA rats, respectively (Figure 4A). Likewise, tumour growth attenuated body weight gain in both groups during Week 2 similarly, resulting in body weight loss in Week 3 (Figure 4B). No differences in lean and fat mass, metabolic rate, and locomotor activity were observed between the two groups (data not shown). The tumour weight of the SDA and sham‐SDA animals did not differ at the end of the experiment (17.6 ± 2.6 vs. 21.8 ± 1.9 g). Figure 4C shows representative histological sections of animals in both groups. Unilateral anterograde labelling of vagal afferents in the NTS was visible in sham‐SDA but absent in SDA rats. Furthermore, sham‐SDA rats showed bilateral retrograde labelling of vagal motor neurons in the DMN, whereas only unilateral staining of the DMN was present in SDA animals.
Figure 4.
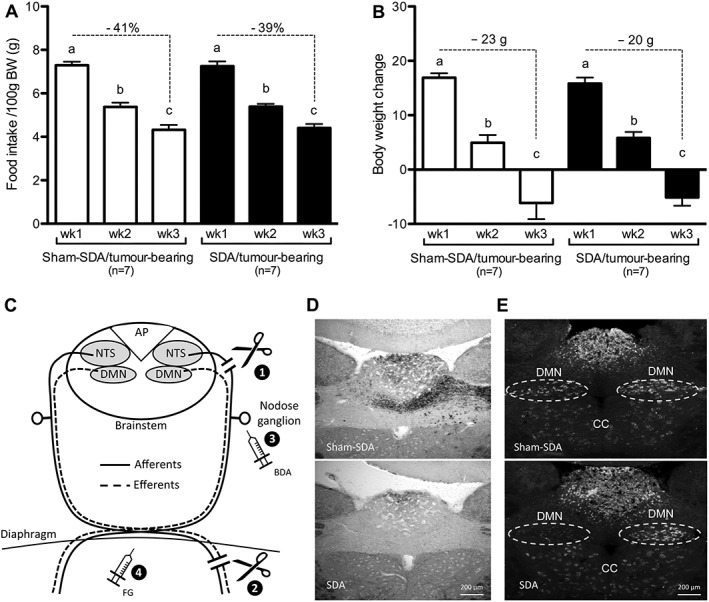
Subdiaphragmatic vagal deafferentation did not attenuate cancer‐anorexia‐cachexia syndrome. (A) Tumour growth induced a strong anorectic response in both subdiaphragmatic vagal deafferentation (SDA) and sham‐operated (sham‐SDA) animals. (B) In both groups anorexia was paralleled by a similar reduction of body weight gain in Week 2 and a net body weight loss in Week 3. (C) Schematic illustration of afferent and efferent vagal fibres targeted by the subdiaphragmatic vagal deafferentation and of the procedures used to verify its completeness. The subdiaphragmatic vagal deafferentation consists in a left intracranial rhizotomy of all dorsal vagal fibres (i.e. afferent) (1) and a complete subdiaphragmatic dissection (afferent and efferent fibers) of the left trunk of the vagus nerve (2). With this surgical procedure all vagal afferents are dissected, leaving 50% of the vagal efferents intact. Biotinylated dextran amine (BDA) was applied directly into the nodose ganglion of the vagus nerve 5 days prior to sacrifice (3). Fluorogold (FG) was injected intraperitoneally 48 h prior to sacrifice (4). D–E) Coronal sections of the area postrema/nucleus tractus solitarii region of a sham‐lesioned control and a subdiaphragmatic vagal deafferentation animal. (D) While biotinylated dextran amine‐positive fibers were present in the nucleus tractus solitarii of sham rats, no labelling was observed in the nucleus tractus solitarii of subdiaphragmatic vagal deafferentation animals. (E) While bilateral Fluorogold staining in the dorsal motor nucleus (DMN) of sham rats was observed, only unilateral staining of the dorsal motor nucleus occurred in subdiaphragmatic vagal deafferentation animals. CC, central canal. One‐way ANOVA followed by Tukey's post‐hoc test, means with different letters are significantly different from each other (P < 0.05).
Tumour growth and anorexia correlated with MIC‐1 blood levels
MIC‐1 plasma levels in TB rats were significantly higher than in NTB and PF controls at the end of the experiment, showing a 42‐fold increase (Figure 5A). MIC‐1 levels did not differ between PF and NTB rats. In a separate group of animals, MIC‐1 levels were also measured before tumour induction, shortly after the onset of anorexia and at the end of the experiment (11 and 17 days after tumour induction, respectively). MIC‐1 plasma levels were already elevated 11 days after tumour induction compared with baseline conditions and increased further until Day 17 (Figure 5B). MIC‐1 levels positively correlated with tumour size (Figure 5C) and with the severity of anorexia during tumour growth (Figure 5D).
Figure 5.
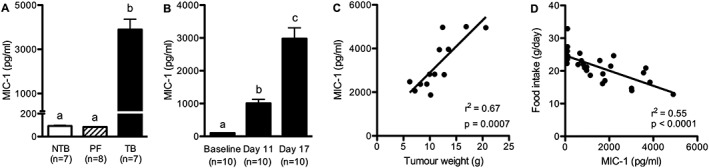
Macrophage inhibitory cytokine‐1 levels increased with tumour progression and correlated with tumour size and the severity of anorexia (A) macrophage inhibitory cytokine‐1 plasma levels were significantly higher in tumour‐bearing rats compared to controls at the end of the experiment. (B) macrophage inhibitory cytokine‐1 levels were elevated 11 days after tumour induction (i.e. 3 days after anorexia onset) and further increased with cancer progression. (C) Macrophage inhibitory cytokine‐1 levels correlated with tumour weight. (D) Macrophage inhibitory cytokine‐1 levels negatively correlated with food intake during tumour growth. Data analysed with one‐way ANOVA followed by Tukey's post‐hoc test (A–B), means with different letters are significantly different from each other (P < 0.05).
Discussion
The role of the AP and of vagal afferents in chronic cancer anorexia and body weight loss has neither been critically examined nor conclusively dissociated. Using the specific APX and SDA approaches, we now provide evidence that the AP is required for cancer anorexia and body weight loss in hepatoma TB rats. Lesion of the AP also attenuated cancer‐dependent muscle loss. In contrast to APX, SDA did not affect cancer‐induced anorexia and body weight loss, indicating that vagal afferents are not necessary for the mediation of CACS in this model. We also identified MIC‐1 as a possible mediator of CACS in hepatoma TB rats because MIC‐1 levels correlated with tumour progression and tumour size, and correlated negatively with food intake.
As demonstrated in previous studies, hepatoma TB rats showed an activation of the AP/NTS region that was caused by tumour growth but not as a consequence of anorexia because it did not occur in pair‐fed NTB controls.9 Our studies extend this observation by demonstrating clear differences between TB and pair‐fed NTB rats with respect to body weight, body composition, and muscle mass. TB rats lost considerably more body weight than NTB pair‐fed rats and showed a reduction in total lean mass and hind limb muscle mass. These findings are consistent with the notion that tumour‐dependent body weight loss and muscle degradation is not only due to reduced energy intake.
Differences in metabolic rate and locomotor activity between TB and NTB were small or absent, respectively. The only significant difference consisted of a reduced metabolic rate of TB rats during Week 3 after tumour induction. The consequences of cancer growth for energy expenditure vary among tumour models depending on the status of inflammation and effects caused by changes in food intake or physical activity.34, 35 In our studies, the moderately reduced metabolic rate of TB rats might be related to the reduced food intake.
Notably, indirect calorimetry does not reflect possible changes in energy expenditure because of anaerobic metabolism, which particularly occurs in tumour tissues, including the hepatoma cells used in these studies.36, 37 The considerably greater body weight loss in TB vs. pair‐fed NTB rats in the absence of marked differences in aerobic metabolic rate and locomotor activity suggests a role of anaerobic hypermetabolism in this tumour model. Another possible reason for the difference in body weight between TB and PF animals could be related to a maladaptation of energy expenditure, following reduced caloric intake. Reduction in metabolic rate during food‐restriction is a well‐known adaptive mechanism preventing excessive body weight loss. While this mechanism might have partially protected PF animals from body weight loss, an adaptive reduction in metabolic rate might have been negligible in TB rats.38, 39 We did not directly compare metabolic rate of PF and TB rats, but the small reduction in metabolic rate of TB rats compared with NTB animals is in line with this assumption.
In contrast to earlier studies using AP/NTS lesions, the NTS was not lesioned in our study.15 This is important because it means that the neuroanatomy conveying vagal afferent signalling to the hindbrain was still intact in our APX study. Furthermore, by using SDA, we minimized the severe impairment of gastrointestinal function that usually occurs in other experimental approaches (e.g. complete subdiaphragmatic vagotomy). Although lesion of the AP moderately reduces food intake and body weight compared with controls,17, 27 APX animals are still sensitive to anorectic stimuli such as LPS or CCK.40, 41 Therefore, lesion of the AP does not create a state of general unresponsiveness to anorectic stimuli. While APX rats did not develop cancer anorexia or body weight loss, body weight gain significantly decreased in the last week of the experiments. As discussed earlier, anaerobic hypermetabolism might have contributed to reduced body weight gain. Furthermore, mean daily food intake tended to decrease during the last week leading to a non‐significant reduction of cumulative food intake by about 10 g compared with the week before. We did not attempt to confirm or exclude the possible reasons for the reduced body weight gain toward the end of the experiment because the different effects mentioned earlier are likely to act in concert.
Most importantly, however, our studies clearly demonstrate an amelioration of CACS in APX rats including an attenuation of muscle loss. Differences in tumour growth did not account for decreased loss of muscle mass, because APX did not affect the tumour size. The lesion of the AP per se is also unlikely to increase muscle mass because APX rats generally tend to have lower body weights compared with sham‐APX rats. The pathological mechanisms leading to muscle wasting in the present tumour model have not yet been explored. In general, pro‐inflammatory cytokines are important mediators of cancer‐dependent muscle wasting acting via muscle degradation pathways.42 So far, no increased levels of TNF‐α, IL‐1β, IL‐6, or IFN‐γ have been identified in this tumour model.9 TB APX rats might be able to partially preserve muscle mass because of higher energy intake than TB sham‐APX rats, but pair‐feeding experiments would be required to confirm this.
The persistence of CACS in SDA rats may seem surprising given the presumed role of vagal afferents for the transmission of sickness‐related signals to the brain.43 While the SDA approach is the most appropriate surgical technique to disrupt vagal afferent signalling, we cannot exclude that afferent signals originating from the right nodose ganglion could be transmitted to the brainstem. However, the effects of anorectic stimuli such as CCK are blocked by SDA, suggesting that an intact nodose ganglion is not sufficient for the suppression of food intake induced by vagus‐dependent anorectic stimuli.44 Based on almost identical anorexia and body weight loss in SDA compared with sham‐SDA animals, it appears unlikely that the full CACS response is mediated via a unilateral supradiaphragmatic vagal mechanism.
Whereas in some studies, complete subdiaphragmatic vagotomy has been shown to reduce different sickness‐related symptoms including LPS and IL‐1β‐induced anorexia,45 the more specific SDA procedure that we employed here did not attenuate the anorectic response to immunomodulators.13, 14 Moreover, all these studies investigated the involvement of the vagus nerve in sickness anorexia accompanying acute models of inflammation, for example, treatment with endotoxins such as LPS or muramyl dipeptide or acute injection of pro‐inflammatory cytokines. To our knowledge, the only study exploring the role of the vagus in cancer anorexia was conducted in Leydig cell TB rats. Both total vagotomy and capsaicin‐induced vagal damage attenuated tumour anorexia in this tumour model.46 Whether the vagal mediation of cancer anorexia in this model is related to oestrogen produced by the tumour remains unclear but represents a plausible explanation.
Overall, the heterogeneity of findings regarding the involvement of vagal afferent signalling in disease‐related anorexia may reflect differences in pathological characteristics of the pertinent disease models. Although we cannot generalize our finding that vagal afferents did not contribute to cancer anorexia, the clear‐cut dissociation of vagal vs. AP‐dependent mechanisms helps to narrow down possible pathomechanisms and therapeutic targets.
There is much evidence for the pivotal role of pro‐inflammatory cytokines in the development of CACS.47 In contrast to other tumour models,48 no increases in circulating cytokines such as IL‐1β, IFN‐γ, IL‐6, and TNF‐α have been observed in hepatoma TB rats.9 We therefore hypothesized that other cytokines or tumour‐derived factors might contribute to CACS in this tumour model. Consistent with this hypothesis, we identified clearly elevated levels of MIC‐1 in TB rats, which positively correlated with tumour size and anorexia. The increase in circulating MIC‐1 was not secondary to anorexia because pair‐fed NTB rats had basal MIC‐1 levels comparable with ad libitum fed controls. This finding parallels recent observations in humans demonstrating that MIC‐1 levels do not seem to be determined by the amount of food intake.49 Different types of tumours express high levels of MIC‐1.21, 22, 23 Under inflammatory conditions, MIC‐1 can also be expressed by host tissue.50 While we have not identified the origin of MIC‐1 in TB rats, the lack of a general elevation in pro‐inflammatory cytokines and the strong correlation between tumour size and MIC‐1 levels suggest the tumour as a likely source of MIC‐1 in hepatoma TB rats.
Our studies complement previous findings suggesting that MIC‐1 contributes to CACS via an AP/NTS‐dependent action as MIC‐1‐induced anorexia and body weight loss was attenuated in mice with AP/NTS lesion.25 While only a combined AP/NTS lesion completely blunted the effect of MIC‐1 treatment on body weight, mice with specific lesions of the AP showed reduced body weight gain but were protected against body weight loss.
The clinical relevance of MIC‐1 as a possible mediator of CACS in humans has primarily been evaluated based on correlations of MIC‐1 blood levels with tumour and disease parameters (e.g. body weight loss). While in many clinical studies MIC‐1 levels correlated with the severity of body weight loss in cancer patients,24, 51 other studies did not observe such a correlation.52, 53 Several clinical studies highlighted the potential use of MIC‐1 as a biological marker for prognosis and diagnosis of certain types of cancer52, 54, 55 (see Fairlie et al.56 for review). It is important to highlight that the clinical relevance of MIC‐1 in human cancer patients appears to vary depending on the type of cancer.
Collectively, our studies substantiate the role of the AP in CACS. We also identified MIC‐1 as a possible humoral mediator of anorexia and body weight loss in hepatoma TB rats. Both MIC‐1 and local signalling processes in the AP/NTS region (e.g. GLP‐1) represent promising therapeutic targets for the treatment of CACS.
Conflict of interest
None declared.
Acknowledgement
The authors certify that they comply with the ethical guidelines for authorship and publishing of the Journal of Cachexia, Sarcopenia, and Muscle update 2015.57
This study was funded by the Swiss National Science Foundation (# 31003A‐135541), Krebsliga Zürich, Forschungskredit University of Zurich.
Borner, T. , Arnold, M. , Ruud, J. , Breit, S. N. , Langhans, W. , Lutz, T. A. , Blomqvist, A. , and Riediger, T. (2017) Anorexia‐cachexia syndrome in hepatoma tumour‐bearing rats requires the area postrema but not vagal afferents and is paralleled by increased MIC‐1/GDF15. Journal of Cachexia, Sarcopenia and Muscle, 8: 417–427. doi: 10.1002/jcsm.12169.
References
- 1. Evans WJ, Morley JE, Argiles J, Bales C, Baracos V, Guttridge D, et al. Cachexia: a new definition. Clin Nutr 2008;27:793–799. [DOI] [PubMed] [Google Scholar]
- 2. Tisdale MJ. Biology of cachexia. J Natl Cancer Inst 1997;89:1763–1773. [DOI] [PubMed] [Google Scholar]
- 3. Gordon JN, Green SR, Goggin PM. Cancer cachexia. QJM 2005;98:779–788. [DOI] [PubMed] [Google Scholar]
- 4. Tisdale MJ. Cachexia in cancer patients. Nat Rev Cancer 2002;2:862–871. [DOI] [PubMed] [Google Scholar]
- 5. Plata‐Salaman CR. Cytokines and feeding. Int J Obes Relat Metab Disord 2001;25:S48–552. [DOI] [PubMed] [Google Scholar]
- 6. Laviano A, Meguid MM, Rossi‐Fanelli F. Cancer anorexia: clinical implications, pathogenesis, and therapeutic strategies. Lancet Oncol 2003;4:686–694. [DOI] [PubMed] [Google Scholar]
- 7. Vigier D, Rouviere A. Afferent and efferent connections of the area postrema demonstrated by the horseradish peroxidase method. Arch Ital Biol 1979;117:325–339. [PubMed] [Google Scholar]
- 8. Bernstein IL, Taylor EM, Bentson KL. TNF‐induced anorexia and learned food aversions are attenuated by area postrema lesions. Am J Physiol 1991;260:R906–R910. [DOI] [PubMed] [Google Scholar]
- 9. Ruud J, Blomqvist A. Identification of rat brainstem neuronal structures activated during cancer‐induced anorexia. J Comp Neurol 2007;504:275–286. [DOI] [PubMed] [Google Scholar]
- 10. Grill HJ, Hayes MR. The nucleus tractus solitarius: a portal for visceral afferent signal processing, energy status assessment and integration of their combined effects on food intake. Int J Obes (Lond) 2009;33:S11–S15. [DOI] [PubMed] [Google Scholar]
- 11. Bluthe RM, Michaud B, Kelley KW, Dantzer R. Vagotomy attenuates behavioural effects of interleukin‐1 injected peripherally but not centrally. Neuroreport 1996;7:1485–1488. [DOI] [PubMed] [Google Scholar]
- 12. Bluthe RM, Walter V, Parnet P, Laye S, Lestage J, Verrier D, et al. Lipopolysaccharide induces sickness behaviour in rats by a vagal mediated mechanism. C R Acad Sci III 1994;317:499–503. [PubMed] [Google Scholar]
- 13. Porter MH, Hrupka BJ, Langhans W, Schwartz GJ. Vagal and splanchnic afferents are not necessary for the anorexia produced by peripheral IL‐1beta, LPS, and MDP. Am J Physiol 1998;275:R384–R389. [DOI] [PubMed] [Google Scholar]
- 14. Schwartz GJ, Plata‐Salaman CR, Langhans W. Subdiaphragmatic vagal deafferentation fails to block feeding‐suppressive effects of LPS and IL‐1 beta in rats. Am J Physiol 1997;273:R1193–R1198. [DOI] [PubMed] [Google Scholar]
- 15. Bernstein IL, Treneer CM, Kott JN. Area postrema mediates c effects on food intake, body weight, and learned aversions. Am J Physiol 1985;249:R296–R300. [DOI] [PubMed] [Google Scholar]
- 16. Asarian L, Geary N. Sex differences in the physiology of eating. Am J Physiol Regul Integr Comp Physiol 2013;305:R1215–R1267. [DOI] [PMC free article] [PubMed] [Google Scholar]
- 17. Lutz TA, Senn M, Althaus J, Del Prete E, Ehrensperger F, Scharrer E. Lesion of the area postrema/nucleus of the solitary tract (AP/NTS) attenuates the anorectic effects of amylin and calcitonin gene‐related peptide (CGRP) in rats. Peptides 1998;19:309–317. [DOI] [PubMed] [Google Scholar]
- 18. Norgren R, Smith GP. A method for selective section of vagal afferent or efferent axons in the rat. Am J Physiol 1994;267:R1136–R1141. [DOI] [PubMed] [Google Scholar]
- 19. Langhans W, Hrupka B. Interleukins and tumor necrosis factor as inhibitors of food intake. Neuropeptides 1999;33:415–424. [DOI] [PubMed] [Google Scholar]
- 20. Bauskin AR, Brown DA, Kuffner T, Johnen H, Luo XW, Hunter M, et al. Role of macrophage inhibitory cytokine‐1 in tumorigenesis and diagnosis of cancer. Cancer Res 2006;66:4983–4986. [DOI] [PubMed] [Google Scholar]
- 21. Staff AC, Bock AJ, Becker C, Kempf T, Wollert KC, Davidson B. Growth differentiation factor‐15 as a prognostic biomarker in ovarian cancer. Gynecol Oncol 2010;118:237–243. [DOI] [PubMed] [Google Scholar]
- 22. Welsh JB, Sapinoso LM, Kern SG, Brown DA, Liu T, Bauskin AR, et al. Large‐scale delineation of secreted protein biomarkers overexpressed in cancer tissue and serum. Proc Natl Acad Sci U S A 2003;100:3410–3415. [DOI] [PMC free article] [PubMed] [Google Scholar]
- 23. Zimmers TA, Jin X, Gutierrez JC, Acosta C, McKillop IH, Pierce RH, et al. Effect of in vivo loss of GDF‐15 on hepatocellular carcinogenesis. J Cancer Res Clin Oncol 2008;134:753–759. [DOI] [PMC free article] [PubMed] [Google Scholar]
- 24. Johnen H, Lin S, Kuffner T, Brown DA, Tsai VW, Bauskin AR, et al. Tumor‐induced anorexia and weight loss are mediated by the TGF‐beta superfamily cytokine MIC‐1. Nat Med 2007;13:1333–1340. [DOI] [PubMed] [Google Scholar]
- 25. Tsai VW, Manandhar R, Jorgensen SB, Lee‐Ng KK, Zhang HP, Marquis CP, et al. The anorectic actions of the TGFbeta cytokine MIC‐1/GDF15 require an intact brainstem area postrema and nucleus of the solitary tract. PLoS One 2014;9:e100370. [DOI] [PMC free article] [PubMed] [Google Scholar]
- 26. Borner T, Loi L, Pietra C, Giuliano C, Lutz TA, Riediger T. The ghrelin receptor agonist HM01 mimics the neuronal effects of ghrelin in the arcuate nucleus and attenuates anorexia‐cachexia syndrome in tumor‐bearing rats. Am J Physiol Regul Integr Comp Physiol 2016. [DOI] [PubMed] [Google Scholar]
- 27. Braegger FE, Asarian L, Dahl K, Lutz TA, Boyle CN. The role of the area postrema in the anorectic effects of amylin and salmon calcitonin: behavioral and neuronal phenotyping. Eur J Neurosci 2014;40:3055–3066. [DOI] [PubMed] [Google Scholar]
- 28. Powley TL, Fox EA, Berthoud HR. Retrograde tracer technique for assessment of selective and total subdiaphragmatic vagotomies. Am J Physiol 1987;253:R361–R370. [DOI] [PubMed] [Google Scholar]
- 29. Walls EK, Wang FB, Holst MC, Phillips RJ, Voreis JS, Perkins AR, et al. Selective vagal rhizotomies: a new dorsal surgical approach used for intestinal deafferentations. Am J Physiol 1995;269:R1279–R1288. [DOI] [PubMed] [Google Scholar]
- 30. Norgren R, Smith GP. Central distribution of subdiaphragmatic vagal branches in the rat. J Comp Neurol 1988;273:207–223. [DOI] [PubMed] [Google Scholar]
- 31. Riediger T, Cordani C, Potes CS, Lutz TA. Involvement of nitric oxide in lipopolysaccharide induced anorexia. Pharmacol Biochem Behav 2010;97:112–120. [DOI] [PubMed] [Google Scholar]
- 32. Ferrari B, Arnold M, Carr RD, Langhans W, Pacini G, Bodvarsdottir TB, et al. Subdiaphragmatic vagal deafferentation affects body weight gain and glucose metabolism in obese male Zucker (fa/fa) rats. Am J Physiol Regul Integr Comp Physiol 2005;289:R1027–R1034. [DOI] [PubMed] [Google Scholar]
- 33. Arnold M, Mura A, Langhans W, Geary N. Gut vagal afferents are not necessary for the eating‐stimulatory effect of intraperitoneally injected ghrelin in the rat. J Neurosci 2006;26:11052–11060. [DOI] [PMC free article] [PubMed] [Google Scholar]
- 34. Tisdale MJ. Mechanisms of cancer cachexia. Physiol Rev 2009;89:381–410. [DOI] [PubMed] [Google Scholar]
- 35. Bennani‐Baiti N, Walsh D. Animal models of the cancer anorexia‐cachexia syndrome. Support Care Cancer 2011;19:1451–1463. [DOI] [PubMed] [Google Scholar]
- 36. Mares‐Perlman JA, Shrago E. Energy substrate utilization in freshly isolated Morris Hepatoma 7777 cells. Cancer Res 1988;48:602–608. [PubMed] [Google Scholar]
- 37. Vander Heiden MG, Cantley LC, Thompson CB. Understanding the Warburg effect: the metabolic requirements of cell proliferation. Science 2009;324:1029–1033. [DOI] [PMC free article] [PubMed] [Google Scholar]
- 38. Tisdale MJ. Metabolic abnormalities in cachexia and anorexia. Nutrition 2000;16:1013–1014. [DOI] [PubMed] [Google Scholar]
- 39. Ihnatko R, Post C, Blomqvist A. Proteomic profiling of the hypothalamus in a mouse model of cancer‐induced anorexia‐cachexia. Br J Cancer 2013;109:1867–1875. [DOI] [PMC free article] [PubMed] [Google Scholar]
- 40. Weingarten S, Senn M, Langhans W. Does a learned taste aversion contribute to the anorectic effect of bacterial lipopolysaccharide? Physiol Behav 1993;54:961–966. [DOI] [PubMed] [Google Scholar]
- 41. Edwards GL, Ladenheim EE, Ritter RC. Dorsomedial hindbrain participation in cholecystokinin‐induced satiety. Am J Physiol 1986;251:R971–R977. [DOI] [PubMed] [Google Scholar]
- 42. Burckart K, Beca S, Urban RJ, Sheffield‐Moore M. Pathogenesis of muscle wasting in cancer cachexia: targeted anabolic and anticatabolic therapies. Curr Opin Clin Nutr Met Care 2010;13:410–416. [DOI] [PMC free article] [PubMed] [Google Scholar]
- 43. McCarthy DO. Cytokines and the anorexia of infection: potential mechanisms and treatments. Biol Res Nurs 2000;1:287–298. [DOI] [PubMed] [Google Scholar]
- 44. Moran TH, Baldessarini AR, Salorio CF, Lowery T, Schwartz GJ. Vagal afferent and efferent contributions to the inhibition of food intake by cholecystokinin. Am J Physiol 1997;272:R1245–R1251. [DOI] [PubMed] [Google Scholar]
- 45. Maier SF, Goehler LE, Fleshner M, Watkins LR. The role of the vagus nerve in cytokine‐to‐brain communication. Ann N Y Acad Sci 1998;840:289–300. [DOI] [PubMed] [Google Scholar]
- 46. Bernstein IL. Neutral mediation of food aversions and anorexia induced by tumor necrosis factor and tumors. Neurosci Biobehav Rev 1996;20:177–181. [DOI] [PubMed] [Google Scholar]
- 47. Laviano A, Meguid MM, Inui A, Muscaritoli M, Rossi‐Fanelli F. Therapy insight: cancer anorexia‐cachexia syndrome‐‐when all you can eat is yourself. Nat Clin Pract Oncol 2005;2:158–165. [DOI] [PubMed] [Google Scholar]
- 48. Talbert EE, Metzger GA, He WA, Guttridge DC. Modeling human cancer cachexia in colon 26 tumor‐bearing adult mice. J Cachexia Sarcopenia Muscle 2014;5:321–328. [DOI] [PMC free article] [PubMed] [Google Scholar]
- 49. Tsai VW, Macia L, Feinle‐Bisset C, Manandhar R, Astrup A, Raben A, et al. Serum levels of human MIC‐1/GDF15 vary in a diurnal pattern, do not display a profile suggestive of a satiety factor and are related to BMI. PLoS One 2015;10:e0133362. [DOI] [PMC free article] [PubMed] [Google Scholar]
- 50. Fairlie WD, Moore AG, Bauskin AR, Russell PK, Zhang HP, Breit SN. MIC‐1 is a novel TGF‐beta superfamily cytokine associated with macrophage activation. J Leukoc Biol 1999;65:2–5. [DOI] [PubMed] [Google Scholar]
- 51. Lerner L, Hayes TG, Tao N, Krieger B, Feng B, Wu Z, et al. Plasma growth differentiation factor 15 is associated with weight loss and mortality in cancer patients. J Cachexia Sarcopenia Muscle 2015;6:317–324. [DOI] [PMC free article] [PubMed] [Google Scholar]
- 52. Skipworth RJ, Deans DA, Tan BH, Sangster K, Paterson‐Brown S, Brown DA, et al. Plasma MIC‐1 correlates with systemic inflammation but is not an independent determinant of nutritional status or survival in oesophago‐gastric cancer. Br J Cancer 2010;102:665–672. [DOI] [PMC free article] [PubMed] [Google Scholar]
- 53. Lu Z, Yang L, Yu J, Lu M, Zhang X, Li J, et al. Change of body weight and macrophage inhibitory cytokine‐1 during chemotherapy in advanced gastric cancer: what is their clinical significance? PLoS One 2014;9:e88553. [DOI] [PMC free article] [PubMed] [Google Scholar]
- 54. Brown DA, Ward RL, Buckhaults P, Liu T, Romans KE, Hawkins NJ, et al. MIC‐1 serum level and genotype: associations with progress and prognosis of colorectal carcinoma. Clin Cancer Res 2003;9:2642–2650. [PubMed] [Google Scholar]
- 55. Koopmann J, Buckhaults P, Brown DA, Zahurak ML, Sato N, Fukushima N, et al. Serum macrophage inhibitory cytokine 1 as a marker of pancreatic and other periampullary cancers. Clin Cancer Res 2004;10:2386–2392. [DOI] [PubMed] [Google Scholar]
- 56. Breit SN, Johnen H, Cook AD, Tsai VW, Mohammad MG, Kuffner T, et al. The TGF‐beta superfamily cytokine, MIC‐1/GDF15: a pleotrophic cytokine with roles in inflammation, cancer and metabolism. Growth Factors 2011;29:187–195. [DOI] [PubMed] [Google Scholar]
- 57. von Haehling S, Morley JE, Coats AJS, Anker SD. Ethical guidelines for publishing in the Journal of Cachexia, Sarcopenia and Muscle: update 2015. J Cachexia Sarcopenia Muscle 2015;6:315–316. [DOI] [PMC free article] [PubMed] [Google Scholar]