

Abstract
Background
The total time disabled likely has a greater influence on a patient’s quality of life than the initial occurrence alone.
Objective
To compare the effect of a long-term, structured physical activity program to a health education program on the proportion of patient assessments indicating major mobility disability (i.e., burden) and on the risk of transitions into and out of MMD.
Design
Single-blinded, parallel group randomized trial. (ClinicalTrials.gov: NCT01072500)
Setting
Eight US centers between February 2010 and December 2013.
Participants
1635 sedentary persons, aged 70–89 years, who had functional limitations but were able to walk 400 m.
Interventions
Physical activity (n=818) and health education (n=817).
Measurements
MMD, defined by inability to walk 400 m, was assessed every 6 months for up to 3.5 years.
Results
Over a median follow-up of 2.7 years, the proportion of assessments with MMD was substantially lower in the physical activity group (0.13 [95% CI, 0.11–0.15]) than health education group (0.17 [95% CI, 0.15–0.19]), yielding a risk ratio of 0.75 (0.64–0.89). In a multi-state model, the hazard ratios (95% CI) for comparisons of physical activity with health education were 0.87 (0.73–1.03) for the transition from no MMD to MMD, 0.52 (0.10–2.67) for no MMD to death, 1.33 (0.99–1.77) for MMD to no MMD, and 1.92 (1.15–3.30) for MMD to death.
Limitations
The intention-to-treat principle was maintained for MMD burden and first transition out of no MMD, but not for subsequent transitions.
Conclusions
A structured physical activity program reduced the burden of major mobility disability over an extended period of time, in part through enhanced recovery after the onset of disability and diminished risk of subsequent disability episodes.
Primary Funding Source
National Institute on Aging, National Institutes of Health
Maintaining independent mobility is an important goal of clinical medicine and public health, especially among older persons, who are at the greatest risk for disability. Older persons who lose independent mobility are less likely to remain in the community and have higher rates of morbidity, mortality, and self-care disability.(1–3) They also experience a diminished quality of life, with an increased likelihood of depression and social isolation.(1, 4) In 2004, mobility disability among Medicare beneficiaries was estimated to contribute more than $42 billion in additional health care costs and over two-million additional hospitalizations.(3)
The Lifestyle Interventions and Independence for Elders (LIFE) Study previously reported that a structured moderate-intensity physical activity program significantly reduced the initial occurrence of major mobility disability, compared with a health education program, over an average follow-up of 2.6 years among 1635 sedentary persons aged 70–89 who were nondisabled but had functional limitations.(5) Major mobility disability was defined as the inability to walk 400 m, a distance that is required to carry out many activities and, hence, to be fully independent in the community.(6) Such activities include shopping and walking across a parking lot, to the bus stop, and around a neighborhood.(7) The LIFE Study is the largest and longest randomized trial to evaluate the benefits of physical activity in older persons.(8, 9)
Prior research has shown that disability, including mobility disability, is a dynamic process, with older persons moving in and out of states of disability.(10, 11) After an initial occurrence of disability, episodes of recovery and recurrence contribute to the overall burden of mobility disability over time. From a patient’s perspective, the total time disabled likely has a greater influence on quality of life than the initial occurrence alone.(2) Hence, demonstrating that the physical activity program reduces the overall burden of major mobility disability, by facilitating recovery after an initial occurrence of disability and decreasing the likelihood of subsequent disability episodes (after recovery), would enhance its clinical and public health relevance. The primary goal of the current analysis was to evaluate the effect of the physical activity program, relative to that of the health education program, on the proportion (i.e. burden) of major mobility disability over time. To better understand these results, we also compared the risk of transitions into and out of major mobility disability (MMD) between the two groups.
METHODS
Trial Design and Participants
The LIFE Study was a multicenter, single-blinded randomized trial conducted at eight field centers across the US between February 2010 and December 2013. Details of the methods were published previously.(9) Men and women aged 70–89 were eligible if they (a) were sedentary (reported <20 min/week in past month performing regular physical activity and <125 min/week of moderate physical activity); (b) had functional limitations, defined by a Short Physical Performance Battery (SPPB) score(12) ≤9 out of 12; (c) could walk 400 m in ≤15 minutes without help of another person or walker; (d) had no major cognitive impairment (Modified Mini-Mental State Examination(13) [3MSE] 1.5 standard deviations below education- and race-specific norms); and (e) could safely participate in the intervention as determined by medical history, physical exam and ECG. The primary recruitment strategy was targeted mass mailings to the community.(8) The current manuscript presents results for a secondary analysis that was not pre-specified in the study protocol but was pre-specified in a proposal that was approved by the LIFE Publications and Presentations Committee prior to initiation.
The study protocol, available on request at https://www.thelifestudy.org/public/index.cfm, was approved by the institutional review boards at all participating sites. Written informed consent was obtained from all participants.
Randomization
Participants were randomized to a physical activity or health education program (Appendix Figure 1), via a secure web-based system using a permuted block algorithm (with random block lengths) stratified by field center and sex.
Interventions
The two interventions, including safety, have been previously described.(5, 9) The physical activity intervention consisted of walking, with a goal of 150 min/week, strength, flexibility, and balance training.(9) The intervention included two center-based visits per week and home-based activity 3–4 times per week. The behavioral strategies and operational details for implementing and maintaining the intervention over 3.5 years, including during and after extended leaves for hospitalizations and other illnesses or injuries, are provided elsewhere.(14) Physical activity participants attended 63% of the scheduled sessions (median [IQR], 71% [50%–83%]).(5)
The health education group attended weekly workshops during the first 26 weeks and monthly sessions thereafter. Workshops covered topics of relevance to older persons, such as negotiating the health care system, traveling safely, and preventive services. The program also included a 5- to 10-minute instructor-led program of upper extremity stretching exercises. Health education participants attended 73% of the scheduled sessions (median [IQR], 82% [63%–90%]).(5)
Data Collection
Participants returned to the clinic for follow-up every six months. The assessment staff were masked to the intervention assignment. Race/ethnicity were reported by the participants and were collected according to NIH requirements.
Outcomes
The outcomes for the current manuscript included the proportion of MMD (primary) and the risk of transitions into and out of MMD (secondary) over the entire follow-up period. MMD was defined as inability to walk 400 m within 15 minutes without a walker or personal assistance.(5) MMD was assessed during each follow-up visit through December 2013. When MMD could not be objectively measured, an alternative adjudication of the outcome was based on objective inability to walk 4 m in <10 seconds, or self-, proxy-, or medical record-reported inability to walk across a room.(5) If a definitive determination of MMD status could not be established based on this information, the specific observation (or state) was classified as “indeterminate”. When this information could not be obtained for a participant who was known to be alive, the specific observation (or state) was classified as “censored”. Reports of death were tracked through regular surveillance; and cardiovascular deaths (vs. non-cardiovascular deaths) were adjudicated based on medical records, death certificates, and proxy interviews.
Statistical Analysis
Sample size was based on the primary outcome of time until first occurrence of MMD.(5) For descriptive purposes, the number (%) of transitions into and out of MMD across all time intervals was tabulated by intervention group.
To evaluate the relative effect of randomization to the physical activity program on the proportion (i.e. burden) of MMD over time, a marginal model within the framework of generalized estimating equations (GEE) for repeatedly measured outcomes was used. The primary GEE analysis used a log link, Poisson distribution to characterize the variance, first order autoregressive correlation matrix for estimation, and robust covariance for hypothesis testing. The effect of the intervention was summarized with a risk ratio (95% confidence interval [CI]), after adjusting for field center, sex and a follow-up time effect. Interaction terms were entered into the model to assess the consistency of the intervention effect across levels of five prespecified subgroups (age, sex, race/ethnicity, baseline SPPB score, and baseline 3MSE score). In the primary GEE analysis, the outcome was the presence/absence of MMD, with all other states evaluated as missing outcomes; however, in sensitivity analyses, the presence of MMD or death was considered the outcome. To account for missing outcomes, including the small proportion of participants (2.3%) who had no follow-up data on MMD and the 6.5% (without death) to 7.5% (with death) of outcomes that were intermittently missing, additional sensitivity analyses were performed using multiple imputation. This approach, which is described in the Appendix (Section 1.0), ensured that the intention-to-treat principle would be maintained. All GEE analyses and multiple imputations were performed using SAS (SAS Institute), version 9.4.
A description of the multi-state survival models used to evaluate the bidirectional transitions, including model assumptions and fit, is provided in the Appendix (Section 2.0). In brief, 3-state models based on first-order Markov assumptions were used to compare the risk of transitions into and out of MMD between participants randomized to the two intervention groups.(15, 16) These models, fit in the R msm package,(17) allowed participants to move bidirectionally between states representing the presence/absence of MMD and also contained an absorbing state for death. For the 3-state model (no MMD, MMD, death), indeterminate and censored were combined and treated as a censored state. Because only the first transition out of the no MMD state represents a purely randomized comparison, the model evaluated the association between intervention group and transition risk. Additional models were fit that: 1) evaluated differential intervention effects on transition risk within the first year versus subsequent years; 2) allowed the transition risk to be heterogeneous through time (e.g. different bidirectional risk in the first year versus subsequent years); and 3) included baseline age, sex and cardiovascular history as covariates. Likelihood ratio tests were used to evaluate these additional models; and probabilities of transitions for 6-month intervals were obtained from the models.
For descriptive purposes, we estimated cumulative incidence, accounting for death as a competing risk, for the first three transitions within the health education group. Estimates were obtained for 1 and 2 years of follow-up for no MMD to first MMD. Due to limited follow-up, only 1-year estimates were obtained for first MMD to first recovery and first recovery to second MMD.
Role of Funding Source
The NIH sponsor was a voting member of the Steering Committee, which approved the design and conduct of the study; collection, management, analysis, and interpretation of the data; preparation, review, and approval of the manuscript; and decision to submit the manuscript for publication.
RESULTS
As previously described,(5) the baseline characteristics of the two groups were comparable. More than two out of five participants were 80 years or older, two-thirds were women, about a quarter were racial/ethnic minority, and two-thirds had some education beyond high school. The mean number of chronic conditions was 1.6, with hypertension (prevalence 70.4%), cardiovascular disease (30.0%), and diabetes (25.4%) being most common. Nearly a third of participants had mild impairment in their cognition, based on a 3MSE score <90, and more than 40% had moderate or severe functional limitations, based on an SPPB score <8.
The median duration of follow-up was 2.7 years (interquartile range [IQR], 2.3–3.1) and did not differ between the groups. As shown in Table 1, there were 515 follow-up assessments with MMD in the physical activity group, representing 11.5% of the observations, and 724 in the health education group, representing 16.0% of the observations. Based on the GEE model, the estimated proportion of follow-up assessments with MMD was substantially lower in the physical activity group (0.13 [95% CI, 0.11–0.15]) than health education group (0.17 [95% CI, 0.15–0.19]). When evaluated as a risk ratio, the burden of MMD over the entire follow-up period was significantly reduced by 25% [95% CI, 10%–37%] in the physical activity versus health education group (P=.002), as shown in Figure 1. The results did not differ significantly when participants were categorized by age, sex, race/ethnicity, baseline physical performance, or baseline cognition. In a strict intention-to-treat analysis (i.e. including participants with no follow-up), the benefit of physical activity was maintained (Table 2), with a 15% reduction even under an extreme set of imputation assumptions (MNAR).
Table 1.
Number and Percentage of Transitions between Each State Across all Follow-Up Visits*
| Physical Activity | ||||||
|---|---|---|---|---|---|---|
| To: | No MMD | MMD | Death | Indeterminate/Censored | Totals | |
|
|
||||||
| No MMD | 3475 (89.5%) | 248 (6.4%) | 13 (0.3%) | 145 (3.7%) | 3881 | |
| From: | MMD | 89 (23.4%) | 227 (59.4%) | 29 (7.6%) | 37 (9.7%) | 382 |
| Indeterminate/Censored | 52 (23.0%) | 40 (17.7%) | 6 (2.7%) | 128 (56.6%) | 226 | |
|
|
||||||
| 3616 (80.6%) | 515 (11.5%) | 48 (1.1%) | 310 (6.9%) | 4489 | ||
|
| ||||||
| Health Education | ||||||
| To: | No MMD | MMD | Death | Indeterminate/Censored | Totals | |
|
|
||||||
| No MMD | 3315 (88.3%) | 303 (8.1%) | 15 (0.4%) | 123 (3.3%) | 3756 | |
| From: | MMD | 106 (19.9%) | 379 (69.4%) | 21 (3.8%) | 40 (7.3%) | 546 |
| Indeterminate/Censored | 50 (23.5%) | 42 (19.7%) | 6 (2.8%) | 115 (54.0%) | 213 | |
|
|
||||||
| 3471 (76.9%) | 724 (16.0%) | 42 (0.9%) | 278 (6.2%) | 4515 | ||
Abbreviations: MMD, major mobility disability.
Values represent row percentages; some rows may not add up to 100% because of rounding. Follow-up data were not available on 38 participants: 24 in the physical activity group and 14 in the health education group.
Figure 1.
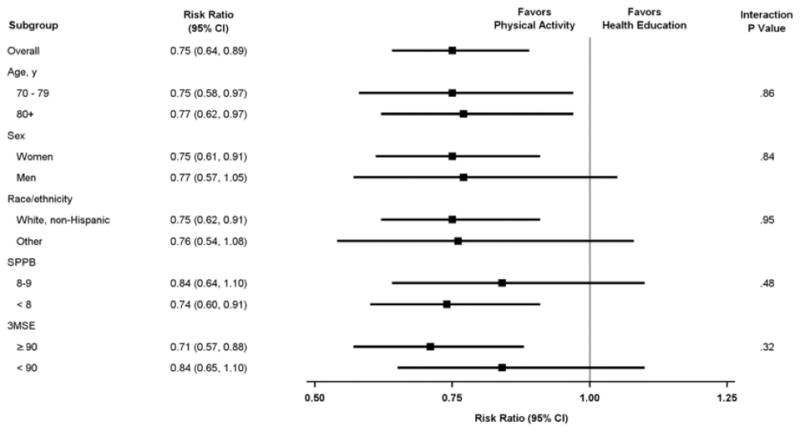
Risk ratios denoting burden of major mobility disability over time for physical activity versus health education according to subgroups.
Table 2.
Effect of Physical Activity on Burden of Major Mobility Disability under Different Imputation Assumptions for Missing Observations*
| Imputation Procedure† | Outcome | Physical Activity
|
Health Education
|
Risk Ratio|| (95% CI) | P-value | ||||
|---|---|---|---|---|---|---|---|---|---|
| N | Observed / Imputed‡ Assessments with Outcome (%) | Total Assessments with Outcome§ (%) | N | Observed / Imputed‡ Assessments with Outcome (%) | Total Assessments with Outcome§ (%) | ||||
| None | MMD | 794 | 12.5 / na | 12.5 | 803 | 17.3 / na | 17.3 | 0.75 (0.64, 0.89) | .001 |
| None | MMD or death | 796 | 14.6 / na | 14.6 | 805 | 19.3 / na | 19.3 | 0.78 (0.66, 0.91) | .002 |
| MAR1 | MMD | 818 | 12.5 / 25.1 | 13.8 | 817 | 17.3 / 28.4 | 18.3 | 0.77 (0.65, 0.91) | .003 |
| MAR2 | MMD or death | 818 | 14.6 / 23.3 | 15.3 | 817 | 19.3 / 26.2 | 19.8 | 0.80 (0.68, 0.93) | .004 |
| MAR3 | MMD | 818 | 12.5 / 23.6 | 13.7 | 817 | 17.3 / 31.1 | 18.6 | 0.76 (0.64, 0.90) | .001 |
| MAR4 | MMD or death | 818 | 14.6 / 22.6 | 15.3 | 817 | 19.3 / 27.9 | 19.9 | 0.79 (0.68, 0.93) | .004 |
| MNAR | MMD | 818 | 12.5 / 37.5 | 15.2 | 817 | 17.3 / 29.6 | 18.4 | 0.85 (0.72, 1.00) | .051 |
Abbreviations: CI, confidence interval; na, not applicable; MAR, missing at random; MNAR, missing not at random; MMD, major mobility disability.
Follow-up data were not available for 38 participants: 24 in the physical activity group and 14 in the health education group. A detailed description of these analyses is provided in the Appendix.
- MAR1: Allow the probability of MMD to be dependent on all prior MMD states (i.e. main effects for each previous visit-specific outcome variable) and the interaction between the proceeding two time points, where applicable. Terms for the intervention effect were not included in this model.
- MAR2: Redefine the outcome as MMD or death. Repeat multiple imputation as described in MAR1.
- MAR3: To the MAR1 model, add main effects for the intervention and interactions between the intervention effect and all prior outcomes.
- MAR4: Redefine the outcome as MMD or death. Repeat multiple imputation as described in MAR3.
- MNAR: Offset the predicted probabilities in the physical activity group from the MAR1 model so that the overall average prevalence of MMD was three times greater for the imputed assessments than the observed assessments (i.e. 12.5% for observed and 37.5% for imputed).
Percentage for imputed assessments averaged across 10 imputed datasets.
For each imputed dataset, the total value was calculated by (1) taking the sum of the observed and imputed assessments with outcomes across all visits and dividing by the total number of visits; and (2) averaging the results across the 10 imputed data sets.
Each risk ratio was obtained from a linear contrast as the average risk ratio across the follow-up visits. For the imputed results, the risk ratios were then averaged across the 10 datasets.
As shown in Table 1, the percentages of all transitions from no MMD to MMD and from no MMD to death were larger in the health education than physical activity group, while the converse was observed for all transitions from MMD to no MMD and from MMD to death. Transitions from the indeterminate/censored state represented only a small percentage of all possible transitions (4.9%) and were similar between the physical activity (5.0%; 226 of 4489) and health education (4.7%; 213 of 4515) groups. The overall percentage of transitions to the indeterminate/censored state did not differ significantly between the two groups (6.9% for physical activity vs. 6.1% for health education; P=.19). Results were similar for transitions to the indeterminate/censored state from No MMD (P=.18), MMD (P=.41) and Indeterminate/Censored (P=.60). For both physical activity and health education, censored observations represented a minority of the indeterminate/censored states, as shown in Appendix Table 1.
The 6-month transition probabilities from No MMD and MMD for a 3-state model are provided in the first panel of Figure 2. The values are consistent with the percentages for the corresponding transitions in Table 1, with the physical activity group having a lower probability of transitioning from No MMD to MMD, relative to the health education group, but higher probabilities to transitioning from MMD to No MMD and death, respectively. In a series of interim models (Appendix Table 2), we found that the transition risks differed between the first year of follow-up and post-year one (P=.006), the associations between the intervention and transition risks did not differ between these two time periods (P=.50), and the transition risks were dependent on baseline age, sex and cardiovascular history (P<.001). In the final multi-state model, which accounted for these three considerations, the hazard ratios (95% CI) for comparisons of physical activity with health education were 0.87 (0.73–1.03) for the transition from no MMD to MMD, 0.52 (0.10–2.67) for the transition from no MMD to death, 1.33 (0.99–1.77) for the transition from MMD to no MMD, and 1.92 (1.15–3.20) for the transition from MMD to death. As shown in the second and third panels of Figure 2, the 6-month transition probabilities from this multi-state model were lower for transitions from no MMD to MMD in Year 1 than in subsequent years and for transitions from MMD to no MMD in subsequent years than in Year 1.
Figure 2.
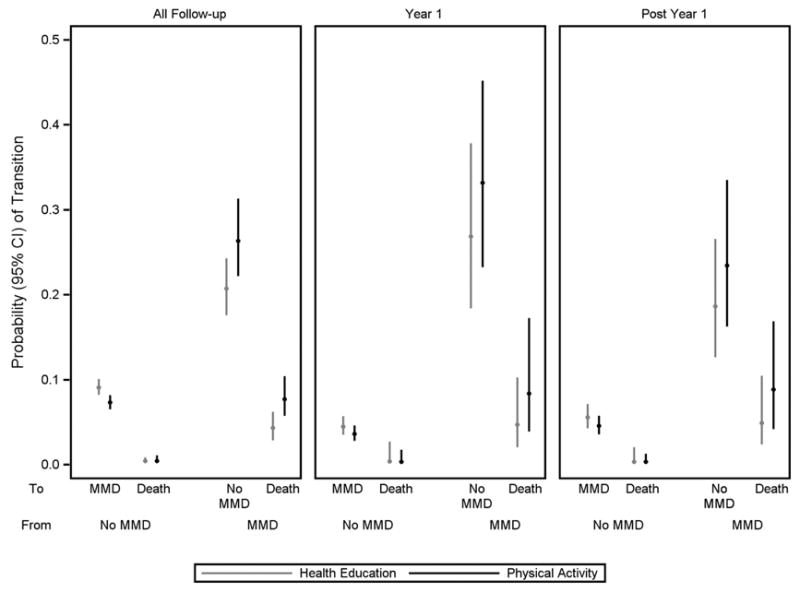
Six-month probability of transitions between no MMD, MMD and death according to intervention group for all follow-up, Year 1 and post Year 1. Values were estimated from the multi-state model, as described in the Appendix (Section 2.0). MMD denotes major mobility disability. Bars represent 95% confidence intervals.
For the health education group, the cumulative incidence rates (95% CI) for no MMD to first MMD were 16.6% (14.1–19.2) and 28.3% (25.1–31.5) after 1 and 2 years of follow-up. The rates were considerably higher after only 1 year of follow-up for first MMD to first recovery (43.7% [36.8–50.4]) and first recovery to second MMD (62.0% [46.8–74.0]).
DISCUSSION
In an earlier report,(5) we demonstrated that the LIFE physical activity intervention, compared with the health education intervention, reduced the risk of initial MMD by 18% and the risk of persistent MMD, defined as two consecutive 6-month assessments with MMD, by 28%. The current study extends these earlier results by demonstrating that the physical activity intervention reduced the overall burden of (i.e. amount of time with) MMD over the entire 3.5-year follow-up period by 25%. This reduction was accomplished not only by decreasing the risk of initial MMD, as shown in the earlier report,(5) but also through enhanced recovery after an occurrence of MMD and a diminished risk of subsequent MMD episodes.
These new results enhance the clinical and public health relevance of the physical activity intervention. Unlike conditions that invariably progress, such as Alzheimer’s disease, mobility disability, especially in older persons, is a dynamic process, characterized by frequent transitions between states of independence and disability over time.(11) Interventions to promote independent mobility, therefore, should focus not only on preventing the initial occurrence of mobility disability but also on restoring and maintaining independent mobility in older persons who become disabled. Aside from acute disabling conditions, such as stroke or hip fracture, evidence supporting the benefit of interventions to facilitate recovery of independent mobility is relatively scant; and no prior study, to our knowledge, has demonstrated benefit of an intervention to maintain independent mobility after recovery from a disability episode.
Although the physical activity intervention was associated with a 13% relative reduction in the rate of transitioning from no MMD to MMD (when considering only the prior state), the 95% confidence interval spanned 1.0. A possible explanation for these results is that the physical activity intervention was more effective in reducing the initial occurrence of MMD than in reducing subsequent occurrences. Even if the relative reduction is diminished over time, the absolute reduction in MMD would likely be greater for the second versus first occurrence because the cumulative incidence rate was much higher for the second occurrence of MMD than the first. For similar reasons, the absolute benefit of physical activity may also be greater for facilitating recovery than preventing the initial occurrence of MMD, especially given the 33% relative increase in recovery. The behavioral strategies used to enhance return of participants to physical activity after an extended medical leave(14) may have been instrumental in promoting recovery after an intervening illness or injury.(18)
Surprisingly, the physical activity intervention was associated with an increased risk of death among participants with MMD. This association was not observed among participants without MMD. The reason for these discordant results is not clear. One possibility is that participants in the physical activity group who had MMD prior to death were more debilitated than their counterparts in the health education group, thereby placing them at higher risk of death. This might occur, for example, if the physical activity intervention was not effective in preventing the initial or subsequent occurrences of MMD or in promoting recovery from MMD among the most functionally limited participants. In subgroup analyses, however, we found that the intervention was at least as effective in reducing the burden of MMD among participants with SPPB scores <8 than those with higher scores. Moreover, in a post hoc analysis, we found that the SPPB score in the assessment prior to death was higher in the physical activity group (6.8) than health education group (5.3). A second possibility is that the physical activity intervention is not safe in a subset of participants with MMD. When we evaluated the cause of death among participants with MMD, we found that the proportion of cardiovascular deaths was higher in the health education group (7/21, 33%) than physical activity group (7/29, 24%), diminishing concerns about cardiovascular safety. A third possibility is that the increased risk of death was spurious or due to unaccounted factors that may have differentially changed between participants in the two treatment groups who developed MMD during the trial. For example, among participants with MMD, hospitalization for a serious illness or injury may have been more common in the physical activity group than the health education group, leading to an increased risk of death in the physical activity group.(19) Although randomization should protect against such a bias for the initial MMD transition, it would not do so for subsequent transitions, which occurred in a non-random subset of participants. Because the intention-to-treat principle was maintained, the results for overall MMD burden should not be susceptible to this type of bias. Evaluating the role of intervening hospitalizations on the benefit of structured physical activity was beyond the scope of the current manuscript but will be the focus of a subsequent analysis.
Our study has other limitations. First, data on MMD were not available for about 7% of the follow-up assessments. This value did not differ appreciably between the two treatment groups, and the benefit of physical activity in reducing the burden of MMD was maintained using an array of different imputation assumptions for missing data. Second, prior to death, some nondisabled participants could have developed MMD that was not ascertained. When death was evaluated as MMD in a sensitivity analysis, the risk ratio for the overall burden of MMD did not change appreciably. Third, because the time between assessments was six months, some occurrences of MMD and MMD recovery may have been missed. Given the beneficial effects of the physical activity intervention, this would likely have resulted in conservative results for transitions from no MMD to MMD and from MMD to no MMD, respectively. Moreover, the results for MMD burden should not have been affected since prior work has shown that estimates of active and disabled life expectancy are not sensitive to the duration of the assessment interval.(20)
Our study had several strengths, including the large and racially diverse sample of vulnerable older persons from eight field centers spanning the US, the long duration of the interventions and follow-up, and excellent retention. In addition, adherence rates to the physical activity intervention were similar or higher than those achieved in other shorter studies involving older persons.(21) Finally, because fewer than 5% of age-eligible persons were excluded on the basis of an underlying medical condition, our results should be broadly applicable to our target population of sedentary older persons with functional limitations who do not already have major mobility disability.
Preserving community mobility is central to maintaining a high quality of life, including retention of many activities that are needed to be fully independent and engaged in the community. In addition, loss of community mobility is associated with multiple adverse outcomes, including worsening disability and morbidity, increases in health care utilization and costs, institutionalization, and death.(1–3, 22, 23) To enhance independent mobility, it is important not only to prevent the initial occurrence of disability, but also to restore and maintain independent mobility in older persons who become disabled. The current study provides strong evidence that the LIFE physical activity intervention reduced the overall burden of major mobility disability over an extended period of time, in part through enhanced recovery after an occurrence of disability and a diminished risk of subsequent disability episodes. These results highlight the long-term value of the LIFE physical activity intervention in promoting independent mobility among vulnerable older persons.
Supplementary Material
Flow of Participants Through the Study.
SPPB denotes Short Physical Performance Battery. MMD denotes major mobility disability. GEE denotes generalized estimating equations.
*Participants who did not receive the allocated intervention (i.e., attended no intervention sessions).
†Partial follow-up indicates participants who had censoring times prior to the last planned follow-up visit.
‡Discontinuation of the intervention was operationalized as participants who did not attend at least one intervention session during their last six months of follow-up prior to the last planned follow-up visit date. Deaths and intervention withdrawals are included in these numbers.
Acknowledgments
We thank Evan C. Hadley, MD, and Sergei Romashkan, MD, PhD, from the National Institute on Aging (Bethesda, Maryland), for their substantial intellectual contribution to the development and implementation of the LIFE Study. Dr. Hadley and Dr. Romashkan are federal employees fully paid by the NIH. They did not receive any additional compensation from the study.
Grant Support:
The Lifestyle Interventions and Independence for Elders Study is funded by cooperative agreement U01AG22376 from the National Institutes of Health (NIH) and National Institute on Aging; supplement U01AG022376 from the National Heart, Lung, and Blood Institute; and was sponsored in part by the Intramural Research Program. The research is partially supported by the Claude D. Pepper Older Americans Independence Centers at the University of Florida (P30AG028740), Wake Forest University (P30AG21332), Tufts University (P30AG031679), University of Pittsburgh (P30AG024827), and Yale University (P30AG021342) and the NIH/NCATS CTSA at Stanford University (UL1RR025744), at University of Florida (U54RR025208) and at Yale University (UL1TR000142). Tufts University is also supported by the Boston Rehabilitation Outcomes Center (R24HD065688) and the U.S. Department of Agriculture, under agreement No. 58-1950-4-003. LIFE investigators are also partially supported by the following: Dr. Gill is the recipient of an Academic Leadership Award (K07AG043587) from the National Institute on Aging. Any opinions, findings, conclusion, or recommendations expressed in this publication are those of the author(s) and do not necessarily reflect the view of the U.S. Department of Agriculture.
Footnotes
Author Contributions
Dr. Miller had full access to all of the data in the study and takes responsibility for the integrity of the data and the accuracy of the data analysis.
Reproducible Research Statement
Study protocol: available on request at www.thelifestudy.org/public/index.cfm.
Statistical code and data set: available from Dr. Miller (mmiller@wakehealth.edu).
Data sharing
Information is available at www.thelifestudy.org/public/index.cfm under the LIFE coded dataset access link.
References
- 1.Fried LP, Guralnik JM. Disability in older adults: evidence regarding significance, etiology, and risk. J Am Geriatr Soc. 1997;45:92–100. doi: 10.1111/j.1532-5415.1997.tb00986.x. [DOI] [PubMed] [Google Scholar]
- 2.Iezzoni LI. When walking fails: mobility problems of adults with chronic conditions. Berkeley, CA: University of California Press; 2003. [Google Scholar]
- 3.Hardy SE, Kang Y, Studenski SA, Degenholtz HB. Ability to walk 1/4 mile predicts subsequent disability, mortality, and health care costs. J Gen Intern Med. 2011;26:130–5. doi: 10.1007/s11606-010-1543-2. [DOI] [PMC free article] [PubMed] [Google Scholar]
- 4.Bruce ML. Depression and disability in late life: directions for future research. Am J Geriatr Psychiatry. 2001;9:102–12. [PubMed] [Google Scholar]
- 5.Pahor M, Guralnik JM, Ambrosius WT, Blair S, Bonds DE, Church TS, et al. Effect of structured physical activity on prevention of major mobility disability in older adults: the LIFE study randomized clinical trial. JAMA. 2014;311:2387–96. doi: 10.1001/jama.2014.5616. [DOI] [PMC free article] [PubMed] [Google Scholar]
- 6.Chang M, Cohen-Mansfield J, Ferrucci L, Leveille S, Volpato S, de Rekeneire N, et al. Incidence of loss of ability to walk 400 meters in a functionally limited older population. J Am Geriatr Soc. 2004;52:2094–8. doi: 10.1111/j.1532-5415.2004.52570.x. [DOI] [PubMed] [Google Scholar]
- 7.Shumway-Cook A, Patla A, Stewart A, Ferrucci L, Ciol MA, Guralnik JM. Environmental components of mobility disability in community-living older persons. J Am Geriatr Soc. 2003;51:393–8. doi: 10.1046/j.1532-5415.2003.51114.x. [DOI] [PubMed] [Google Scholar]
- 8.Marsh AP, Lovato LC, Glynn NW, Kennedy K, Castro C, Domanchuk K, et al. Lifestyle interventions and independence for elders study: recruitment and baseline characteristics. J Gerontol A Biol Sci Med Sci. 2013;68:1549–58. doi: 10.1093/gerona/glt064. [DOI] [PMC free article] [PubMed] [Google Scholar]
- 9.Fielding RA, Rejeski WJ, Blair S, Church T, Espeland MA, Gill TM, et al. The Lifestyle Interventions and Independence for Elders Study: design and methods. J Gerontol A Biol Sci Med Sci. 2011;66:1226–37. doi: 10.1093/gerona/glr123. [DOI] [PMC free article] [PubMed] [Google Scholar]
- 10.Hardy SE, Dubin JA, Holford TR, Gill TM. Transitions between states of disability and independence among older persons. Am J Epidemiol. 2005;161:575–84. doi: 10.1093/aje/kwi083. [DOI] [PubMed] [Google Scholar]
- 11.Gill TM, Allore HG, Hardy SE, Guo Z. The dynamic nature of mobility disability in older persons. J Am Geriatr Soc. 2006;54:248–54. doi: 10.1111/j.1532-5415.2005.00586.x. [DOI] [PubMed] [Google Scholar]
- 12.Guralnik JM, Ferrucci L, Simonsick EM, Salive ME, Wallace RB. Lower-extremity function in persons over the age of 70 years as a predictor of subsequent disability. N Engl J Med. 1995;332:556–61. doi: 10.1056/NEJM199503023320902. [DOI] [PMC free article] [PubMed] [Google Scholar]
- 13.Teng EL, Chui HC. The Modified Mini-Mental State (3MS) examination. J Clin Psychiatry. 1987;48:314–8. [PubMed] [Google Scholar]
- 14.Rejeski WJ, Axtell R, Fielding R, Katula J, King AC, Manini TM, et al. Promoting physical activity for elders with compromised function: the lifestyle interventions and independence for elders (LIFE) study physical activity intervention. Clin Interv Aging. 2013;8:1119–31. doi: 10.2147/CIA.S49737. [DOI] [PMC free article] [PubMed] [Google Scholar]
- 15.Putter H, Fiocco M, Geskus RB. Tutorial in biostatistics: competing risks and multi-state models. Stat Med. 2007;26:2389–430. doi: 10.1002/sim.2712. [DOI] [PubMed] [Google Scholar]
- 16.Meira-Machado L, de Una-Alvarez J, Cadarso-Suarez C, Andersen PK. Multi-state models for the analysis of time-to-event data. Stat Methods Med Res. 2009;18:195–222. doi: 10.1177/0962280208092301. [DOI] [PMC free article] [PubMed] [Google Scholar]
- 17.Jackson C. Multi-State Models for Panel Data: The msm Package for R. J Stat Softw. 2011;38:1–28. [Google Scholar]
- 18.Gill TM, Gahbauer EA, Murphy TE, Han L, Allore HG. Risk factors and precipitants of long-term disability in community mobility: a cohort study of older persons. Ann Intern Med. 2012;156:131–40. doi: 10.1059/0003-4819-156-2-201201170-00009. [DOI] [PMC free article] [PubMed] [Google Scholar]
- 19.Gill TM, Allore HG, Gahbauer EA, Murphy TE. Change in disability after hospitalization or restricted activity in older persons. JAMA. 2010;304:1919–28. doi: 10.1001/jama.2010.1568. [DOI] [PMC free article] [PubMed] [Google Scholar]
- 20.Gill TM, Allore H, Hardy SE, Holford TR, Han L. Estimates of active and disabled life expectancy based on different assessment intervals. J Gerontol A Biol Sci Med Sci. 2005;60:1013–6. doi: 10.1093/gerona/60.8.1013. [DOI] [PubMed] [Google Scholar]
- 21.Ettinger WH, Jr, Burns R, Messier SP, Applegate W, Rejeski WJ, Morgan T, et al. A randomized trial comparing aerobic exercise and resistance exercise with a health education program in older adults with knee osteoarthritis. The Fitness Arthritis and Seniors Trial (FAST) JAMA. 1997;277:25–31. [PubMed] [Google Scholar]
- 22.Newman AB, Simonsick EM, Naydeck BL, Boudreau RM, Kritchevsky SB, Nevitt MC, et al. Association of long-distance corridor walk performance with mortality, cardiovascular disease, mobility limitation, and disability. JAMA. 2006;295:2018–26. doi: 10.1001/jama.295.17.2018. [DOI] [PubMed] [Google Scholar]
- 23.Corti MC, Guralnik JM, Salive ME, Sorkin JD. Serum albumin level and physical disability as predictors of mortality in older persons. JAMA. 1994;272:1036–42. [PubMed] [Google Scholar]
Associated Data
This section collects any data citations, data availability statements, or supplementary materials included in this article.
Supplementary Materials
Flow of Participants Through the Study.
SPPB denotes Short Physical Performance Battery. MMD denotes major mobility disability. GEE denotes generalized estimating equations.
*Participants who did not receive the allocated intervention (i.e., attended no intervention sessions).
†Partial follow-up indicates participants who had censoring times prior to the last planned follow-up visit.
‡Discontinuation of the intervention was operationalized as participants who did not attend at least one intervention session during their last six months of follow-up prior to the last planned follow-up visit date. Deaths and intervention withdrawals are included in these numbers.