

Abstract
Background:
DNA transposons helitrons are mobile genetic elements responsible for major movements of the genetic material within and across different genomes. This ability makes helitrons suitable candidate elements for the development of new approaches of multilocus genotyping of live-stock animals, along with the well-known microsatellite loci.
Objective:
We aimed to estimate the informativeness of helitron and microsatellite markers in assessing the consolidation and the “gene pool” standards of two commercial dairy cattle breeds (Ayrshire breed and holsteinized Black-and-White cattle) and one local breed of Kalmyk cattle, and to reveal any inter-breed difference in the organization of genomic regions flanked by helitrons in the studied cattle breeds.
Method:
We used the combination of two highly-polymorphic genomic elements – helitrons and trinu-cleotide microsatellites (AGC)6G and (GAG)6C, respectively – for genome scanning of the sampled groups of cattle. Also, we pyrosequenced the genomic regions flanked by the inverted repeats of 3'-end of Heligloria family of helitron fragments.
Results:
Generally, the both combinations of markers generated polymorphic spectra, based on which certain interbreed differentiation could be observed. The analysis of the identified interspersed repeats suggests that in factory and local cattle the genomic regions flanked by helitron fragments are shaped differently and contain different superfamilies of transposable elements, especially retrotransposons.
Conclusion:
Despite the well-known fact of retrotransposon-dependent microsatellite expansion, our data suggest that, in the cattle genome, the DNA transposons and microsatellites can also be found in close neighbourhood, and that helitrons and retrotransposons may form domains of increased variability – targets for factors of artificial selection.
Keywords: Genome scanning, Helitrons, Bos taurus, Transposable elements, Microsatellites
1. INTRODUCTION
In recent years, due to the known changes in the global climate and ecological conditions of breeding of agricultural species, the need for the development of new genomic technologies of multilocus genotyping (or genome scanning) of livestock animal has increased. This approach allows to compare and detect multiple genotypes and haplotypes of a large number of genomic elements that are widely and successfully applied in animal breeding and conservation programs [1, 2]. In order to reach the goals of multilocus genotyping, selection of multi-copy and relatively high polymorphic genomic elements is needed. Hence, the markers of polymorphism of genomic regions associated with microsatellite loci are of a great interest, particularly microsatellites with inverted repeats located at relatively short distances (150 - 2000 bp) from each other. This method, developed for more than two decades ago [3], has been called the method of genomic ISSR-PCR (ISSR – inter-simple sequence repeat; PCR – polymerase chain reaction) markers.
The presence of an inverted repeat on the flanks on relatively short distances indicates that these fragments are prone to form non-canonical DNA structures, like loops that have long been discussed as important regulatory elements involved in the regulation of replication, transcription, and recombination [4].
There are data that show the possibility to use the intermicrosatellite markers for revealing genetic diversity in different cattle breeds [5]. Also, we have previously shown that ISSR-PCR markers, such as (AGC)6G and (GAG)6C microsatellite loci, are effective for identifying the interbreed differences in local and factory cattle breeds [6].
Another highly mobile genetic element is the DNA transposon helitron. Helitron superfamily represents a group of transposable DNA elements that use the “rolling circle” replication mechanism, which is typical for single-stranded DNA viruses [7, 8]. Helitrons are actively involved in horizontal transfer of genetic material between distant taxa [9-12] and are considered genuine “DNA shuttles” [13], due to their ability to recombine exons from multiple genes [14]. All known helitrons share certain structural features, which include the 5' TC and 3' CTRR termini and a palindrome sequence (16 to 20 bp) upstream the 3'-end [7, 13]. According to Thomas et al. [15], the 5' and 3'-ends were used for the Heligloria family of helitrons identification in different species: the 3'-end (30 bp) were used for family designations and the 5'-end – for identification of subfamilies.
We have previously shown a fairly high level of polymorphism of genomic regions, flanked by inverted repeats of the 3'-consensus sequence of Heligloria helitron family, and the possibility of such an approach for multilocus genotyping in population genetic studies of ancient and modern musk oxen [16], as well as for evaluation of consolidation of different cattle breeds [17].
Plenty of experimental data in the scientific literature proves that the distribution of microsatellites, and of their inverted repeats, particularly, is closely connected with the transposition mechanisms of retrotransposons, rather than DNA transposons [18-20]. To address this issue, in the current work we conducted a comparative analysis of helitron and microsatellite distribution across the genomes of three cattle breeds via multilocus genotyping, using as primers in ISSR-PCR-like analysis the consensus sequence of the 3'-end of Heligloria helitron family [15], combined with the trinucleotide microsatellites (AGC)6G and (GAG)6C, respectively. We discuss the possibility of the practical use of such an approach for revealing the genetic differences among cattle breeds. Also, we pyrosequenced the genomic regions flanked by the inverted repeats of 3'-end of Heligloria family of helitron fragments, and discuss the DNA transposon helitron and retrotransposons co-localization in the genomes of the studied groups of three cattle breeds.
2. MATERIALS AND METHODS
We conducted genome scanning of 59 cows belonging to 3 cattle breeds: the local beef Kalmyk breed (30 animals), and 2 factory-grown dairy breeds: the Ayrshire breed (15 animals) and the holsteinized Black-and-White cattle (14 animals).
2.1. Sample Preparation and PCR Assay
The DNA was extracted from cattle blood using BioSilica kit (Russia). The PCR samples were prepared using qPCRmix-HS (5x) (Evrogen, Russia) mix and the following set of primers: the consensus sequence of the 3'-end of the Heligloria family of DNA transposons helitrons (Hel-1) (5'-GCAACGCGTGGCCGG-3') [15], and the trinucleotide microsatellites (AGC)6G (5'-AGCAGCAGCAGCAGCAG CG-3') and (GAG)6C (5'-GAGGAGGAGGAGGAGGAGC-3'), in the following combinations: Hel-1 + (AGC)6G and Hel-1 + (GAG)6C. The multilocus genotyping experiment was conducted in triplicate and using a standardized amount of genomic DNA (10 ng per PCR reaction) for each of the analyzed sample. The ISSR-PCR-like amplification was run under optimized conditions (95 °C for 2 min.; 94 °C for 15 sec., 56 °C for 15 sec., 72 °C for 2 min., 40 cycles; 72 °C for 2 min.).
2.2. Data Analysis
The PCR amplification products were separated in ethidium bromide stained agarose gel (1.2%) for 120 min. The length of the amplified fragments was determined using the DNA marker (O'Gene Ruler DNA Ladder mix 100-10 000 bp, Thermo Scientific, USA). Only reproducible and unambigous bands were selected for analysis. Considering the presence or absence of individual bands a binary matrix for all studied animals was constructed. Using the server-run program DendroUPGMA [21] and the Dice similarity coefficient, a similarity matrix was calculated to generate a Newick-formatted tree. The latter was used to visualize the corresponding dendrogram in TreeView [22]. All statistical data on indices of genetic variability were calculated in GenAlEx 6.5 [23].
2.3. DNA Pyrosequencing and Analysis
The 550 bp genomic fragments from different cattle breeds, flanked by the inverted repeats of 3'-end of the identifying sequence of Heligoria family of helitrons, were obtained previously [17]. The amplicon pyrosequencing was performed on GS Junior System (Roche, Switzerland) following the manufacturer's protocols for sample preparation and sequencing. The sequenced DNA fragments were annotated using the NCBI BLASTn (version 2.2.30+) server (Bos_taurus_UMD_3.1.1 reference genome). CENSOR software tool [24] (default parameters) was used for repetitive elements identification.
3. RESULTS and DISCUSSIONS
3.1. Amplicon Analysis
Comparative analysis of ISSR-PCR amplification spectra obtained from genomic DNA of three cattle breeds, using the consensus sequence of 3'-flank of Heligloria helitrons in corresponding combination with (AGC)6G and (GAG)6C microsatellites, revealed certain interbreed differences. Thus, the use of Hel-1 and (AGC)6G pair of primers generated DNA amplicons that generally were of 130 to 1650 bp, but differed for each breed with respect to their number and fragment length range (Fig. 1a, c, e). In genomes of holsteinized Black-and-White cattle the DNA fragments flanked by inverted repeats of helitrons and (AGC)6G sequences are found more frequently (17 bands) than in the genomes of Kalmyk (11 bands) and Ayrshire (5 bands) breeds (Fig. S1 a (142.9KB, pdf) ). We observed the following tendency: the helitron and this microsatellite can be found at short distances in the genomes of all studied groups of cattle (about 130 - 150 bp), regardless the breed origin, which indicates at an existing neighbourhood between these elements. At the same time, the farthest localization of helitrons and (AGC)6G microsatellites has been assessed in mixed animals of holsteinized Black-and-White cattle and aborigine Kalmyk breed (ranges of 1600 - 1650 bp and 990 - 1000 bp, respectively), followed by the group of purebred Ayrshire cattle (870 - 890 bp) (Fig. 1a, c, e). The results of genome scanning, using the consensus sequence of the 3'-flank of Heligloria helitrons and (GAG)6C microsatellite, showed that the obtained amplicons were also polymorphic and differed in the studied groups of cattle. In the Kalmyk breed the length of DNA fragments flanked by helitrons and trinucleotide repeats (GAG)6C ranged 90 - 1300 bp and their number was the highest (16 bands), compared with the same amplification products in holsteinized Black-and-White cattle (11 DNA amplicons) and Ayrshire breed (9 bands) (Fig. 1b, d, f). It is note worthy that in dairy cattle (Ayrshire breed and holsteinized cattle) the shortest distances between the fragments of DNA transposon helitron and (GAG)6C are similar (290 - 300 bp); the differences between the commercial dairy cattle and local Kalmyk cattle are observed in the high molecular zone (Fig. S1 b (142.9KB, pdf) ).
Fig. (1).

Examples of amplification spectra of helitron and microsatellites in the studied cattle breeds. (a), (c), (e) DNA patterns obtained using Hel-1 in combination with (AGC)6G; (b), (d), (f) DNA patterns obtained using Hel-1 combined with (GAG)6C.
The fact that in holsteinized Black-and-White cattle the number of short DNA fragments, flanked by the inverted repeats of DNA transposon helitron, is lower than the number of such DNA fragments, flanked by 3'-end of helitron and AGC (Fig. 1) [16], may indicate that the spread of helitrons is also closely related with their co-localization with tandem repeats in the cattle genome.
3.2. Genetic Diversity and Genetic Profiles of Studied Animals
Comparative analysis of the main indices of genetic diversity in the populations of studied animals, which have been calculated according to the results of multilocus genotyping based on ISSR-PCR method and using the helitron and (AGC)6G microsatellite sequences as primers, shows that the best consolidated group of cattle belongs to the Kalmyk breed. Its representatives have the lowest indices for indicators, like the number of effective alleles (Ne), Shannon's information index (I) and heterozygosity (He, uHe) (Table 1). For Kalmyk cattle we identified one breed-specific DNA band in the low molecular area of approximately 390 - 400 bp (Fig. 1, Fig. S1 a (142.9KB, pdf) ). Although having the same proportion of polymorphic bands (P) with the Kalmyk breed (11.11%) (Table 1), the Ayrshire breed appears to be the least consolidated, based on the amplicon data obtained with Hel-1 and (AGC)6G primers, and lacks in its spectrum unique DNA bands (Fig. 1, Fig. S1 a (142.9KB, pdf) ). The studied population of holsteinized Black-and-White cattle was the most heterogeneous, according to all statistical parameters (Table 1). Moreover, the comparative analysis of the amplicon spectra revealed six unique DNA bands in three molecular regions (300 - 350 bp; 800 - 810 bp; 1130 - 1650 bp) (Fig. 1, Fig. S1 a (142.9KB, pdf) ).
Table 1.
Genetic diversity parameters and their corresponding mean values over loci for each of the sampled populations of cattle. N – number of samples; Na – number of different alleles; Ne – number of effective alleles; I – Shannon's information index; He – expected heterozygosity; uHe – unbiased expected heterozygosity; P (%) – percentage of polymorphic loci.
| Primer Combination | Hel-1 + (AGC)6G | ||||||
|---|---|---|---|---|---|---|---|
| N | Na | Ne | I | He | uHe | P (%) | |
| Kalmyk breed | 30 | 0.722 | 1.029 | 0.033 | 0.020 | 0.020 | 11.11 |
| Ayrshire breed | 15 | 0.389 | 1.079 | 0.065 | 0.044 | 0.046 | 11.11 |
| Holsteinized Black-and-White cattle | 14 | 1.111 | 1.154 | 0.112 | 0.080 | 0.083 | 16.67 |
| Primer Combination | Hel-1 + (GAG)6C | ||||||
| N | Na | Ne | I | He | uHe | P (%) | |
| Kalmyk breed | 30 | 1.222 | 1.122 | 0.141 | 0.087 | 0.088 | 33.33 |
| Ayrshire breed | 15 | 0.889 | 1.211 | 0.195 | 0.129 | 0.134 | 38.89 |
| Holsteinized Black-and-White cattle | 14 | 0.667 | 1.051 | 0.037 | 0.027 | 0.028 | 5.56 |
The genetic profile analysis of the three cattle breeds, obtained after Hel-1 and (AGC)6G application in ISSR-PCR-like genotyping, revealed DNA fragments common for the studied dairy breeds (200 - 210 bp), as well as DNA bands specifically found in the local Kalmyk breed and the holsteinized Black-and-White cattle (420 - 650 bp and 990 - 1000 bp) (Fig. S1 a (142.9KB, pdf) ).
The genome scanning data using Hel-1 and (GAG)6C primers has shown that the population of holsteinized cattle is the most consolidated. It has decreased proportion of polymorphic loci (P = 5.56%), low values for other parameters of genetic diversity (Table 1), and lacks unique amplicons in its DNA spectrum (Fig. S1 b (142.9KB, pdf) ). The population of Kalmyk breed is sufficiently consolidated and has 6 individual DNA bands (in the range of 90 - 220 bp, 830 - 850 bp, 900 - 920 bp, 1250 - 1300 bp) (Fig. 1, Fig. S1 b (142.9KB, pdf) ). Only one individual amplicon is characteristic for the representatives of Ayrshire breed (Fig. S1 b (142.9KB, pdf) ) that seems to be the most genetically diverse population from the study, according to the estimated values for indices of heterozygosity (I, He, uHe) (Table 1). The analysis of the genetic profiles reveals DNA bands (290 - 300 bp) characteristic for the representatives of commercial dairy breeds – the Ayrshire breed and the holsteinized Black-and-White cattle (Fig. S1 b (142.9KB, pdf) ).
3.3. Cluster Analysis
The results of cluster analysis show that the combination of helitron sequence Hel-1 and (AGC)6G microsatellite can be successfully used as primers to conduct population analysis and to reveal interbreed differences in cattle, due to the fact that on the constructed dendrogram each of the three studied cattle breeds form a separate cluster (Fig. 2a). To note that, although belong to two different breeds, the representatives of Kalmyk breed and holsteinized cattle grouped together in a common 2-population cluster on the dendrogram (Fig. 2a).
Fig. (2).

Cluster dendrogram of the studied cattle breeds based on (a) helitron and (AGC)6G profiles and (b) helitron and (GAG)6C profiles.
The cluster analysis based on amplicon spectra of Hel-1 and (GAG)6C microsatellite primers shows that, in general, it is also reliable to use these primers in order to differentiate different cattle breeds (Fig. 2b). The exceptions are some representatives of the Ayrshire breed (01A1, 01A2, 02A2, 03A2) that cluster together with holsteinized Black-and White cattle (Fig. 2b). Such a distribution, similar to that from above-mentioned case of Kalmyk breed, can be explained from the perspective of a widespread use of Holstein breed in crossbreeding aimed to improve milk productivity in other cattle breeds.
3.4. Sequencing Results
In order to consequently reveal the interspersed repeats, which are associated with the regions occupied by helitrons in the cattle genome, and the possible interbreed differences of such associations, we pyrosequenced the genomic regions (of about 550 bp in length) flanked by the inverted repeats of 3'-end of Heligloria helitron fragments. For further analysis we selected the sequence clusters (at least 90% identity between sequences that formed a common cluster) with reliable features of length (≥ 400 bp), coverage (at least 10x), and primer-containing 5' and 3'-flanks (at least 10 nucleotides of the Hel-1 amplification primer).
To identify the repetitive elements in the sequenced genomic fragments, we applied the Genomic Information Research Institute's CENSOR software tool. For each of the studied groups of cattle we determined the frequency of different transposable elements (TEs), identified in the genomic regions, flanked by the inverted sequences of the 3'-end of Heligloria helitrons (Fig. 3). The analysis showed that, generally, the most abundant TEs in the sequenced fragments were represented by the following superfamilies: NonLTR/ L1, LTR/Gypsy, NonLTR/SINE/SINE2, NonLTR/RTE and ERV (Fig. 3). For a great extent, these data are consistent with the results of the cattle genome sequencing [25] that showed that NonLTR repeats (LINE and SINE elements), particularly, are the most abundant. It is interesting that, in the local Kalmyk cattle, in the genomic regions flanked by Heligloria helitrons the NonLTR/L1 autonomous Bos taurus retrotransposons are localized more frequently (22.8%) than in commercial dairy cattle; the frequency of SINE elements is the highest in the corresponding genomic regions from mixed holsteinized cattle (19.8%), comparing with the purebred animals (Fig. 3). At the same time, the analysis of the sequenced genomic fragments revealed TEs that were identified only in a certain breed: ERV/Lentivirus, DNA/Helitron and LTR/BEL – in the group of Ayrshire breed, NonLTR/L2 and DNA/MuDR – in Kalmyk breed, DNA/Mariner – in holsteinized Black-and-White cattle (Fig. 3).
Fig. (3).
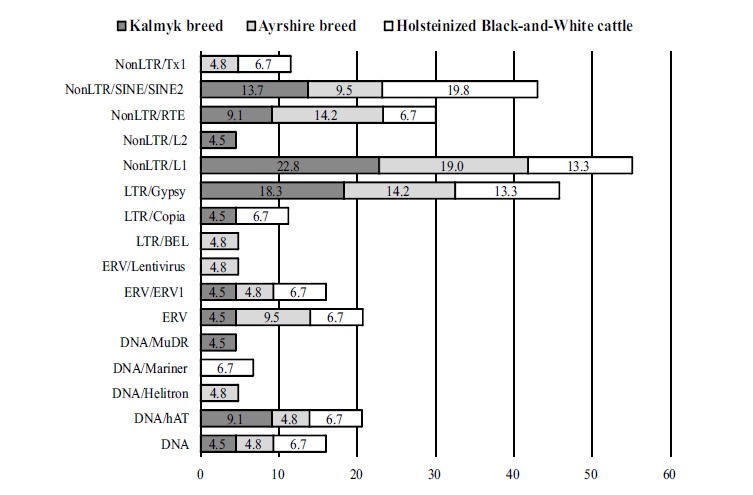
Groups of transposable elements and their corresponding frequency (%), identified in the studied cattle breeds in genomic regions flanked by the inverted repeats of the 3'-end of Heligloria helitrons.
Using the BLASTn algorithm we were able to locate the sequenced fragments on the Bos taurus reference genome, and thus to distribute the TEs, identified for each cattle breed on the corresponding chromosomes (Table 2). The results showed that, despite sharing almost the same TEs, the TE-bearing genomic regions flanked by inverted sequences of Heligloria helitrons, are differently distributed across the chromosomes of the studied cattle breeds (Table 2). Thus, the TEs have been identified in the representatives of the Kalmyk breed, Ayrshire breed and holsteinized Black-and-White cattle on 13, 12 and 7 chromosomes, respectively (Table 2).
Table 2.
Distribution of the transposable elements (TEs), identified in the genomic regions of three cattle breeds flanked by 3'-end of Heligloria helitrons, on Bos taurus reference chromosomes (Bos taurus breed Hereford, Bos_taurus_UMD_3.1.1 genome assembly).
| Breed | Chromosome | Superfamily/Group | TE Name |
|---|---|---|---|
| Kalmyk | 1 | NonLTR/L1 | L1-3_VC |
| 2 | NonLTR/L2 | L2_AC_5 | |
| 3 | LTR/Gypsy | RIRE8C_LTR | |
| 5 | ERV | HERVFH21I | |
| ERV/ERV1 | ERV1-1_TSy-I | ||
| LTR/Gypsy | Gypsy-23-LTR_NVi | ||
| 8 | LTR/Gypsy | RLG_scDEL_1_2-I | |
| NonLTR/RTE | RTE-9_SP | ||
| NonLTR/SINE/SINE2 | MIR3_MarsA | ||
| 11 | NonLTR/RTE | BovB_Oa | |
| 16 | DNA/hAT | MER58A | |
| LTR/Gypsy | Gypsy-18_CPB-I | ||
| 17 | DNA | SETARIA1 | |
| DNA/MuDR | VANDAL1 | ||
| LTR/Copia | Copia6-ZM_I | ||
| NonLTR/SINE/SINE2 | Bov-tA1 | ||
| 19 | NonLTR/SINE/SINE2 | CHR-2A | |
| 21 | DNA/hAT | hAT-7_AMi | |
| 24 | NonLTR/L1 | L1-2_BT | |
| 28 | NonLTR/L1 | L1-BT | |
| X | NonLTR/L1 | L1-BT | |
| Ayrshire | 1 | NonLTR/RTE | BovB_Oa |
| 3 | LTR/Gypsy | RIRE8C_LTR | |
| 4 | NonLTR/Tx1 | Tx1-4_PM | |
| 5 | ERV | HERVFH21I | |
| ERV/ERV1 | ERV1-1_TSy-I | ||
| LTR/Gypsy | Gypsy-23-LTR_NVi | ||
| NonLTR/SINE/SINE2 | MIRb | ||
| 6 | ERV | HUERS-P2 | |
| NonLTR/L1 | L1ME3A | ||
| 8 | LTR/Gypsy | RLG_scDEL_1_2-I | |
| NonLTR/RTE | BovB_Oa | ||
| NonLTR/RTE | RTE-9_SP | ||
| NonLTR/SINE/SINE2 | MIR3_MarsA | ||
| 12 | NonLTR/L1 | L1-BT | |
| 15 | NonLTR/L1 | L1-88_ACar | |
| 16 | DNA/hAT | MER58A | |
| 17 | DNA | SETARIA1 | |
| DNA/Helitron | HELITRON4_OS | ||
| 20 | ERV/Lentivirus | RELIK-I | |
| LTR/BEL | BEL-233_AA-I | ||
| 28 | NonLTR/L1 | L1-BT | |
| Breed | Chromosome | Superfamily/Group | TE Name |
| Holsteinized Black-and-White cattle | 1 | NonLTR/L1 | L1-3_VC |
| 4 | NonLTR/Tx1 | Tx1-4_PM | |
| 5 | ERV/ERV1 | ERV1-1_TSy-I | |
| ERV | HERVFH21I | ||
| LTR/Gypsy | Gypsy-23-LTR_NVi | ||
| 8 | LTR/Gypsy | RLG_scDEL_1_2-I | |
| NonLTR/SINE/SINE2 | MIR3_MarsA | ||
| NonLTR/RTE | RTE-9_SP | ||
| 13 | NonLTR/SINE/SINE2 | CHR2C2_Ttr | |
| NonLTR/L1 | L1-1_Ttr | ||
| 16 | DNA/hAT | MER58A | |
| DNA/Mariner | POT_Cis | ||
| 17 | NonLTR/SINE/SINE2 | Bov-tA1 | |
| LTR/Copia | Copia6-ZM_I | ||
| DNA | SETARIA1 |
Our findings suggest the possibility to use the consensus sequence of the 3'-flank of Heligloria family of DNA transposons helitrons, in combination with the trinucleotide microsatellites (AGC)6G and (GAG)6C, for multilocus genotyping and detection of genetic differentiation of the local Kalmyk breed of beef cattle and two factory breeds of dairy cattle – the Ayrshire breed and holsteinized Black-and-White cattle. Generally, the most “rich” spectra of amplification products are specific to the representatives of the local Kalmyk breed and holsteinized Black-and-White cattle; in contrast, the less “rich” spectra of amplicons has been revealed in the representatives of Ayrshire breed. In the genome of holsteinized cattle the nucleotide sequences flanked by the helitron and (AGC)6G microsatellite sites are found more frequently than the genomic regions comprised between the inverted sequences of Heligloria helitrons alone, which are localized in alternate DNA strands. This suggests some association between genomic localization of helitrons and AGC tracks in this group of cattle.
In contrast, the most abundant amplicon spectrum, obtained as a result of genome scanning using helitron fragment and (GAG)6C microsatellite, has been revealed in the group of the local Kalmyk breed (Fig. S1 (142.9KB, pdf) ). The corresponding spectra of the both groups of dairy cattle are similar and the differences are observed in the high molecular zone only in the holsteinized cattle.
The results of cattle genome sequencing have previously shown that the AGC microsatellite has a higher frequency than the GAG repeats [25]. Moreover, 39% of AGC microsatellite repeats are associated with the species-specific cattle retrotransposon Bov-A2 SINE [25]. Despite the fact that microsatellite expansion within genomes is tightly associated with replication of retrotransposons, according to our data (Fig. S1 (142.9KB, pdf) ), Heligloria helitrons and AGC and GAG microsatellite tracks are, co-localized at short distances in the genomes of the studied cattle breeds.
CONCLUSION
In the current paper we describe the use of the combination of the two highly-polymorphic genomic elements – DNA transposons helitrons and trinucleotide microsatellites (AGC)6G and (GAG)6C, respectively – for multilocus genotyping of two specialized dairy cattle breeds (Ayrshire breed and holsteinized Black-and-White cattle) and one aborigine breed of Kalmyk cattle, and estimate the informativeness of these markers in assessing the consolidation and the “gene pool” standards of the sampled groups of cattle. Despite the well-known fact of retrotransposon-dependent microsatellite expansion, our data suggest that, in the cattle genome, the DNA transposons and microsatellites can also be found in close neighbourhood.
The sequencing results on the interspersed repeats, obtained in the current work, indicate that in factory and local cattle the genomic regions flanked by helitron fragments are shaped differently. Hence, based on these sequencing data, the groups of specialized dairy cattle differ in a less extent than they altogether differ from the aborigine Kalmyk breed. This fact, probably, reflects a different pressure of factors of artificial selection. Therefore, our findings suggest that the studied microsatellites, the helitrons and a series of other transposable elements, revealed in the sequencing experiment, share common domains of localization and, according to interbreed differences, represent the domains of increased variability. This allows to affirm that the areas included in these domains are convenient tools for multilocus genotyping and can be successfully applied for identification and characterization of the gene pools of different cattle breeds and inbred groups, processes that meet the challenges of improvement, consolidation and development of genetic programs of breed conservation.
ACKNOWLEDGEMENTS
The author team would like to address their sincere thanks to the Russian farmers from Kalmykia and Moscow region (Russian Federation) for kindly providing their animals for this research.
SUPPLEMENTARY MATERIAL
Supplementary material is available on the publisher’s web site along with the published article.
CONFLICT OF INTEREST
The authors confirm that this article content has no conflict of interest.
REFERENCES
- 1.Kantanen J., Løvendahl P., Strandberg E., Eythorsdottir E., Li M.H., Kettunen-Præbel A., Berg P., Meuwissen T. Utilization of farm animal genetic resources in a changing agroecological environment in the Nordic countries. Front. Genet. 2015;6:52. doi: 10.3389/fgene.2015.00052. [DOI] [PMC free article] [PubMed] [Google Scholar]
- 2.Legarra A., Croiseau P., Sanchez M.P., Teyssèdre S., Sallé G., Allais S., Fritz S., Moreno C.R., Ricard A., Elsen J.M. A comparison of methods for whole-genome QTL mapping using dense markers in four livestock species. Genet. Sel. Evol. 2015;47:6. doi: 10.1186/s12711-015-0087-7. [DOI] [PMC free article] [PubMed] [Google Scholar]
- 3.Zietkiewicz E., Rafalski A., Labuda D. Genome fingerprinting by simple sequence repeat (SSR)-anchored polymerase chain reaction amplification. Genomics. 1994;20(2):176–183. doi: 10.1006/geno.1994.1151. [DOI] [PubMed] [Google Scholar]
- 4.Tateishi-Karimata H., Isono N., Sugimoto N. New insights into transcription fidelity: Thermal stability of non-canonical structures in template DNA regulates transcriptional arrest, pause, and slippage. PLoS One. 2014;9(3):e90580. doi: 10.1371/journal.pone.0090580. [DOI] [PMC free article] [PubMed] [Google Scholar]
- 5.Stolpovskiĭ Iu.A., Evsiukova A.N., Sulimova G.E. Genomic diversity in cattle breeds assessed using polymorphism of intermicrosatellite markers. Genetika. 2013;49(5):641–648. doi: 10.7868/s0016675813040152. [DOI] [PubMed] [Google Scholar]
- 6.Kosovsky G.Yu., Glazko V.I., Arkhipov A.V., Petrova I.O., Glazko T.T. Dairy cattle population-specific genetic differentiation based on ISSR-PCR markers. Russ. Agric. Sci. 2014;40(6):463–466. [Google Scholar]
- 7.Kapitonov V.V., Jurka J. Rolling-circle transposons in eukaryotes. Proc. Natl. Acad. Sci. USA. 2001;98(15):8714–8719. doi: 10.1073/pnas.151269298. [DOI] [PMC free article] [PubMed] [Google Scholar]
- 8.Kapitonov V.V., Jurka J. Helitrons on a roll: Eukaryotic rolling-circle transposons. Trends Genet. 2007;23(10):521–529. doi: 10.1016/j.tig.2007.08.004. [DOI] [PubMed] [Google Scholar]
- 9.Liu H., Fu Y., Li B., Yu X., Xie J., Cheng J., Ghabrial S.A., Li G., Yi X., Jiang D. Widespread horizontal gene transfer from circular single-stranded DNA viruses to eukaryotic genomes. BMC Evol. Biol. 2011;11:276. doi: 10.1186/1471-2148-11-276. [DOI] [PMC free article] [PubMed] [Google Scholar]
- 10.Guo X., Gao J., Li F., Wang J. Evidence of horizontal transfer of non-autonomous Lep1 helitrons facilitated by host-parasite interactions. Sci. Rep. 2014;4:5119. doi: 10.1038/srep05119. [DOI] [PMC free article] [PubMed] [Google Scholar]
- 11.Thomas J., Phillips C.D., Baker R.J., Pritham E.J. Rolling-circle transposons catalyze genomic innovation in a mammalian lineage. Genome Biol. Evol. 2014;6(10):2595–2610. doi: 10.1093/gbe/evu204. [DOI] [PMC free article] [PubMed] [Google Scholar]
- 12.Coates B.S. Horizontal transfer of a non-autonomous Helitron among insect and viral genomes. BMC Genomics. 2015;16:137–146. doi: 10.1186/s12864-015-1318-6. [DOI] [PMC free article] [PubMed] [Google Scholar]
- 13.Feschotte C., Wessler S.R. Treasures in the attic: Rolling circle transposons discovered in eukaryotic genomes. Proc. Natl. Acad. Sci. USA. 2001;98(16):8923–8924. doi: 10.1073/pnas.171326198. [DOI] [PMC free article] [PubMed] [Google Scholar]
- 14.Gupta S., Gallavotti A., Stryker G.A., Schmidt R.J., Lal S.K. A novel class of Helitron-related transposable elements in maize contain portions of multiple pseudogenes. Plant Mol. Biol. 2005;57(1):115–127. doi: 10.1007/s11103-004-6636-z. [DOI] [PubMed] [Google Scholar]
- 15.Thomas J., Schaack S., Pritham E.J. Pervasive horizontal transfer of rolling-circle transposons among animals. Genome Biol. Evol. 2010;2:656–664. doi: 10.1093/gbe/evq050. [DOI] [PMC free article] [PubMed] [Google Scholar]
- 16.Glazko V.I., Bardukov N.V., Erkenov T.A., Glazko T.T. Genomic scan based on the homologous sequences to DNA transposon Helitron. Integral. 2014;74:30–32. [Google Scholar]
- 17.Babii A.V., Kovalchuk S.N., Glazko T.T., Kosovsky G.Y., Glazko V.I. DNA-transposon helitron in cattle genome. Vet. Korm. 2015;3:30–33. [Google Scholar]
- 18.Smýkal P., Kalendar R., Ford R., Macas J., Griga M. Evolutionary conserved lineage of Angela-family retrotransposons as a genome-wide microsatellite repeat dispersal agent. Heredity (Edinb.) 2009;103(2):157–167. doi: 10.1038/hdy.2009.45. [DOI] [PubMed] [Google Scholar]
- 19.Adelson D.L. Interspersed repeats in the horse (Equus caballus); spatial correlations highlight conserved chromosomal domains. Anim. Genet. 2010;41(Suppl. 2):91–99. doi: 10.1111/j.1365-2052.2010.02115.x. [DOI] [PubMed] [Google Scholar]
- 20.McInerney C.E., Allcock A.L., Johnson M.P., Bailie D.A., Prodöhl P.A. Comparative genomic analysis reveals species-dependent complexities that explain difficulties with microsatellite marker development in mollusks. Heredity (Edinb) 2011;106(1):78–87. doi: 10.1038/hdy.2010.36. [DOI] [PMC free article] [PubMed] [Google Scholar]
- 21.Dendro U.P. A dendrogram construction utility. http://genomes.urv.cat/UPGMA/
- 22.Page R. TreeView: An application to display phylogenetic trees on personal computers. Comput. Appl. Biosci. 1996;12(4):357–358. doi: 10.1093/bioinformatics/12.4.357. [DOI] [PubMed] [Google Scholar]
- 23.Peakall R., Smouse P.E. GenAlEx 6.5: genetic analysis in Excel. Population genetic software for teaching and research – an update. Bioinformatics. 2012;28(19):2537–2539. doi: 10.1093/bioinformatics/bts460. [DOI] [PMC free article] [PubMed] [Google Scholar]
- 24.Kohany O., Gentles A.J., Hankus L., Jurka J. Annotation, submission and screening of repetitive elements in Repbase: RepbaseSubmitter and Censor. BMC Bioinformatics. 2006;7:474. doi: 10.1186/1471-2105-7-474. [DOI] [PMC free article] [PubMed] [Google Scholar]
- 25.Tellam R.L., Worley K.C., Gibbs R.A., Muzny D.M., Weinstock G.M., Adelson D.L., Eichler E.E., Elnitski L., Guigó R., Hamernik D.L., Kappes S.M., Lewin H.A., Lynn D.J., Nicholas F.W., Reymond A., Rijnkels M., Skow L.C., Zdobnov E.M., Schook L., Womack J., Alioto T., Antonarakis S.E., Astashyn A., Chapple C.E., Chen H.C., Chrast J., Câmara F., Ermolaeva O., Henrichsen C.N., Hlavina W., Kapustin Y., Kiryutin B., Kitts P., Kokocinski F., Landrum M., Maglott D., Pruitt K., Sapojnikov V., Searle S.M., Solovyev V., Souvorov A., Ucla C., Wyss C., Anzola J.M., Gerlach D., Elhaik E., Graur D., Reese J.T., Edgar R.C., McEwan J.C., Payne G.M., Raison J.M., Junier T., Kriventseva E.V., Eyras E., Plass M., Donthu R., Larkin D.M., Reecy J., Yang M.Q., Chen L., Cheng Z., Chitko-McKown C.G., Liu G.E., Matukumalli L.K., Song J., Zhu B., Bradley D.G., Brinkman F.S., Lau L.P., Whiteside M.D., Walker A., Wheeler T.T., Casey T., German J.B., Lemay D.G., Maqbool N.J., Molenaar A.J., Seo S., Stothard P., Baldwin C.L., Baxter R., Brinkmeyer-Langford C.L., Brown W.C., Childers C.P., Connelley T., Ellis S.A., Fritz K., Glass E.J., Herzig C.T., Iivanainen A., Lahmers K.K., Bennett A.K., Dickens C.M., Gilbert J.G., Hagen D.E., Salih H., Aerts J., Caetano A.R., Dalrymple B., Garcia J.F., Gill C.A., Hiendleder S.G., Memili E., Spurlock D., Williams J.L., Alexander L., Brownstein M.J., Guan L., Holt R.A., Jones S.J., Marra M.A., Moore R., Moore S.S., Roberts A., Taniguchi M., Waterman R.C., Chacko J., Chandrabose M.M., Cree A., Dao M.D., Dinh H.H., Gabisi R.A., Hines S., Hume J., Jhangiani S.N., Joshi V., Kovar C.L., Lewis L.R., Liu Y.S., Lopez J., Morgan M.B., Nguyen N.B., Okwuonu G.O., Ruiz S.J., Santibanez J., Wright R.A., Buhay C., Ding Y., Dugan-Rocha S., Herdandez J., Holder M., Sabo A., Egan A., Goodell J., Wilczek-Boney K., Fowler G.R., Hitchens M.E., Lozado R.J., Moen C., Steffen D., Warren J.T., Zhang J., Chiu R., Schein J.E., Durbin K.J., Havlak P., Jiang H., Liu Y., Qin X., Ren Y., Shen Y., Song H., Bell S.N., Davis C., Johnson A.J., Lee S., Nazareth L.V., Patel B.M., Pu L.L., Vattathil S., Williams R.L., Jr, Curry S., Hamilton C., Sodergren E., Wheeler D.A., Barris W., Bennett G.L., Eggen A., Green R.D., Harhay G.P., Hobbs M., Jann O., Keele J.W., Kent M.P., Lien S., McKay S.D., McWilliam S., Ratnakumar A., Schnabel R.D., Smith T., Snelling W.M., Sonstegard T.S., Stone R.T., Sugimoto Y., Takasuga A., Taylor J.F., Van Tassell C.P., Macneil M.D., Abatepaulo A.R., Abbey C.A., Ahola V., Almeida I.G., Amadio A.F., Anatriello E., Bahadue S.M., Biase F.H., Boldt C.R., Carroll J.A., Carvalho W.A., Cervelatti E.P., Chacko E., Chapin E., Cheng Y., Choi J., Colley A.J., de Campos T.A., De Donato M., Santos I.K., de Oliveira C.J., Deobald H., Devinoy E., Donohue K.E., Dovc P., Eberlein A., Fitzsimmons C.J., Franzin A.M., Garcia G.R., Genini S., Gladney C.J., Grant J.R., Greaser M.L., Green J.A., Hadsell D.L., Hakimov H.A., Halgren R., Harrow J.L., Hart E.A., Hastings N., Hernandez M., Hu Z.L., Ingham A., Iso-Touru T., Jamis C., Jensen K., Kapetis D., Kerr T., Khalil S.S., Khatib H., Kolbehdari D., Kumar C.G., Kumar D., Leach R., Lee J.C., Li C., Logan K.M., Malinverni R., Marques E., Martin W.F., Martins N.F., Maruyama S.R., Mazza R., McLean K.L., Medrano J.F., Moreno B.T., Moré D.D., Muntean C.T., Nandakumar H.P., Nogueira M.F., Olsaker I., Pant S.D., Panzitta F., Pastor R.C., Poli M.A., Poslusny N., Rachagani S., Ranganathan S., Razpet A., Riggs P.K., Rincon G., Rodriguez-Osorio N., Rodriguez-Zas S.L., Romero N.E., Rosenwald A., Sando L., Schmutz S.M., Shen L., Sherman L., Southey B.R., Lutzow Y.S., Sweedler J.V., Tammen I., Telugu B.P., Urbanski J.M., Utsunomiya Y.T., Verschoor C.P., Waardenberg A.J., Wang Z., Ward R., Weikard R., Welsh T.H., White S.N., Wilming L.G., Wunderlich K.R., Yang J., Zhao F.Q., Bovine Genome Sequencing and Analysis Consortium The genome sequence of taurine cattle: a window to ruminant biology and evolution. Science. 2009;324(5926):522–528. doi: 10.1126/science.1169588. [DOI] [PMC free article] [PubMed] [Google Scholar]
Associated Data
This section collects any data citations, data availability statements, or supplementary materials included in this article.
Supplementary Materials
Supplementary material is available on the publisher’s web site along with the published article.