Abstract
Background and Objective:
Type 2 diabetes mellitus (T2DM) may affect bone loss differentially in adult males and postmenopausal females. We evaluated the prevalence of osteoporosis in otherwise healthy adults with T2DM.
Materials and Methods:
In a cross-sectional study, adults with T2DM, aged 50 years and above, were evaluated for bone mineral density (BMD) using dual-energy X-ray absorptiometry (DXA) scan at spine and hip. T-score of ≤−2.5 was defined as osteoporosis and score −2.49 to −1.0 as osteopenia at either site. Correlation of low BMD with demographic, clinical, and laboratory parameters including serum Vitamin D and serum testosterone (in males) was evaluated.
Results:
In 200 patients, mean age was 64.5 ± 7.0 years and age differed significantly in males and females (P < 0.0001). Osteoporosis was present in 35.5% adults with T2DM. Significantly greater proportion of females had osteoporosis (49.5% vs. 22.3%, P < 0.0001). Frequency of osteoporosis at spine (33.5%) was higher than the same at hip (13.5%). Compared to males, significantly greater proportion of females had osteoporosis and osteopenia at both spine (P < 0.0001) and hip (P < 0.0001). Among all parameters assessed, a significant positive correlation of T-score at spine and hip was seen with body mass index in both males (r = 0.287, P = 0.003 at spine and r = 0.421, P < 0.0001 at hip) and females (r = 0.291, P = 0.004 at spine and r = 0.280, P = 0.010 at hip). There was no association of Vitamin D deficiency (45.5% patients) with either T-score and presence of osteoporosis either at spine (P = 0.388 and P = 0.177) or hip (P = 0.431 and P = 0.593).
Conclusion:
Prevalence of osteoporosis in otherwise healthy T2DM was 35.5% with greater prevalence in females than males. Body mass but not Vitamin D or testosterone has an important role in the determination of bone loss in T2DM.
Keywords: Bone mineral density, osteoporosis, sex, Type 2 diabetes mellitus
INTRODUCTION
Type 2 diabetes mellitus (T2DM), a chronic multisystem disorder, is known to increase fractures risk.[1] With increasing age, the risk of diabetes and osteoporosis both increases which can lead to greater incidence of fractures.[2,3] Although individuals with T2DM show higher bone mineral density (BMD), a higher fracture risk exists.[1,3,4] Pathophysiologically, impaired bone repair resulting from accumulation of microcracks and increased cortical porosity is reported.[5,6] Osteoporosis is more frequent in postmenopausal women. Postmenopausal women with type 1 diabetes are reported to have 12.25 times increased risk of hip fractures than nondiabetic women.[7] A greater degree of osteopenia and osteoporosis has also been reported in postmenopausal women with T2DM.[8] In these perspectives, we need to look at Indian population in a different way because of cultural diversities. Clinical studies in India have revealed contrasting results to Western studies in that a lower BMD in T2DM was reported by the most,[9,10,11,12] whereas only a few found no difference in BMD in T2DM compared to control.[13] To further ascertain the prevalence of osteoporosis in T2DM, we assessed the BMD at spine and hip in otherwise healthy T2DM patients from Jaipur, Rajasthan, India and determined correlation of the osteoporosis with various biochemical parameters.
MATERIALS AND METHODS
This cross-sectional, observational study was conducted at a tertiary care center in a tier I Metro city of Rajasthan, India in T2DM patients. After ethical committee approval, consecutive 200 cases of T2DM were enrolled over 2 years between January 2015 and December 2016. Patients of age 50 years and above, either gender, and new or known T2DM were included in the study. Patients diagnosed with diabetes-associated micro- and macro-vascular complications, chronic smokers, chronic kidney disease, primary hyperparathyroidism, thyroid disorders, obvious bone and mineral disorders, chronic pancreatitis or pancreatectomized, systemic inflammatory disorders, malabsorption syndromes, malignancy, or those receiving corticosteroids, immunosuppressants, anticonvulsants, calcium, and Vitamin D supplements, thiazolidinediones, and insulin, and chronic debility or bedridden patients were excluded from the study.
Recruited patients were subjected to clinical history and detailed examination, biochemistry evaluation, and BMD assessments. Age, gender, weight, and body mass index (BMI, kg/m2) of all patients were noted. Blood samples were collected in fasting state and were analyzed for serum calcium, phosphorus, total protein, albumin, alkaline phosphatase (ALP), intact parathyroid hormone (iPTH), thyroid stimulating hormone (TSH), Vitamin D, and testosterone levels (ADVIA Ccentaur XP Immunoassay Siemens Limited, Germany). Strict cold chain was maintained for sample subjected to iPTH assessments.
BMD was analyzed at two sites – spine and hip using DXA (Hologic explorer DXA system, USA). For each site, calibration was performed before taking scans in each patient. Proper positioning was ascertained before and during the scans. A trained technician performed DXA scans in all patients enrolled. T-scores were calculated. As recommended by the World Health Organization,[14] a T-score of 2.5 or lower was considered as osteoporosis at either site while T-score between −1.0 and −2.5 was considered as osteopenia.
Statistical analysis
Data were analyzed with descriptive statistics representing continuous variables by mean ± standard deviation and categorical variables by frequency and percentages. Statistical comparison in these two variables was done using two sample Student's t-test and Chi-square test, respectively. Correlation between different variables and T-scores was assessed with Pearson coefficient. P < 0.05 was considered statistically significant.
RESULTS
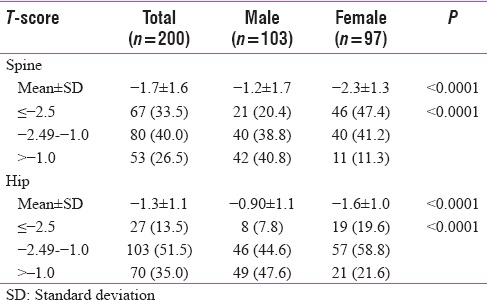
In 200 patients evaluated in our study, mean age was 64.5 ± 7.0 years and BMI was 26.0 ± 4.8 kg/m2. In two genders, mean age was significantly lower (P < 0.0001) and mean BMI was significantly higher with a higher proportion of females in overweight/obese category as compared to males (P < 0.0001 for all comparisons). Baseline characteristics of patients are shown in Table 1. In overall study population, mean level of serum calcium (9.0 ± 0.6 mg/dL), ALP (81.6 ± 29.0 U/L), iPTH (51.8 ± 30.7 pg/mL), and TSH (3.4 ± 3.6) was within normal limits with no significant differences in their levels in males and females. Serum phosphorus though in normal limits and marginally higher in females than males, a statistically significant difference was present (P = 0.001) whereas albumin was marginally but significantly lower in females (P = 0.025). Mean Vitamin D level was 23.9 ± 14.0 mg/dL with no significant difference in two genders (P = 0.624). Vitamin D deficiency (levels < 20 ng/dL) was present in 45.5% with near equal distribution in males and females (44.7% vs. 46.4%, P = 0.806). Mean serum testosterone levels in males were 354.6 ± 131.8 ng/dL. Osteoporosis defined by T-score ≤ −2.5 at spine and/or hip was seen in 35.5% cases where proportion of females was significantly higher than males (49.5% vs. 22.3%, respectively, P < 0.0001) [Figure 1]. Similarly, when T-score was assessed at two sites, osteoporosis was evident in 33.5% and 13.5% patients at spine and hip, respectively. Mean T-score at hip and spine was significantly lower in females. Furthermore, significantly higher proportion of females had osteoporosis and osteopenia at spine (47.4% and 41.2% vs. 20.4% and 38.8%, respectively, P < 0.0001) and spine (19.6% and 58.8% vs. 7.8% and 44.6%, respectively, P < 0.0001) as shown in Table 2.
Table 1.
Baseline characteristics of study population
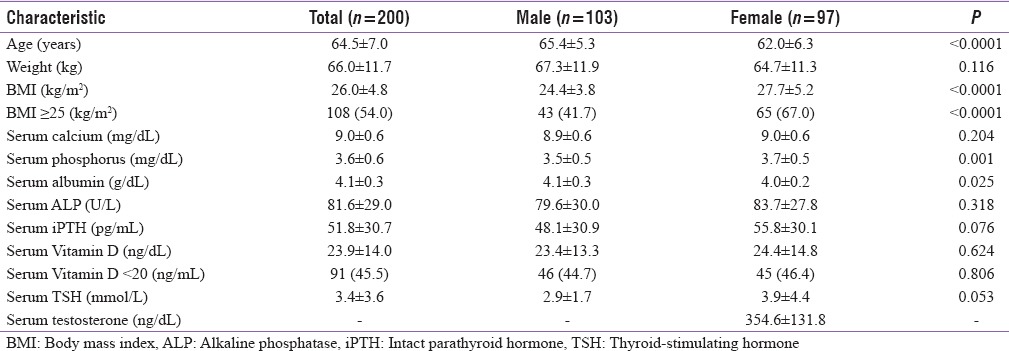
Figure 1.
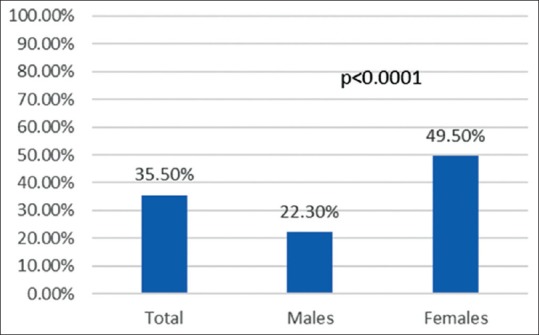
Osteoporosis in overall population and in two genders
Table 2.
Bone mineral density distribution at different sites
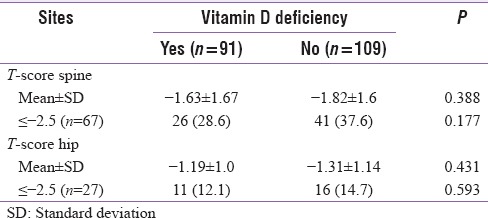
Correlations between various parameters and T-score at two sites in total population and in males and females are shown in Table 3. Only BMI showed consistent positive correlation with T-score in total population which was significant at hip (r = 0.182, P = 0.010). Furthermore, at spine and hip, there was a significant correlation seen in females (r = 0.291, P = 0.004 and r = 0.280, P = 0.006, respectively) and males (r = 0.287, P = 0.003 and r = 0.421, P < 0.0001, respectively). Serum phosphorus correlated negatively with T-score at spine only (r = −0.144, P = 0.042) but not at hip. There was no significant correlation seen with age, serum calcium, serum albumin, ALP, iPTH, serum Vitamin D, TSH, or testosterone (in males only) at either site [Table 3]. Association of Vitamin D deficiency with T-scores is described in [Table 4]. Mean T-scores at spine and hip were slightly lower in patients with vitamin deficiency but did not reach statistical significance. Compared to patients with normal levels of Vitamin D, proportion of patients with osteoporosis (T-scores ≤ −2.5) was non-significantly lower in patients with Vitamin D deficiency at spine and hip.
Table 3.
Correlation of patient characteristics with bone marrow density at different sites
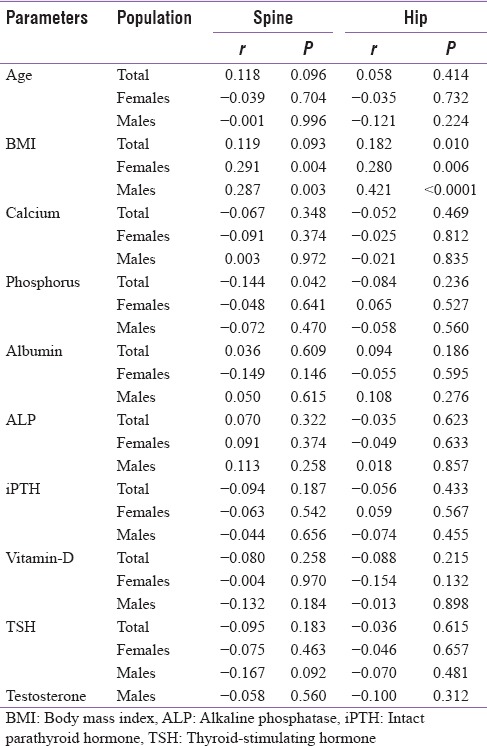
Table 4.
Vitamin D deficiency association with bone density at different sites
DISCUSSION
In this cross-sectional evaluation, overall osteoporosis was present in 35.5% of patients with T2DM. This is greater compared to finding of Kamalanathan et al.[15] who reported osteoporosis in 19.5% of patients with T2DM. Osteoporosis prevalence defined by T-score ≤ −2.5 at spine was slightly greater than at hip (33.5% vs. 13.5%, respectively) with a similar trend seen in males (20.4% vs. 7.8%, respectively) and females (47.4% vs. 10.6%, respectively). This observed prevalence of osteoporosis in men at hip is similar to finding of Agrawal and Sharma[16] who reported the prevalence of 8.5% at hip. However, our finding contrasted to the evaluation from Leidig-Bruckner et al.[17] in patients with T2DM who reported the greater prevalence of osteoporosis at hip (13% men and 21.9% women) than at spine (6.1% men and 9.4% women). This finding needs further exploration to determine the factors that could contribute to greater bone loss at spine (trabecular bone) than hip (cancellous bone).
A greater occurrence of osteopenia and osteoporosis in females than males is possibly attributable to postmenopausal osteoporosis in women. As the age of study population was 50 years and above, the osteoporosis was greater in females even though the mean age was significantly lower than males (P < 0.0001). The average age of menopause in Indian women is 46.2 years as against the 51 years in the Western world.[18] The bone loss in women is known to accelerate in late perimenopausal period and continues at the samerate in postmenopausal phase.[19] T2DM is associated with deteriorating bone quality increasing the risk of osteoporotic fractures.[20] This adds to the bone loss in postmenopausal phase leading to greater loss of bone in females than males. We observed significantly lower mean T-scores in females than males at spine (P < 0.0001) as well as at hip (P < 0.0001). This was further supported by finding of greater proportion females having T-score −2.5 or below than males at both sites (spine P < 0.0001 and hip P = 0.014).
From among various factors, only BMI showed consistent and significant positive correlation with T-scores at spine and hip in the overall study population (except for spine) as well as in two genders. Previous studies have reported relation of BMI in osteoporotic fractures. A study from Norway reported a greater hazard of hip fracture with lower BMI. Compared to BMI of 22–24.9 females and males, BMI < 22 had hazard ratio (HR) 1.38 and 1.66, whereas BMI of 30 or more had HR of 0.57 and 0.77, respectively.[21] Patients with BMI > 25 were 54% in our study with significantly greater proportion of females than males (67% vs. 41.7%, P < 0.0001). In multivariable analysis, Dutta et al.[11] observed a significant positive correlation of BMI with spine BMD (r = 0.372, P = 0.047) in T2DM which is similar to our observation. Another study from India reported a positive correlation of BMI with BMD at spine (r = 0.210) and hip (r = 0.300).[9] These findings suggest that mechanical factors associated with BMI may affect the bone turnover. Weight is known to affect bone loss from spine and hip. Finkelstein et al.[19] reported 35%–55% slower rate of bone loss from spine and hip in women in the top tertile than lowest weight tertile. This needs further evaluation in Indian subset on how weight and BMI can affect bone turnover and further modify osteoporosis fracture risks in females and males.
As the apparent levels of other bone disease markers were relatively normal and exclusion of major causes of bone loss, testosterone, and Vitamin D is thought to play a role in bone loss. However, testosterone in males had no correlation with T-scores either at spine or hip. Kamalanathan et al.[15] also reported no association of testosterone with BMD in a multivariate analysis. Vitamin D deficiency was present in 45.5% patients with no difference in proportion of males and females (44.7% vs. 46.4%, P = 0.806). In patients with or without vitamin deficiency, mean T-scores did not differ significantly at spine (P = 0.388) and hip (P = 0.431). Furthermore, proportion of patients with osteoporosis was similar in those with or without Vitamin D deficiency. This finding suggests that there is no association of Vitamin D with BMD in T2DM. Kamalanathan et al.[15] observed Vitamin D deficiency with osteoporosis in 13/21 males and 12/17 females but found no correlation of BMD with Vitamin D levels. In patients with T2DM having osteoporosis of hip and spine, Mathen et al.[9] reported mean Vitamin D level of 22.53 ± 11.4 ng/mL and 20.19 ± 12 ng/mL, respectively. Although the levels were insufficient and deficient category, they found no correlation of Vitamin D with BMD at hip (r = −0.01) and spine (r = −0.22). Perez-Diaz et al.[22] found no significant relation of Vitamin D with osteoporosis in women with T2DM. Another study from Rakic et al.[23] found no correlation of Vitamin D with BMD. These findings are similar to our observations and suggest that Vitamin D may not have a significant influence on BMD in T2DM demanding more insights into its molecular mechanisms in bone turnover.
Limitations
We did not assess the factors such as sunlight exposure, estradiol levels, and lipid levels in relation to BMD in T2DM. Comparison to control group would have provided differential effects of factors determining BMD in T2DM. We included patients above age 50, but inclusion of lower ages may provide more pathophysiological insights about the disease whether bone loss starts early in men and even in premenopausal state in women. Nutritional status and physical activity also need more detailed consideration, especially in the Indian context where both are lacking in general. Inclusion of Type 1 diabetes might have shown a complete picture of glycemic mechanics influencing the bone turnover as per different metabolic environments.
CONCLUSION
The prevalence of osteoporosis in otherwise apparently healthy T2DM adults above 50 years was 35.5% (22.3% in males and 49.5% females). BMD in spine and hip was significantly lower in females and males with T2DM. A significant positive correlation with BMI observed. Testosterone and Vitamin D did not correlate with BMD demanding further evaluation. Vitamin D deficiency was prevalent in 45.5% cases but was not associated with lower BMD. A greater prevalence of osteoporosis at define by T-score − 2.5 or lower at spine (33.5%) than hip (13.5%) demands further evaluation as to determine factors that may play a role in differential rate of bone loss from two sites.
Financial support and sponsorship
Nil.
Conflicts of interest
There are no conflicts of interest.
REFERENCES
- 1.Schwartz AV, Vittinghoff E, Bauer DC, Hillier TA, Strotmeyer ES, Ensrud KE, et al. Association of BMD and FRAX score with risk of fracture in older adults with type 2 diabetes. JAMA. 2011;305:2184–92. doi: 10.1001/jama.2011.715. [DOI] [PMC free article] [PubMed] [Google Scholar]
- 2.Räkel A, Sheehy O, Rahme E, LeLorier J. Osteoporosis among patients with type 1 and type 2 diabetes. Diabetes Metab. 2008;34:193–205. doi: 10.1016/j.diabet.2007.10.008. [DOI] [PubMed] [Google Scholar]
- 3.Janghorbani M, Van Dam RM, Willett WC, Hu FB. Systematic review of type 1 and type 2 diabetes mellitus and risk of fracture. Am J Epidemiol. 2007;166:495–505. doi: 10.1093/aje/kwm106. [DOI] [PubMed] [Google Scholar]
- 4.Ma L, Oei L, Jiang L, Estrada K, Chen H, Wang Z, et al. Association between bone mineral density and type 2 diabetes mellitus: A meta-analysis of observational studies. Eur J Epidemiol. 2012;27:319–32. doi: 10.1007/s10654-012-9674-x. [DOI] [PMC free article] [PubMed] [Google Scholar]
- 5.Rubin MR, Patsch JM. Assessment of bone turnover and bone quality in type 2 diabetic bone disease: Current concepts and future directions. Bone Res. 2016;4:16001. doi: 10.1038/boneres.2016.1. [DOI] [PMC free article] [PubMed] [Google Scholar]
- 6.Oei L, Zillikens MC, Dehghan A, Buitendijk GH, Castaño-Betancourt MC, Estrada K, et al. High bone mineral density and fracture risk in type 2 diabetes as skeletal complications of inadequate glucose control: The Rotterdam Study. Diabetes Care. 2013;36:1619–28. doi: 10.2337/dc12-1188. [DOI] [PMC free article] [PubMed] [Google Scholar]
- 7.Nicodemus KK, Folsom AR. Iowa Women's Health Study. Type 1 and type 2 diabetes and incident hip fractures in postmenopausal women. Diabetes Care. 2001;24:1192–7. doi: 10.2337/diacare.24.7.1192. [DOI] [PubMed] [Google Scholar]
- 8.Karimifar M, Pasha MA, Salari A, Zamani A, Salesi M, Motaghi P. Evaluation of bone loss in diabetic postmenopausal women. J Res Med Sci. 2012;17:1033–8. [PMC free article] [PubMed] [Google Scholar]
- 9.Mathen PG, Thabah MM, Zachariah B, Das AK. Decreased bone mineral density at the femoral neck and lumbar spine in South Indian patients with type 2 diabetes. J Clin Diagn Res. 2015;9:OC08–12. doi: 10.7860/JCDR/2015/14390.6450. [DOI] [PMC free article] [PubMed] [Google Scholar]
- 10.Asokan AG, Jaganathan J, Philip R, Soman RR, Sebastian ST, Pullishery F. Evaluation of bone mineral density among type 2 diabetes mellitus patients in South Karnataka. J Nat Sci Biol Med. 2017;8:94–8. doi: 10.4103/0976-9668.198363. [DOI] [PMC free article] [PubMed] [Google Scholar]
- 11.Dutta M, Pakhetra R, Garg M. Evaluation of bone mineral density in type 2 diabetes mellitus patients before and after treatment. Med J Armed Forces India. 2012;68:48–52. doi: 10.1016/S0377-1237(11)60120-2. [DOI] [PMC free article] [PubMed] [Google Scholar]
- 12.Agarwal RP, Hindoria M, Kochar A, Kochar D. Evaluation of bone mineral density by osteosonography in patients with type 2 diabetes mellitus. J Indian Acad Clin Med. 2005;6:129–35. [Google Scholar]
- 13.Kumar BS, Ravisankar A, Mohan A, Kumar DP, Katyarmal DT, Sachan A, et al. Effect of oral hypoglycaemic agents on bone metabolism in patients with type 2 diabetes mellitus and occurrence of osteoporosis. Indian J Med Res. 2015;141:431–7. doi: 10.4103/0971-5916.159287. [DOI] [PMC free article] [PubMed] [Google Scholar]
- 14.Summary Meeting Report. Geneva: World Health Organization; 2007. [Last accessed on 2017 Jan 21]. WHO Scientific Group on the Assessment of Osteoporosis at Primary Health Care Level. Available from: http://www.who.int/chp/topics/Osteoporosis.pdf . [Google Scholar]
- 15.Kamalanathan S, Nambiar V, Shivane V, Bandgar T, Menon P, Shah N. Bone mineral density and factors influencing it in Asian Indian population with type 2 diabetes mellitus. Indian J Endocrinol Metab. 2014;18:831–7. doi: 10.4103/2230-8210.140268. [DOI] [PMC free article] [PubMed] [Google Scholar]
- 16.Agrawal NK, Sharma B. Prevalence of osteoporosis in otherwise healthy Indian males aged 50 years and above. Arch Osteoporos. 2013;8:116. doi: 10.1007/s11657-012-0116-x. [DOI] [PubMed] [Google Scholar]
- 17.Leidig-Bruckner G, Grobholz S, Bruckner T, Scheidt-Nave C, Nawroth P, Schneider JG. Prevalence and determinants of osteoporosis in patients with type 1 and type 2 diabetes mellitus. BMC Endocr Disord. 2014;14:33. doi: 10.1186/1472-6823-14-33. [DOI] [PMC free article] [PubMed] [Google Scholar]
- 18.Ahuja M. Age of menopause and determinants of menopause age: A PAN India survey by IMS. J Midlife Health. 2016;7:126–31. doi: 10.4103/0976-7800.191012. [DOI] [PMC free article] [PubMed] [Google Scholar]
- 19.Finkelstein JS, Brockwell SE, Mehta V, Greendale GA, Sowers MR, Ettinger B, et al. Bone mineral density changes during the menopause transition in a multiethnic cohort of women. J Clin Endocrinol Metab. 2008;93:861–8. doi: 10.1210/jc.2007-1876. [DOI] [PMC free article] [PubMed] [Google Scholar]
- 20.Choi YJ, Chung YS. Type 2 diabetes mellitus and bone fragility: Special focus on bone imaging. Osteoporos Sarcopenia. 2016;2:20–4. doi: 10.1016/j.afos.2016.02.001. [DOI] [PMC free article] [PubMed] [Google Scholar]
- 21.Søgaard AJ, Holvik K, Omsland TK, Tell GS, Dahl C, Schei B, et al. Age and sex differences in body mass index as a predictor of hip fracture: A NOREPOS study. Am J Epidemiol. 2016;184:510–9. doi: 10.1093/aje/kww011. [DOI] [PubMed] [Google Scholar]
- 22.Perez-Diaz I, Sebastian-Barajas G, Hernandez-Flores ZG, Rivera-Moscoso R, Osorio-Landa HK, Flores-Rebollar A. The impact of Vitamin D levels on glycemic control and bone mineral density in postmenopausal women with type 2 diabetes. J Endocrinol Invest. 2015;38:1365–72. doi: 10.1007/s40618-015-0394-4. [DOI] [PubMed] [Google Scholar]
- 23.Rakic V, Davis WA, Chubb SA, Islam FM, Prince RL, Davis TM. Bone mineral density and its determinants in diabetes: The Fremantle Diabetes Study. Diabetologia. 2006;49:863–71. doi: 10.1007/s00125-006-0154-2. [DOI] [PubMed] [Google Scholar]


