ABSTRACT
Sarcopenia, the loss of muscle mass and strength during normal aging, involves coordinate changes in skeletal myofibers and the cells that contact them, including satellite cells and motor neurons. Here we show that the protein O-fucosyltransferase 1 gene (Pofut1), which encodes a glycosyltransferase required for NotchR-mediated cell-cell signaling, has reduced expression in aging skeletal muscle. Moreover, premature postnatal deletion of Pofut1 in skeletal myofibers can induce aging-related phenotypes in cis within skeletal myofibers and in trans within satellite cells and within motor neurons via the neuromuscular junction. Changed phenotypes include reduced skeletal muscle size and strength, decreased myofiber size, increased slow fiber (type 1) density, increased muscle degeneration and regeneration in aged muscles, decreased satellite cell self-renewal and regenerative potential, and increased neuromuscular fragmentation and occasional denervation. Pofut1 deletion in skeletal myofibers reduced NotchR signaling in young adult muscles, but this effect was lost with age. Increasing muscle NotchR signaling also reduced muscle size. Gene expression studies point to regulation of cell cycle genes, muscle myosins, NotchR and Wnt pathway genes, and connective tissue growth factor by Pofut1 in skeletal muscle, with additional effects on α dystroglycan glycosylation.
KEYWORDS: Notch signaling, glycobiology, muscle aging, sarcopenia
INTRODUCTION
Sarcopenia, the loss of muscle mass and strength during the course of normal aging, has a profound impact on quality of life for the elderly (1–4). About one third of the muscle mass present in young individuals is lost during the aging process. Increased muscle weakness with age can result in decreased ambulation and in more frequent falls and bone fractures. Sarcopenia encompasses a number of phenotypic changes in skeletal muscle, including muscle atrophy, functional reductions in overall muscle strength, muscle wasting, neuromuscular decay and denervation, alterations in muscle fiber populations and patterning, reduced mitochondrial capacity, and the decreased regenerative capacity of satellite cells. Myriad changes in signaling cascades, endocrine hormones, inflammatory factors, β agonists, muscle factors, antioxidants, and energy metabolites have been suggested as contributing factors to sarcopenia, many of them by altering downstream myogenic regulatory factors (1, 2, 4). Similarly, there are a number of factors that control aging in a more global manner (IgfRs, Klotho, p53, Ku-80, XPD, and lamin A), by affecting DNA or protein integrity or altering cell death pathways that also affect skeletal muscle (5).
Notch receptor (NotchR) signaling has also been implicated in muscle aging, most particularly in the changed regenerative capacity of satellite cells in aged skeletal muscle (6–9). Mammals express four different Notch receptors (NotchR1 to -4) that are stimulated by two groups of NotchR ligands (Jagged-1 and -2 and Delta-like ligand-1, -3, and -4) (10). NotchRs contain large extracellular domains with many (between 29 and 36) epidermal growth factor (EGF)-type repeats (11). NotchR signaling is activated in trans via binding of a NotchR ligand on one cell membrane to a NotchR on an adjoining cell membrane (11). After activation, NotchRs are cleaved by ADAM proteases and by the presenilin-γ secretase complex to liberate the extracellular ligand-bound domain and the soluble cytoplasmic NotchR intracellular domain (NICD), respectively. The NICD contains a nuclear localization domain that allows it to enter the nucleus and activate transcription, including that of Hes and Hey genes, via binding and inactivating CSL corepressor complexes.
The Pofut1 (protein O-fucosyltransferase 1) gene encodes an essential O-fucosyltransferase that glycosylates serines or threonines within a specific glycosylation consensus sequence in EGF repeat-containing proteins, including NotchR1 to -4 (12, 13). Importantly, O-fucosylation of NotchR EGF domains by Pofut1 is required for NotchR ligand binding and NotchR activation (13, 14). The O-fucose synthesized by Pofut1 on NotchRs can be extended by the Fringe genes, of which there are three in mammals (15, 16). O-linked glucose and O-linked N-acetylglucosamine can also be present on the EGF repeats of NotchRs (11, 17). Pofut1 glycosylates a number of other EGF repeat-containing proteins, including agrin, blood clotting factors (factors VII, IX, and XII), NotchR ligands (e.g., Dll1, Dll3, and Jag1), and Cripto (18, 19). In some, but not all, instances, Pofut1 glycosylation can affect the function of NotchR ligands in addition to NotchRs. For example, Haltiwanger and colleagues showed that an absence of Pofut1 glycosylation does not affect Dll1 signaling via NotchRs (20) but that Pofut1 is required for Dll3-dependent signaling, which typically acts as a cis-dependent repressor, for example, during somitogenesis, in which the glycosyltransferase encoded by the Lunatic Fringe gene (Lfng) has also been implicated (21–24). Deletion of Pofut1 in mice results in embryonic lethality and provides a phenocopy of deletion of multiple NotchRs (25). Because there are four NotchRs in mammals, deletion of Pofut1 is a powerful means of inhibiting NotchR function without having to delete multiple NotchR genes.
Conboy et al. have clearly demonstrated a role for NotchR signaling in aged skeletal muscle (7, 26). Expression of Dll1 is essential for full activation of satellite cells after injury, and upregulation of Dll1 fails to occur in aged injured muscle, resulting in depleted NotchR signaling, a reduced proliferative capacity of satellite cells, and suboptimal tissue repair. This loss of regenerative capability in aged muscle can be recovered by stimulating NotchR signaling such that aged muscle now behaves as younger muscle normally would (7, 27, 28). Aging of stem cells also likely involves NotchR cross talk via Wnt and transforming growth factor beta (TGF-β)–Smad signaling (7, 8, 28–30). Rudnicki and colleagues have shown that Wnt7a is also implicated in the planar cell division of satellite cells, which in part controls self-renewal (31). Moreover, deletion of Dll1 in mice leads to the premature maturation of satellite cells and muscle hypotrophy (32), while activation of NotchRs in satellite cells inhibits their myogenic differentiation, maintaining them in a more proliferative state (26). Here we have explored the requirement of Pofut1 for NotchR signaling in skeletal muscle and for muscle aging.
RESULTS
Reduced Pofut1 expression in aging and HSACrePofut1FF skeletal muscles.
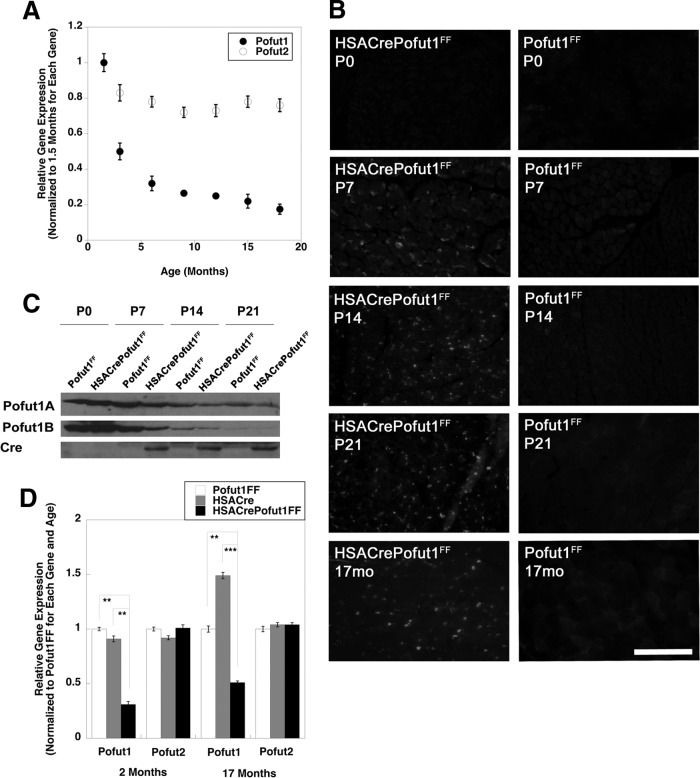
We first determined if Pofut1 gene expression was reduced as muscles aged. To do this, we compared Pofut1 expression levels in skeletal muscles of young adult mice at 6 weeks of age and those of mice at 3, 6, 9, 12, 15, and 18 months of age (Fig. 1A). Pofut1 gene expression was reduced by more than 60% at 6 months compared to 6 weeks of age and was reduced further, by more than 80%, at 18 months. Thus, while we had previously shown a dramatic downregulation of Pofut1 expression in skeletal muscle in the first month of life (18), expression continued to decline further even in adult animals. In contrast, skeletal muscle expression of Pofut2, a second member of the Pofut gene family whose product does not O-fucosylate NotchRs (33) but does O-fucosylate proteins containing thrombospondin repeats (33, 34), showed no more than a 25% decline at the same ages (Fig. 1A).
FIG 1.
Reduced expression of Pofut1 in aging and HSACrePofut1FF skeletal muscles. (A) Relative Pofut1 and Pofut2 gene expression in C57BL/6 mouse skeletal muscles at different ages relative to that in young adult (6 weeks old) muscles. (B) Cre immunostaining of HSACrePofut1FF and Pofut1FF muscles at 0, 7, 14, and 21 days and at 17 months. Bar, 200 μm. (C) Western blots of whole-muscle lysates of Gastroc muscle isolated at day 0, 7, 14, or 21, performed by use of two different antipeptide antibodies specific to Pofut1 or an antibody to Cre. (D) Relative Pofut1 and Pofut2 gene expression in HSACrePofut1FF muscles compared to that in HSACre and Pofut1FF muscles. Error bars in panels A and D show standard errors of the means (SEM) (n = 6 to 9 samples per condition). *, P < 0.05; **, P < 0.01; ***, P < 0.001.
To understand if this level of reduced gene expression would have functional consequences, we made skeletal myofiber-specific Pofut1-deleted mice. To do this, we created HSACrePofut1FF mice, which bear two floxed alleles of Pofut1 (Pofut1FF) and express Cre only in skeletal myofibers by virtue of the skeletal α actin promoter and intron (HSACre) (35). While skeletal α actin is normally expressed from a time shortly after myotubes have formed, about embryonic day 13 in the mouse (35, 36), we found that HSACrePofut1FF mice began to express Cre in skeletal muscles only at postnatal day 7 (P7), likely a consequence of this specific genetic cross (Fig. 1B). Immunoblots using either of two different affinity-purified Pofut1 antipeptide antibodies also showed reduced levels of expression only at P7 and beyond (Fig. 1C). Semiquantitative real-time PCR (qRT-PCR) measures of 2-month-old HSACrePofut1FF skeletal muscles showed a 70% decrease in Pofut1 gene expression relative to that in age-matched Pofut1FF and HSACre controls (Fig. 1D). In contrast, Pofut2 expression was not significantly decreased. Pofut1 expression was also decreased by at least 50% in 17-month-old HSACrePofut1FF muscles (Fig. 1D). Thus, by 2 months of age, Pofut1 gene expression in HSACrePofut1FF muscles was reduced by an amount equivalent to that normally found in 6- to 9-month-old wild-type mice.
Reduced NotchR signaling in HSACrePofut1FF muscles.
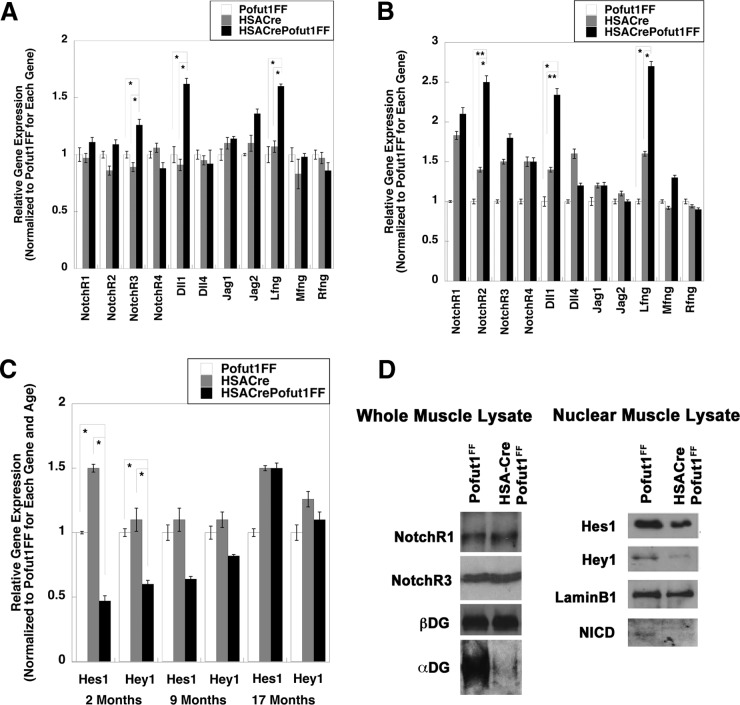
We next determined whether decreased Pofut1 expression in HSACrePofut1FF muscles altered the expression or signaling of NotchRs (Fig. 2). We compared the expression levels of the genes encoding Notch receptors (NotchR1 to NotchR4), NotchR ligands (Delta-like ligands 1, 3, and 4 [Dll1, Dll3, and Dll4] and Jagged-1 and -2 [Jag1 and Jag2]), and Fringe glycosyltransferases (Lunatic Fringe [Lfng], Radical Fringe [Rfng], and Maniac Fringe [Mfng]) (Fig. 2A and B). All genes but Dll3 showed measurable signals. At 2 months of age, HSACrePofut1FF muscles showed a modest increase in NotchR3, Dll1, and Lfng gene expression compared to that of Pofut1FF and HSACre, but expression of all other NotchRs, ligands, and modifiers was not significantly changed (Fig. 2A). By 17 months, HSACrePofut1FF muscles showed even greater increases in Dll1 and Lfng expression and an increase in NotchR2 expression (Fig. 2B). We next compared the expression levels of NotchR-activated genes (Hes1, Hey1, and Hey5) (Fig. 2C). We were unable to measure a detectable signal at 40 cycles for Hey5 in skeletal muscle. Hes1 and Hey1 gene expression levels were reduced by significant amounts in 2-month-old HSACrePofut1FF muscles compared to those in controls (Fig. 2C). This reduction was still evident at 9 months of age but was no longer present at 17 months (Fig. 2C). Consistent with reduced NotchR signaling as evidenced by reductions in Hes1 and Hey1 gene expression, nuclear expression of NotchR intracellular domain (NICD) protein was also reduced in young (3 months old) muscles, as was nuclear expression of Hes1 and Hey1 proteins (normalized to nuclear lamin B1) (Fig. 2D). Such reductions occurred despite unchanged levels of NotchR1 and NotchR3 proteins (normalized to β dystroglycan) in whole-muscle lysates (Fig. 2D). We did identify, however, reduced expression of α dystroglycan with the glycosylation-specific antibody IIH6, suggesting reduced α dystroglycan glycosylation (Fig. 2D). Thus, reduced Pofut1 expression in HSACrePofut1FF muscles coincided with decreased NotchR signaling in young muscles, but this reduction was lost as muscles aged beyond 1 year.
FIG 2.
Changed NotchR and NotchR ligand expression and reduced NotchR signaling in HSACrePofut1FF muscles. (A and B) Relative expression of Notch receptor genes (NotchR1 to NotchR4), NotchR ligand genes (Dll1, Dll4, Jag1, and Jag2), and Fringe genes (Lfng, Mfng, and Rfng) in 2-month-old (A) and 17-month-old (B) HSACrePofut1FF, HSACre, and Pofut1FF skeletal muscles. (C) Relative gene expression of Hes1 and Hey1 at 2, 9, or 17 months of age. (D) Western blots of Gastroc whole-muscle lysate (left) and nuclear lysate (right) were probed with antibodies to NotchR1, NotchR3, β dystroglycan (βDG), α dystroglycan (αDG; probed using IIH6, specific for a glycosylation-specific epitope), Hes1, Hey1, lamin B1, or Notch R1 intracellular domain (NICD). Error bars in panels A to C show SEM (n = 6 to 9 samples per condition). *, P < 0.05; **, P < 0.01; ***, P < 0.001.
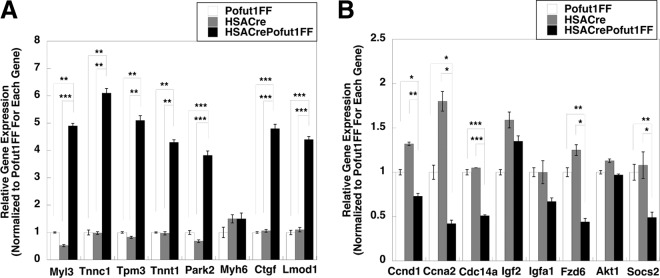
To further understand the gene expression changes, we performed a 3X3 Affymetrix microarray assay to compare global changes in gene expression between 2-month-old HSACrePofut1FF and HSACre quadriceps muscles. We identified 19 genes with average increases of >2-fold and 16 genes with >2-fold decreases in gene expression. qRT-PCR was then used to validate changed gene expression for some of these genes (Fig. 3). Genes with the most increased expression included those encoding myosin light chain 3 (Myl3), troponins C1 and T1 (Tnnc1 and Tnnt1), tropomyosin 3 (Tpm3), and leiomodin D1 (Lmod1) (Fig. 3A). These genes all encode structural muscle proteins known to be expressed in heart and/or type 1 (slow) skeletal muscle fibers (37–40). We also identified increased expression of the connective tissue growth factor gene (Ctgf), which encodes a trophic factor known to stimulate NotchR and Wnt signaling (41), and the parkin2 gene (Park2), which is involved in mitophagy (42). The most downregulated genes included several cell cycle genes, encoding cyclin D1 (Ccnd1), cyclin A2 (Ccna2), and cyclin-dependent phosphatase (Cdc14a), all of which are known to be regulated by NotchRs or NotchR signals (43–45); a gene encoding a suppressor of cytokine signaling 2, a regulator of Jak-Stat signaling (46); one Wnt receptor gene (Fzd6) (47); and an insulin-like growth factor binding protein gene (Igfa1) (48). Several other genes tested were not significantly changed.
FIG 3.
Gene expression levels in HSACrePofut1FF muscles relative to those in Pofut1FF and HSACre muscles. (A) Relative gene expression of targets identified as being increased in microarray studies of HSACrePofut1FF skeletal muscle were validated by qRT-PCR. (B) qRT-PCR measures of relative gene expression for targets identified as being decreased in gene microarray studies of HSACrePofut1FF skeletal muscle. Quadriceps muscles from 2-month-old mice were used in all instances. Error bars show SEM (n = 9 samples per condition). *, P < 0.05; **, P < 0.01; ***, P < 0.001.
We next performed a 3X3X3 transcriptome sequencing (RNA-seq) analysis of 17-month-old HSACrePofut1FF, Pofut1FF, and HSACre muscles to identify gene expression changes resulting from Pofut1 deletion in aged muscles (Table 1). Increased expression of Myh6 and Tnnt2 (at high levels; >6-fold) and of Myh7a (at lower levels; <2-fold) suggested an increased incidence of slow (type 1) myofibers in 17-month-old HSACrePofut1FF muscle (49). Increased expression of developmental myosin genes, including Myh3, Myh8, and Myl4, as well as Igf2, Myog, B4Galnt1, Cdk6, and a variety of extracellular matrix (ECM) genes, including genes encoding laminins, collagen IVs, and biglycan, suggested the presence of ongoing muscle regeneration (50–52), while increased expression of NCAM, nicotinic acetylcholine receptor (Chrna1, Chrnb1, and Chrnd), syntrophin B1, and acetylcholinesterase genes suggested ongoing muscle denervation (53–55) (Table 1). Increased expression of genes involved in NotchR signaling (NotchR2 and Dll1; also confirmed by qRT-PCR) (Fig. 2B) and Wnt signaling (Fzd1, -4, and -5 and Wnt11) (not shown) was also present. An assessment of other genes known to affect muscle fiber type, fatty acid metabolism, and oxidative metabolism, including genes encoding histone deacetylases (HDACs), MEFs, calcineurin, CaM kinase IV, Foxo1, AMPK, peroxisome proliferator-activated receptors (PPARs), Sox6, glycogen synthase kinase beta (GSKβ), casein kinase, RCAN1, calsarcins, PGC-1α, UCP3, CoxIV, and Cpt1, showed no significant changes in young or old HSACrePofut1FF muscles relative to both HSACre and Pofut1FF muscles. The one exception was the protein kinase D2 gene (Pkd2), whose family member Pkd1 is known to affect the muscle fiber type and to reduce muscle size when overexpressed (56). Pkd2 expression was increased 1.8-fold in comparisons of both 17-month-old HSACrePofut1FF versus HSACre and HSACrePofut1FF versus Pofut1FF muscles.
TABLE 1.
Gene expression changes in aged HSACrePofut1FF muscles suggest changed muscle fiber type composition, regeneration, and denervationa
| Gene category and name | Gene product | Fold change in expression |
|
|---|---|---|---|
| HSACrePofut1FF vs HSACre | HSACrePofut1FF vs Pofut1FF | ||
| Fiber type | |||
| Myh6 | Myosin heavy chain 6 | 9.3 | |
| Tnnt2 | Troponin T2 | 6.2 | |
| Myh7a | Myosin heavy chain 7A | 0.9 | |
| Muscle regeneration | |||
| Myh3 | Myosin heavy chain 3 | 5.1 | 12.8 |
| Myh8 | Myosin heavy chain 8 | 4.3 | 6.0 |
| Myl4 | Myosin light chain 4 | 5.3 | 7.6 |
| Igf2 | Insulin-like growth factor 2 | 4.6 | 6.5 |
| Myog | Myogenin | 2.7 | |
| B4Galnt1 | GM2/GD2 glycolipid synthase | 2.5 | |
| Cdk6 | Cyclin-dependent kinase 6 | 2.1 | 2.4 |
| Lama2 | Laminin α2 | 1.6 | 1.6 |
| Lamb1 | Laminin β1 | 2.1 | |
| Lamc1 | Laminin γ1 | 1.7 | |
| Col4a1 | Collagen IV (α1) | 1.8 | |
| Col4a2 | Collagen IV (α2) | 1.7 | |
| Bgn | Biglycan | 2.2 | 2.0 |
| Muscle denervation | |||
| Ncam1 | Neural cell adhesion molecule | 2.9 | 2.7 |
| Chrnd | Cholinergic receptor δ | 2.2 | 2.6 |
| Chrna1 | Cholinergic receptor α1 | 2.7 | |
| Chrnb1 | Cholinergic receptor β1 | 1.7 | |
| Sntb1 | Syntrophin β1 | 2.5 | 2.0 |
| Ache | Acetylcholinesterase | 1.8 | |
Quadriceps muscles from 17-month-old HSACrePofut1FF, HSACre, and Pofut1FF mice were compared by RNA-seq. Three samples per group were used, and average fold changes are reported.
Reduced size and increased slow fiber composition of HSACrePofut1FF muscles.
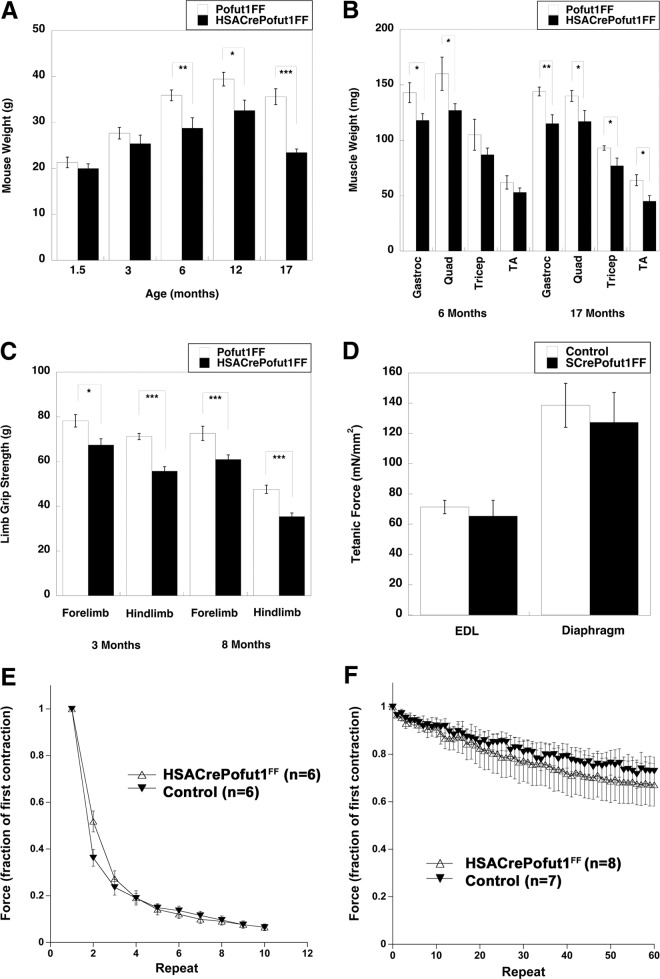
The most striking finding for HSACrePofut1FF mice was their reduced skeletal muscle weight and size at 6 months of age and beyond. Overall HSACrePofut1FF mouse weights were not significantly reduced compared to those of Pofut1FF mice at 1.5 or 3 months of age (though they trended lower), but they were significantly reduced, by 20 to 30%, at 6, 12, and 17 months (Fig. 4A). This reduced mouse weight at 6 months and beyond correlated with roughly equivalent degrees of loss of muscle mass for the gastrocnemius (Gastroc), quadriceps (Quad), tibialis anterior (TA), and triceps muscles (Fig. 4B). Reduced muscle size did not significantly correlate with reduced weights of other organs, including the kidneys, heart, lungs, and liver (not shown). The reduced size of skeletal muscles in HSACrePofut1FF mice also correlated with reduced strength in limb muscles: absolute forelimb and hind-limb grip strengths were reduced at both 3 and 8 months of age, with a 20% overall decrease that matched the reduced muscle weight (Fig. 4C). When they were normalized to weight, however, such grip strength measures were not significantly changed. Ex vivo physiological measures of individual muscles of young HSACrePofut1FF mice (aged 2 to 3 months), including tetanic force in the extensor digitorum longus (EDL) and diaphragm muscles (Fig. 4D), normalized to muscle cross-sectional area (of which weight is a component), similarly showed no decrease relative to those of controls. In addition, there was no significant change in force drop during eccentric contraction-induced injury in the EDL (Fig. 4E) or in fatigue during 60 repetitive stimulations of diaphragm muscles in 2-month-old HSACrePofut1FF mice (Fig. 4F). Thus, we identified no inherent functional deficit in young Pofut1-myofiber-deleted muscles other than a reduced muscle mass that led to reduced muscle strength.
FIG 4.
Reduced muscle size and strength but maintenance of normalized force in HSACrePofut1FF muscles. (A and B) Mouse (A) and individual skeletal muscle (B) weights of HSACrePofut1FF mice and age- and gender-matched Pofut1FF mice. Muscles in panel B were weighed at 6 months of age. (C) Absolute grip strengths for forelimbs and hind limbs at different ages. (D) Extensor digitorum longus (EDL) muscles or strips of diaphragm muscle were excised and analyzed ex vivo for tetanic force normalized to muscle cross-sectional area. (E) Force drop during repeated eccentric contractions of EDL muscles. (F) Fatigue measures of diaphragm strips in response to repeated contractions. Error bars show SEM (n = 6 [A], 5 or 6 [B and C], 6 [D], or 7 or 8 [F] samples per condition). *, P < 0.05; **, P < 0.01, ***, P < 0.001.
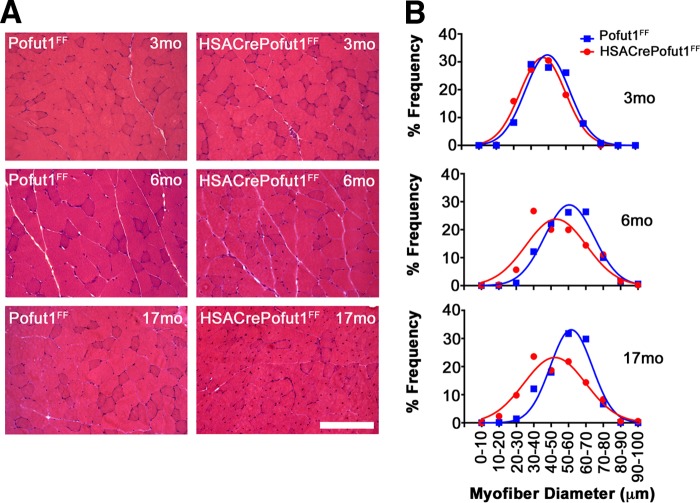
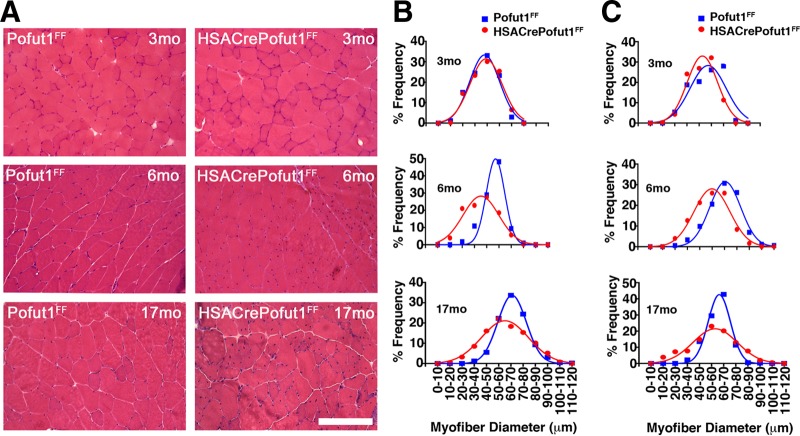
We next analyzed the changes in skeletal myofiber size by using hematoxylin and eosin (H&E) staining of quadriceps, gastrocnemius, and triceps muscles at 3, 6, and 17 months of age (Fig. 5 and 6). For all three muscles, we observed only a very slight shift toward smaller myofibers at 3 months of age in HSACrePofut1FF mice than those in Pofut1FF mice, but by 6 months of age this shift had become more pronounced. At 17 months, both HSACrePofut1FF and Pofut1FF mice showed a shift toward myofibers with larger diameters than those at 3 or 6 months, but HSACrePofut1FF muscles still possessed a larger number of small-diameter myofibers than that in Pofut1FF muscles.
FIG 5.
Changed myofiber size in HSACrePofut1FF quadriceps muscle. (A) Examples of H&E staining of cross sections of quadriceps muscles at different ages. Bar, 400 μm. (B) Distribution of mini-Feret myofiber diameters in HSACrePofut1FF (red) and Pofut1FF (blue) quadriceps muscles.
FIG 6.
Changed myofiber size in HSACrePofut1FF gastrocnemius and triceps muscles. (A) Examples of H&E staining of cross sections of gastrocnemius muscles at different ages. Bar, 400 μm. (B and C) Distribution of mini-Feret myofiber diameters in HSACrePofut1FF (red) and Pofut1FF (blue) muscles for the gastrocnemius (B) and triceps (C) muscles.
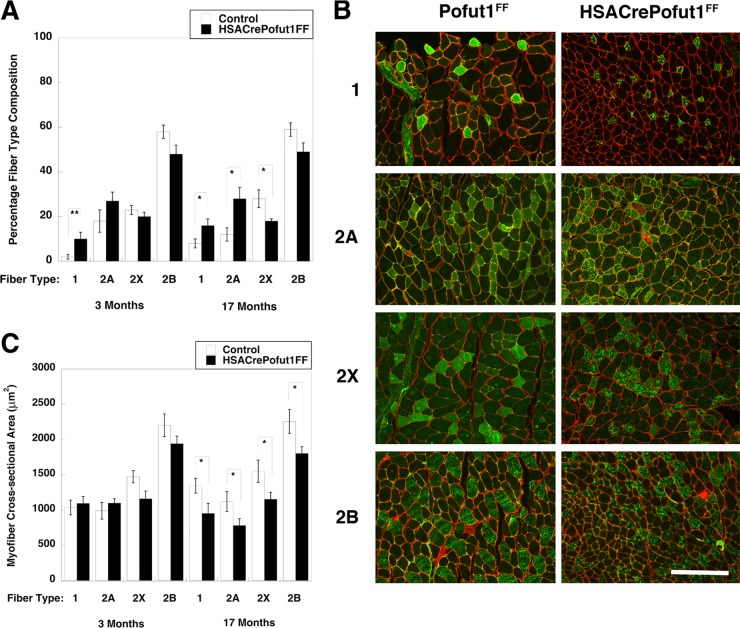
We next quantified fiber type composition by using histochemical and immunostaining techniques. Using myosin ATPase staining at pH 4.3, by which slow (type 1) myofibers are stained black and fast (type 2) myofibers remain white (57), we observed an increase in type 1 myofibers in 3-month-old HSACrePofut1FF Gastroc (from 1% ± 1% to 11% ± 3%; P < 0.05), Quad (from 1% ± 1% to 11% ± 4%; P < 0.05), and soleus (from 38% ± 2% to 47% ± 2%; P < 0.05) muscles relative to those of controls (not shown). We next immunostained cross sections of muscles with antibodies specific to type 1, 2A, 2X, and 2B myosins and quantified the fiber type (percent) composition and size (Fig. 7). Again, we observed significant increases in type 1 fibers in HSACrePofut1FF Gastroc muscles at 3 and 17 months (Fig. 7A). We also observed a trend toward increased type 2A fibers and a decrease in type 2X and 2B fibers at both ages (Fig. 7A). We observed no significant change in the cross-sectional area of type 1, 2A, 2X, or 2B myofibers in 3-month-old HSACrePofut1FF muscles relative to those of controls, although type 2X and 2B fibers trended toward being smaller (Fig. 7C). For 17-month-old HSACrePofut1FF muscles, however, the myofiber cross-sectional area in HSACrePofut1FF Gastroc muscles was reduced for type 1, 2A, 2B, and 2X fibers (Fig. 7B and C). Thus, all muscle fiber types showed reductions in size in HSACrePofut1FF mice as they aged, while a reduced size in young adult HSACrePofut1FF muscle may have resulted from a shift toward fiber types with a smaller cross-sectional area (types 1 and 2A) at the expense of those with larger areas (types 2X and 2B).
FIG 7.
Fiber type changes in HSACrePofut1FF muscles. (A) Quantification of positive staining with antibodies specific for slow fiber (type 1) and fast fiber (types 2A, 2X, and 2B) myosins in HSACrePofut1FF versus control (Pofut1FF + HSACre) mice. (B) Immunostaining with myosins specific for slow fibers (type 1) and fast fibers (types 2A, 2X, and 2B) in Pofut1FF and HSACrePofut1FF Gastroc muscles at 17 months of age. Bar, 200 μm. (C) Quantification of myofiber areas by fiber type in HSACrePofut1FF versus control (Pofut1FF + HSACre) mice. Error bars show SEM (n = 6 to 12 [A] or 6 to 9 [C] samples per condition). *, P < 0.05; **, P < 0.01.
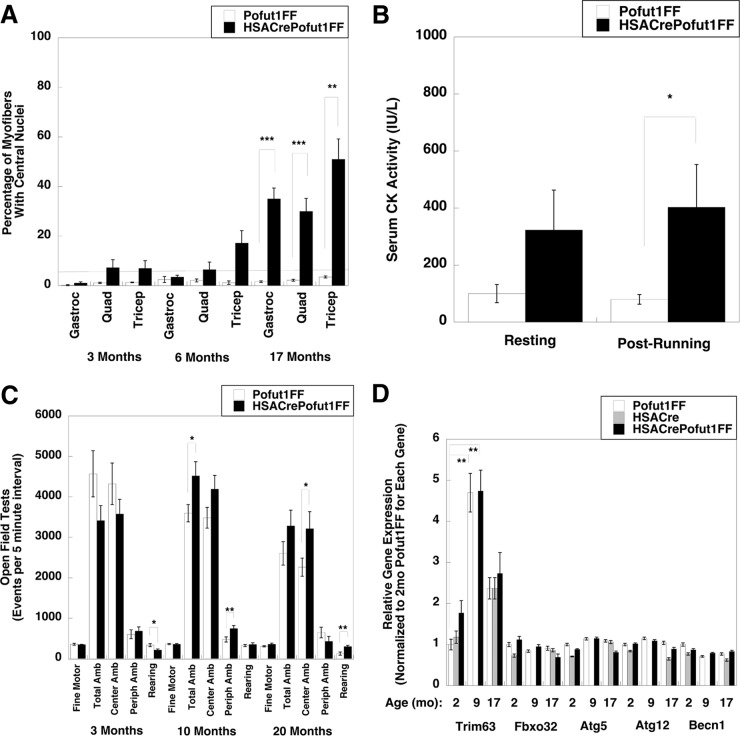
Muscle damage and regeneration could also be seen on H&E sections as HSACrePofut1FF mice aged. The percentage of myofibers with centrally localized nuclei, an indicator of a cycle of muscle degeneration and regeneration, was increased at 17 months (Fig. 8A). In addition, we observed a significant elevation in serum creatine kinase (CK) activity after exercise, another indicator of muscle damage (Fig. 8B). This elevation was quite modest compared to serum CK levels seen in dystrophic mdx mice (58), but it was nonetheless significant. There was no significant change, however, in mouse activity; open field tests of random activity showed no significant decrease for HSACrePofut1FF mice relative to Pofut1FF controls at 3, 10, or 20 months of age, with the exception of a slight decrease in rearing at 3 months that was lost at later ages (Fig. 8C).
FIG 8.
Muscle histopathology, mouse activity, and muscle atrophy gene expression of HSACrePofut1FF mice. (A) Quantification of myofibers with central nuclei at various ages. The line at 5% represents the normal range. (B) Assay of serum creatine kinase (CK) activity before and after 30 min of treadmill running at constant speed. (C) Open field measures of mouse activity and movement at various ages. Amb, ambulation; Periph, peripheral. (D) qRT-PCR measures of relative changes in muscle atrophy and autophagy gene markers, including the tripartite motif-containing 63 (Trim 63), F-box protein 32 (Fbxo32), autophagy-related 5 (Atg5) and 12 (Atg12), and beclin 1 (Becn1) genes, in the Gastroc muscles of 2-, 9-, and 17-month-old (mo) mice. Gene expression was not determined for 9-month-old HSACre muscles. Error bars show SEM (n = 4 or 5 [A], 7 to 11 [B], 4 [C], or 9 [D] samples per condition). *, P < 0.05; **, P < 0.01; ***, P < 0.001.
Another mechanism that could reduce muscle size would be increased muscle atrophy. We measured the relative expression levels of muscle atrophy and autophagy genes, including those encoding tripartite motif-containing 63 (Trim 63; also known as MuRF1), F-box protein 32 (Fbxo32; also known as MAFBx or Atrogin 1), autophagy-related 5 (Atg5), autophagy-related 12 (Atg12), and beclin 1 (Becn1), in the Gastroc muscles of 2-, 9-, and 17-month-old Pofut1FF, HSACre, and HSACrePofut1FF mice (Fig. 8D). Trim63 was significantly increased in both Pofut1FF and HSACrePofut1FF muscles with age; however, there was no significant increase between HSACrePofut1FF muscles and Pofut1FF or HSACre muscles for any of these genes, suggesting that changed muscle atrophy or autophagy did not contribute to reduced HSACrePofut1FF muscle size.
Reduced self-renewal and responsiveness to injury of satellite cells in HSACrePofut1FF mice.
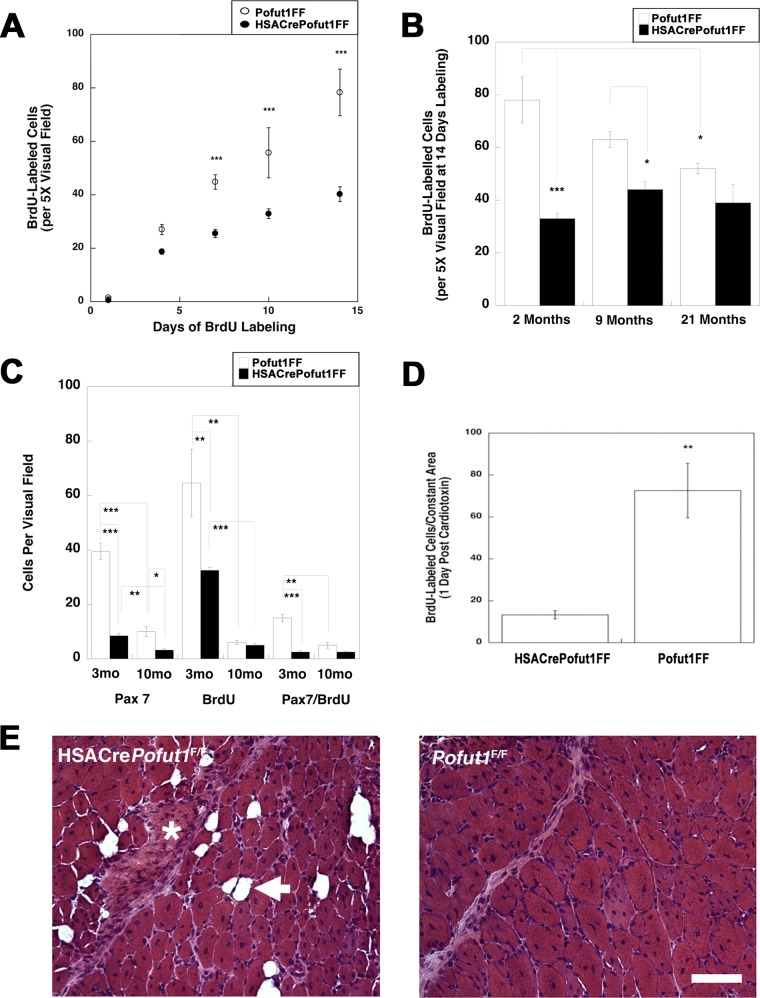
We next investigated whether deletion of Pofut1 in skeletal myofibers would affect satellite cell self-renewal or function. To assess self-renewal, we pulsed adult HSACrePofut1FF and Pofut1FF muscles with bromodeoxyuridine (BrdU) to identify replicating stem cells in young (3 months old) adult muscles (Fig. 9 and 10). With 7, 10, or 14 days of daily BrdU labeling, we observed a significant decrease in overall cell division within HSACrePofut1FF muscles, and the linear rate of cell division from 1 to 14 days was reduced by 49% (Fig. 10A). This level of reduction in BrdU labeling extended to older animals as well: HSACrePofut1FF mice showed reduced BrdU labeling over a 14-day period at 2, 9, and 21 months compared to that in Pofut1FF mice, though significance was lost for 21-month-old animals (Fig. 10B). In addition, we found a significant reduction in BrdU labeling in Pofut1FF animals from 2 to 21 months of age. We also costained BrdU-labeled muscles for Pax7, a marker of satellite cells (51), and found a significant reduction in Pax7-positive cells as well as Pax7/BrdU double-labeled cells in HSACrePofut1FF mice (Fig. 10C).
FIG 9.
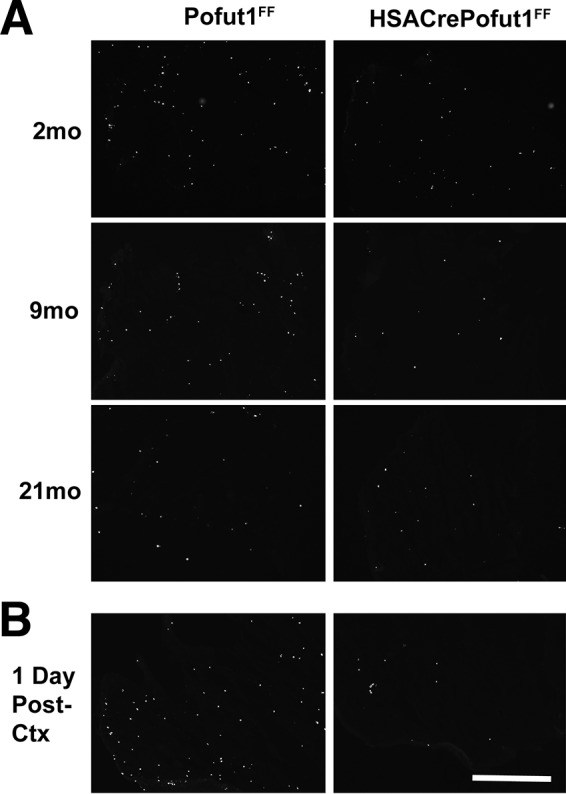
BrdU labeling of wild-type and Pofut1-deleted skeletal muscles. (A) HSACrePofut1FF mice were compared to control (Pofut1FF) mice for uptake of BrdU into dividing cells in skeletal muscle (TA) for 14 days at various ages. (B) Three-month-old mice were labeled with BrdU prior to cardiotoxin (Ctx) challenge to identify BrdU uptake 24 h after injury. Bar, 400 μm.
FIG 10.
Reduced satellite cell self-renewal in HSACrePofut1FF muscles. (A) BrdU labeling for 1, 4, 7, 10, or 14 days in HSACrePofut1FF mice and Pofut1FF controls was quantified per unit area of labeled TA muscle. (B) BrdU staining in BrdU-labeled (for 14 days) TA muscles was quantified for different ages. (C) Pax7 and BrdU staining and Pax7/BrdU double staining were quantified at different ages. (D) BrdU-labeled cells were quantified 1 day after muscle injury with cardiotoxin. (E) H&E staining of HSACrePofut1FF and Pofut1FF muscles 14 days after cardiotoxin injection. The arrow indicates a fat cell, and the asterisk indicates a region rich in extracellular matrix. Bar, 100 μm. Error bars in panels A to D show SEM (n = 6 samples per condition). *, P < 0.05; **, P < 0.01; ***, P < 0.001.
We next injected HSACrePofut1FF and Pofut1FF muscles with cardiotoxin to induce acute muscle injury (50). HSACrePofut1FF muscles had significantly reduced numbers of BrdU-positive cells 1 day after injury, suggesting reduced satellite cell division (Fig. 9 and 10D). At 14 days postinjury, HSACrePofut1FF muscles showed incomplete regeneration, with injured muscle regions showing increased expression of extracellular matrix and fat where skeletal myofibers would normally be expected (Fig. 10E).
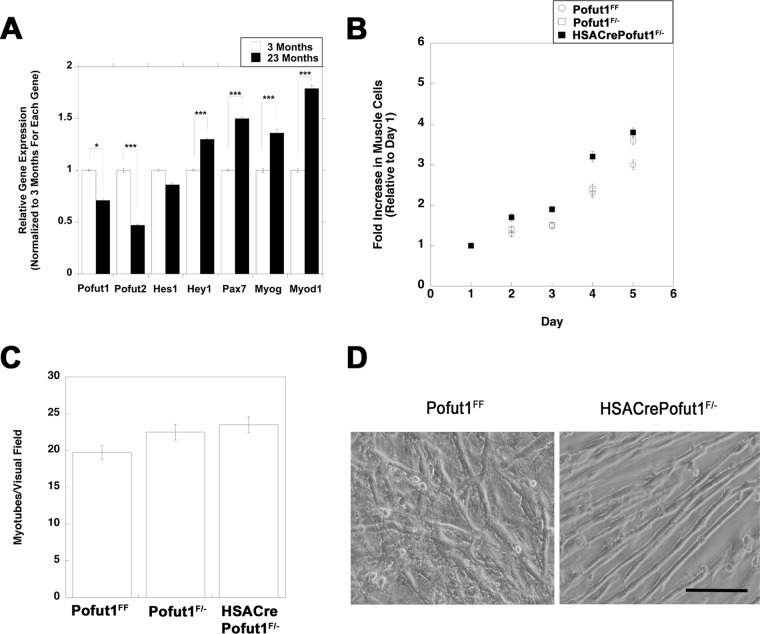
To determine whether a changed regenerative potential was cell autonomous, muscle cells from HSACrePofut1FF and control muscles were isolated and grown in culture. First, we compared Pofut1 expression levels in isolated muscle cells cultured from young (3 months) and old (23 months) wild-type mice (Fig. 11A). Pofut1 expression was significantly reduced, by 30%, in muscle cells cultured from 23-month-old mice relative to those from 3-month-old mice. Such aged muscle cells also showed a significant reduction in Pofut2 expression (below 50%), while the same cultures showed increased expression of Hey1, Pax7, MyoD, and Myog, suggesting an altered differentiation state. To account for the reduced Pofut1 activity in aged cultured muscle cells, we made HSACrePofut1F/− mice and isolated muscle cells from these mice. In these mice, one allele of Pofut1 was deleted in all tissues, including satellite cells, while the second allele was deleted only in skeletal myofibers. HSACrePofut1F/− muscle cultures had rates of cell division similar to those of Pofut1F/− and Pofut1FF muscle cells (Fig. 11B). When they were grown to confluence, cells of all three genotypes showed rates of fusion to skeletal myofibers that were not significantly different from one another (Fig. 11C and D). These data suggest that the reduction in Pofut1 expression in aged muscle cells did not alter their function in culture and that the local in vivo muscle microenvironment was necessary to alter satellite cell division and function in HSACrePofut1FF mice.
FIG 11.
Division and fusion of cultured HSACrePofut1F/− muscle cells are unchanged. (A) Relative Pofut1 expression in cultured muscle cells isolated from young (3-month-old) and old (23-month-old) C57BL/6 mice, along with markers of muscle differentiation and NotchR activation. Error bars show SEM (n = 9 samples per condition). (B and C) Primary muscle cultures isolated from young (3 months old) Pofut1F/+, Pofut1F/−, and HSACrePofut1F/− mice were compared for growth rate as myoblasts (B) and for myotube fusion after 6 days in fusion medium (C). (D) Images of 6-day fused myotube cultures of Pofut1FF and HSACrePofut1F/− muscles. Bar, 50 μm. *, P < 0.05; ***, P < 0.001.
Reduced NICD and β catenin expression at HSACrePofut1FF NMJs.
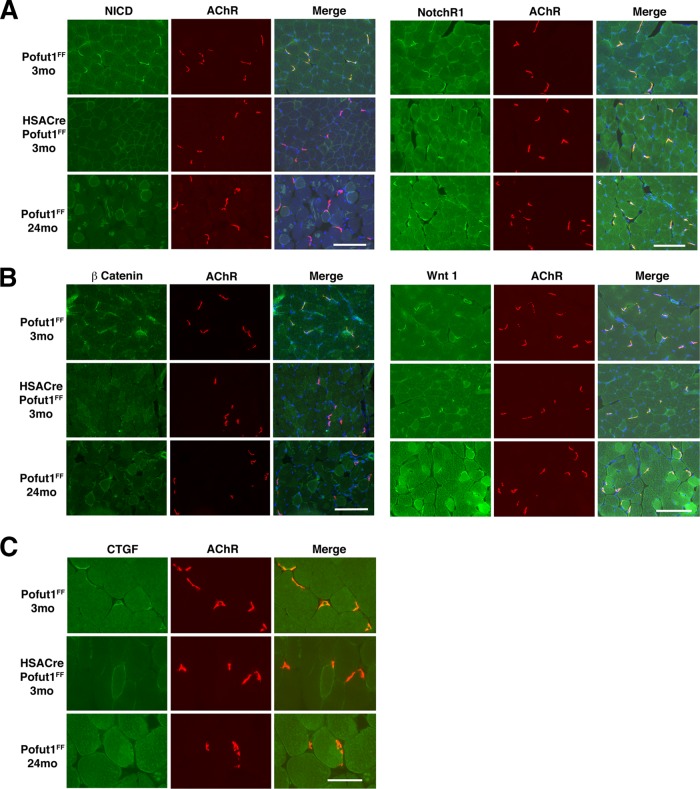
We next immunostained muscles with an antibody to the NotchR intracellular domain (NICD) to probe NotchR signaling and with an antibody to β catenin to probe Wnt signaling (Fig. 12A and B). NICD and β catenin immunostaining was highly concentrated at the neuromuscular junctions (NMJs) in 3-month-old Pofut1FF muscles. This was evidenced by costaining with rhodamine α bungarotoxin, which labels postsynaptic nicotinic acetylcholine receptors (AChRs) (59). NICD and β catenin staining was highly reduced at the NMJs in 3-month-old HSACrePofut1FF muscle and in aged (24 months) Pofut1FF muscle compared to that in 3-month-old Pofut1FF muscle. In contrast, Wnt1 and NotchR1 NMJ staining was not reduced. CTGF staining was also concentrated at the NMJs in 3-month-old Pofut1FF muscle, and expression was reduced or absent in 3-month-old HSACrePofut1FF muscle and 24-month-old Pofut1FF muscle (Fig. 12C). We also stained for additional NotchRs (NotchR2 to -4), NotchR ligands (Jag-1 and -2 and Dll-1, -3, and -4), Wnt receptors (Fzd 6, 7, and 9), and Wnt proteins (3a, 5a, 7a, 9b, 10b, 11, and 16) and found that almost all such proteins were present at the NMJs in 3-month-old Pofut1FF mice, 24-month-old Pofut1FF mice, and 3-month-old HSACrePofut1FF mice (not shown). Thus, NotchR and Wnt signaling appeared to be reduced in HSACrePofut1FF NMJs, despite the presence of NotchRs, NotchR ligands, Wnts, and Wnt receptors.
FIG 12.
Reduced NotchR and Wnt signaling at the neuromuscular junction in HSACrePofut1FF mice. Neuromuscular junctions were identified by α bungarotoxin staining of nicotinic acetylcholine receptors (AChRs) (red). The NotchR intracellular domain (NICD) (A), NotchR1 (A), β catenin (B), Wnt1 (B), and connective tissue growth factor (CTGF) (C) were costained in green. Images of Gastroc muscle are shown. Merged images show coincident staining in yellow, with DAPI stain added to show nuclei. Bars, 200 μm for panels A and B and 100 μm for panel C.
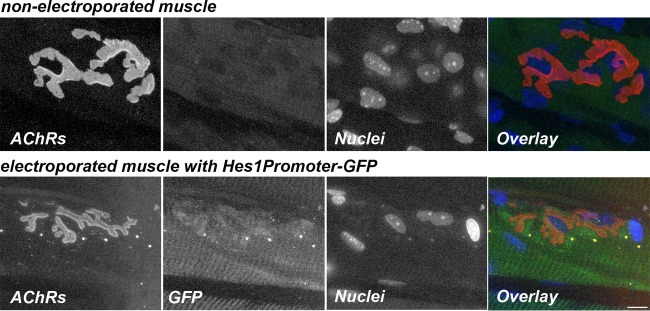
To test whether NICD expression at the NMJs would result in NotchR signaling, we also electroporated a Hes1 promoter-green fluorescent protein (GFP) reporter plasmid into the sternomastoid muscle of wild-type mice. Hes1 promoter-driven GFP expression was elevated in electroporated muscles in regions with NMJs, while nonelectroporated muscles showed no GFP expression (Fig. 13). This result supports the notion that increased NICD expression at mouse NMJs is translated into increased downstream NotchR signaling.
FIG 13.
Hes1 promoter-responsive NotchR signaling at the NMJ. The images are confocal images of a neuromuscular junction on a muscle fiber electroporated with the Hes1Promoter-GFP plasmid and of a nonelectroporated control muscle fiber. Six days after electroporation, sternomastoid muscles were labeled with a saturating dose of α bungarotoxin (to label AChRs) (red) and with DAPI (to label nuclei) (blue). Synapses on electroporated (GFP) (green) and nonelectroporated muscle fibers from the same sternomastoid muscle were imaged by confocal microscopy. Bar, 15 μm.
Altered neuromuscular structure in HSACrePofut1FF muscles.
We next analyzed NMJ structure by costaining whole-mount preparations of diaphragm muscle with neurofilament and synaptophysin, which label motor axons and nerve terminals, respectively, and α bungarotoxin, which labels postsynaptic AChRs. NMJ staining was then imaged using confocal microscopy (Fig. 14A). We quantified fragmentation of AChR postsynaptic domains by assessing the number of discontinuous AChR-rich elements at each NMJ (Fig. 14B), which increases with NMJ degeneration and NMJ aging (60, 61). We also quantified the extent of coincident presynaptic (nerve terminal) and postsynaptic (AChR) staining (Fig. 14C), which decreases during NMJ aging and NMJ degeneration (60, 61). NMJs imaged in this way showed a significant increase in the fragmentation of postsynaptic AChRs and a significant decrease in coincident staining of nerve terminals with the postsynaptic membrane in HSACrePofut1FF muscle. In a few instances, almost no nerve terminal occupied the postsynaptic AChR-rich membrane, suggesting denervation (Fig. 14A). Such findings were consistent with elevated expression of AChR genes (Table 1), which are normally suppressed by neural activity (54).
FIG 14.
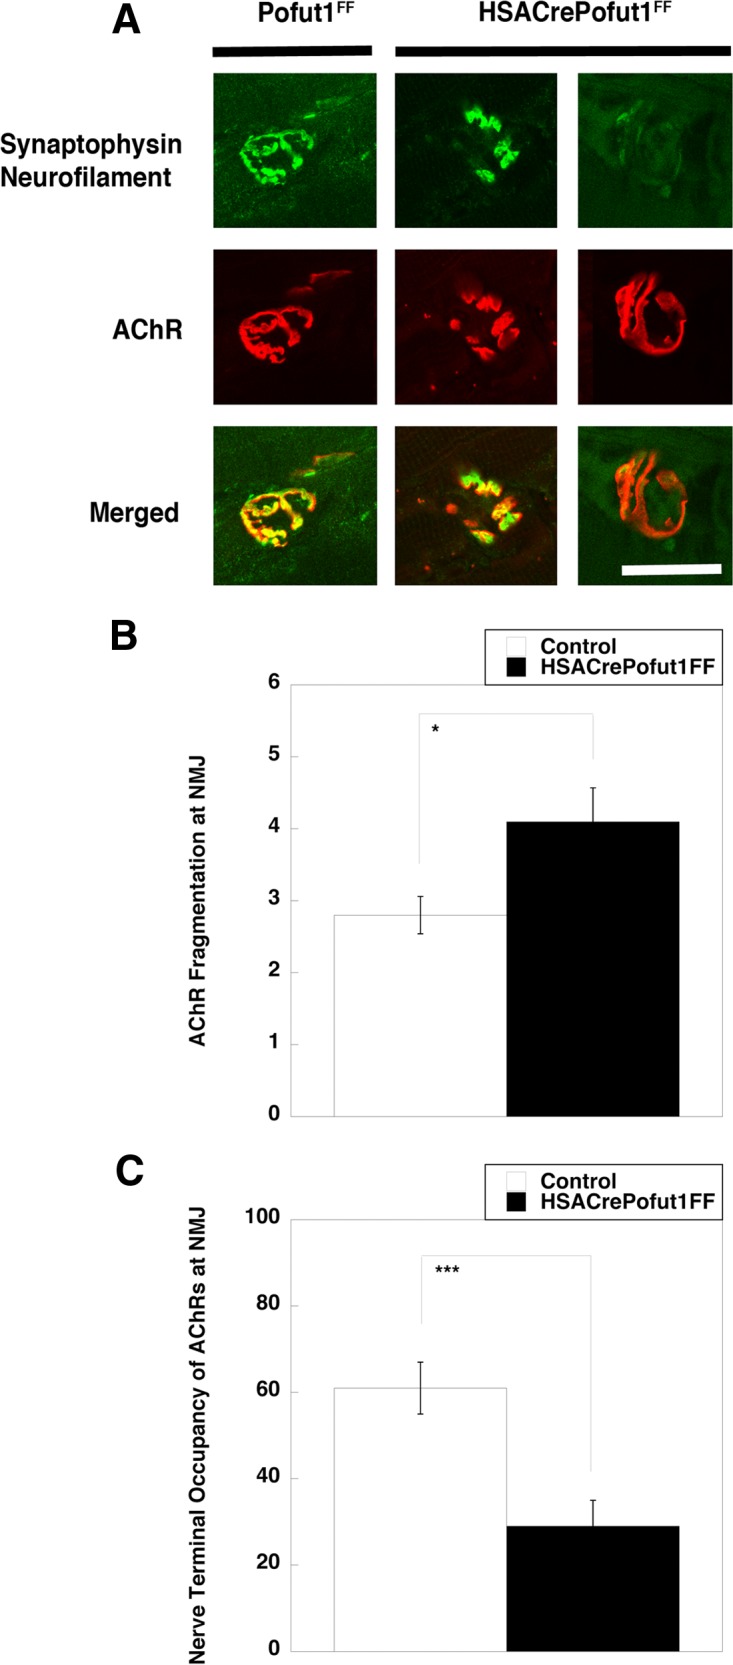
Perturbed neuromuscular structure in HSACrePofut1FF muscle. (A) Confocal image of NMJ staining. Presynaptic motor nerve terminals and axons were stained with synaptophysin and neurofilament (both in green), and postsynaptic membranes were stained with α bungarotoxin (to show AChRs) (red). Merged staining is shown in yellow. HSACrePofut1FF panels show examples of AChR fragmentation (middle panels) and denervation (right panels). The images show 3-month-old diaphragm muscle. Bar, 10 μm. (B and C) Quantification of NMJ ultrastructure changes in 5-month-old HSACrePofut1FF and Pofut1FF diaphragm muscles stained as described for panel A, including measures of the number of AChR-rich fragments per NMJ (B) and the nerve terminal occupancy of postsynaptic AChRs (C). Error bars in panels B and C show SEM (n = 21 to 25 samples per condition). *, P < 0.05; ***, P < 0.001.
NICD overexpression in HSACrePofut1FF muscles stimulates NotchR signaling but reduces muscle size.
Because Pofut1 glycosylates multiple protein substrates in addition to NotchRs, we wanted to see if it was possible to overcome the phenotypes of HSACrePofut1FF muscles by overexpressing NICD. To do this, we engineered an adeno-associated virus (AAV) vector by which NICD would be overexpressed in skeletal myofibers due to the presence of the MHCK7 promoter (62). We also used an AAV serotype, rhesus 74 (rh74), that is excellent at transducing skeletal muscles. To more easily see NICD protein made by the introduced transgene, we added a myc epitope tag at the N terminus of NICD.
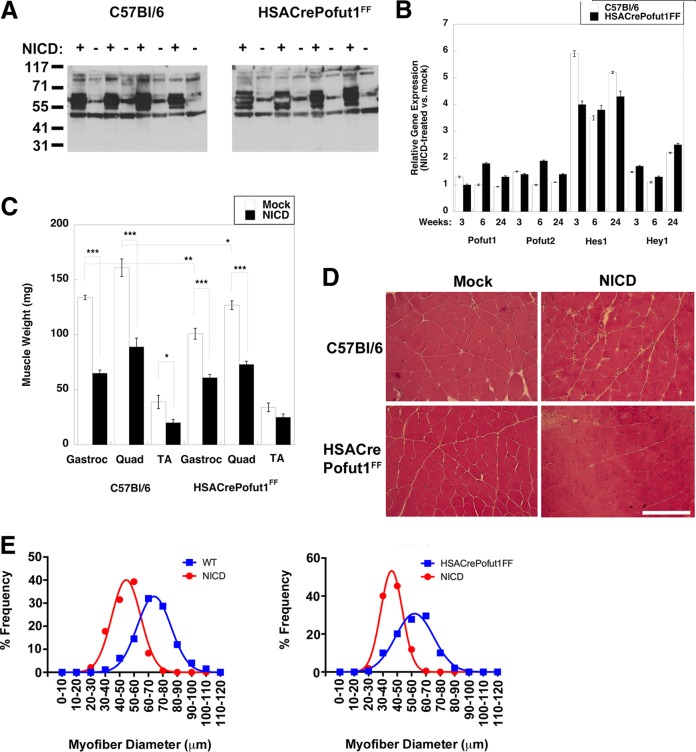
Wild-type (C57BL/6) and HSACrePofut1FF mice were injected with rAAVrh74.MHCK7.NICD in the TA, Gastroc, and Quad muscles of one leg at 6 to 7 weeks of age, and the same muscles in the contralateral limb were injected with an equivalent volume of phosphate-buffered saline (PBS). Muscles were analyzed at 3, 6, and 24 weeks postinjection. qRT-PCR measures of NICD expression showed that transgene expression was elevated approximately 10-fold by 6 weeks postinjection relative to endogenous NotchR1 expression, and this was increased to 70-fold overexpression at 24 weeks (not shown). The NICD protein was highly overexpressed at the expected molecular weight in rAAVrh74.MHCK7-NICD-injected muscles, with no expression in the contralateral limb (Fig. 15A). NICD overexpression led to 4- to 6-fold elevations in Hes1 gene expression in both C57BL/6 and HSACrePofut1FF muscles (Fig. 15B). Hey1 expression was also elevated >2-fold at 6 months, but it showed insignificant changes at 3 and 6 weeks. All changes in Pofut1 and Pofut2 expression were lower than 2-fold at all times. All NICD-overexpressing muscles showed a significant decrease in muscle weight by 3 months postinjection that was sustained at 6 months (Fig. 15C). Muscle weights of NICD-overexpressing muscles were reduced by one third to one half by 6 months compared to those of contralateral controls. H&E staining also showed reduced myofiber diameters, with little or no evidence of additional muscle histopathology (Fig. 15D and E). Thus, chronic overexpression of NotchR signaling in skeletal myofibers, much like chronic reduction of NotchR signaling resulting from Pofut1 deletion, reduced muscle size over time.
FIG 15.
NotchR intracellular domain (NICD) overexpression reduces muscle size. Muscles of 2-month-old Pofut1FF or HSACrePofut1FF mice were injected with AAV-MHCK7-NICD and analyzed at the indicated time points. (A) Western blots of myc-tagged NICD protein in AAV-MHCK7-NICD-injected and mock-injected muscle cell lysates (results at 24 weeks postinjection for Gastroc muscles from 4 different experiments are shown). (B) Relative Pofut1, Pofut2, Hes1, and Hey1 gene expression after NICD overexpression in skeletal muscles. (C) Comparison of muscle weights after NICD overexpression (24 weeks). (D) H&E staining of NICD-overexpressing wild-type (C57BL/6) and HSACrePofut1FF muscles. Images of Quad muscles are shown. Bar, 200 μm. (E) Quantification of distribution of mini-Feret myofiber diameters in NICD-overexpressing wild-type (WT) or HSACrePofut1FF muscles at 24 weeks postinjection. Data for Gastroc muscles are shown. Error bars in panels B and C show SEM (n = 4 samples per condition). *, P < 0.05; **, P < 0.01; ***, P < 0.001.
DISCUSSION
In this study, we have shown that skeletal muscles in the mouse have reduced Pofut1 expression as they age and that premature knockdown of Pofut1 specifically in skeletal myofibers causes aging-related phenotypes in cis, including reduced muscle size and strength and changed fiber type composition, and in trans, including reduced self-renewal and regenerative potential of satellite cells and increased degeneration of motor nerve innervation at the neuromuscular junction. Thus, premature knockdown of Pofut1 in skeletal myofibers not only causes premature loss of skeletal muscle mass and weakness but also causes premature aging-related phenotypes in the cells that contact the myofiber. As motor neurons, satellite cells, and skeletal myofibers all contribute to the loss of muscle function and strength during aging, these experiments highlight a role for the skeletal myofiber in coordinating aging-related phenotypes through mechanisms controlled by Pofut1. Reduced muscle mass in HSACrePofut1FF mice appears to result in part from a conversion of larger, fast-twitch, type 2 myofibers to smaller, slow-twitch, type 1 myofibers in young muscles, coupled with a reduction in size for myofibers of all types in aged muscles. Aged HSACrePofut1FF mice also show a muscle damage phenotype that leads to the presence of smaller regenerating myofibers that express developmental myosins. Kitamura and colleagues have shown that Foxo1 gene ablation increases NotchR signaling and fast muscle fiber formation (63), so there is at least one precedent for NotchR involvement in the regulation of fiber type composition. Since NotchR NICD overexpression also decreases muscle size despite increasing NotchR signaling, it may be that too much NotchR signaling and too little NotchR signaling both have negative impacts on muscle growth. Indeed, studies of somitogenesis show that NotchR signaling, along with Lfng expression, oscillates in a cyclical manner and, as such, may respond similarly, and negatively, to simple up-and-down expression experiments (21, 22, 24, 64).
Separate from the implications for aging, these experiments demonstrate that Pofut1 is a regulator of NotchR signaling in skeletal myofibers. While Pofut1 is well known to regulate the ability of NotchR ligands to bind to and activate NotchRs in mice (12) and Drosophila (14), this is the first demonstration of its specific role in skeletal myofibers by use of genetic approaches in mammals. Cleavage of NotchRs to generate NICD fragments was reduced in HSACrePofut1FF muscles, as was expression of downstream genes normally activated by NotchR ligand binding, including Hes1 and Hey1. Reduced Hes1 and Hey1 expression could be overcome by NICD overexpression, so Pofut1 deletion did not completely block NotchR signaling, likely only ligand-dependent NotchR activation, as previously described (11, 12, 18).
Microarray, qRT-PCR, and RNA-seq measures of gene expression changes further demonstrated the relationship between reduced Pofut1 expression in skeletal myofibers and the expression of genes normally controlled by or controlling NotchR signaling, including cell cycle genes, Wnt receptor genes, and the connective tissue growth factor gene (41). In addition, we observed increased expression of genes that encode structural muscle proteins (myosin light chain 3, troponins C1 and T1, and tropomyosin 3) that are usually found in slow (type 1) skeletal myofibers (39, 40), as well as the Parkin 2 gene, involved in mitophagy (42). Increased expression of slow fiber-specific genes correlated with an increase in the percentage of slow (type 1) myofibers in HSACrePofut1FF muscles. While there is some controversy as to whether fast-twitch muscles are replaced by slow-twitch fibers during human aging (65), this was one of the clearest phenotypes of HSACrePofut1FF mice, and this result is reminiscent of that for transgenic mice with forced overexpression of Pkd1, encoding protein kinase D1 (56). This is significant because the protein kinase D2 gene (Pkd2) was the only gene we identified as being increased in 17-month-old HSACrePofut1FF muscles where fiber type conversion changes had already been described for a gene family member.
The presence of muscle damage and mild dystrophic changes in aged HSACrePofut1FF muscles is indicative of changes recently described for patients with POGLUT1 mutations (66). Like Pofut1, Poglut1 glycosylates the EGF repeats of NotchRs, but it adds O-linked glucose instead of O-linked fucose (11). Patients with POGLUT1 mutations showed reduced glycosylation of α dystroglycan, suggestive of a dystroglycanopathy (67), coupled with reduced NotchR signaling and a reduced satellite cell number and function (66). This phenotype occurred despite the fact that α dystroglycan bears no EGF repeat motifs (68) and thus is likely not O-glucosylated by Poglut1. It may be that Pofut1 deletion in mouse muscle yields a phenotype similar to that for human POGLUT1 mutations, as α dystroglycan glycosylation was reduced in the present study as well. The hypothesis that reduced NotchR signaling would yield dystrophic muscle changes is also consistent with the recent finding by Kunkel and colleagues for dystrophin-deficient dogs, where genetic variant animals with increased Jag1 expression had much less severe disease (69).
One of the most profound changes in HSACrePofut1FF muscles was the aging-related phenotype of a reduction in the self-renewal of satellite cells, the predominant stem cell of skeletal muscle (51). Even in uninjured muscle, satellite cell self-renewal was reduced by almost half relative to that of age-matched Pofut1FF controls. This correlated with a profound reduction in the expression of several cyclin genes that can regulate satellite cell division. The in vivo microenvironment, where satellite cells normally are in direct contact with skeletal myofibers, was essential for this change, as muscle cells isolated from HSACrePofut1FF mice grown in culture showed normal growth and fusion rates. There was an even more profound loss of cell division in HSACrePofut1FF muscles immediately after acute muscle injury, with a 70% reduction at day 1. This led to incomplete regeneration, with increased expression of fat and extracellular matrix at 14 days postinjury in regions where muscle formation would normally be expected.
We also identified impacts of Pofut1 deletion on aging-related phenotypes at the NMJ. Aging of skeletal muscle involves not only muscle atrophy and reduced satellite cell function but also, and perhaps as a causative effect, the decay and eventual inactivation of NMJs with concomitant motor neuron cell death. Aged humans can lose up to 1% of motor neurons a year (70). While some motor neuron cell death may be cell autonomous, the skeletal myofiber, through reduced maintenance of NMJs formed between motor nerve terminals and postsynaptic muscle membranes, may also be involved. Here we have shown that β catenin, a Wnt receptor signal, and NICD, a NotchR signal, as well as CTGF, a potential Wnt and Notch receptor ligand, all had reduced NMJ expression in aged wild-type muscle, with even more reduced NMJ expression in young HSACrePofut1FF muscle. γ secretase is concentrated at the NMJ in mouse muscle and likely helps to increase synaptic NICD expression (71, 72). Mei and colleagues showed that muscle-specific deletion of β catenin (but not motor neuron-specific deletion) has clear impacts on NMJ development consistent with a role for Wnt signaling (73), and mice lacking CTGF, primarily described in the context of bone development phenotypes, die immediately after birth, which is a classic phenotype for failure of NMJ formation (74).
While their genotype does not lead to death, HSACrePofut1FF mice show hallmarks of neuromuscular aging in young muscles, including disjointed structural alignment of AChR-rich postsynaptic domains, which typically form a contiguous pretzel-like structure on the postsynaptic membrane, and misalignment or withdrawal of segments of the nerve terminal from the postsynaptic membrane, a classic symptom of NMJ aging (60). Sanes and colleagues showed that 75% of NMJs in the extensor digitorum longus (EDL) muscle have structural changes at 2 years, while fewer than 5% of EDL NMJs have these changes at 3 months (60). The reduction in end-plate currents in response to repeated stimulation of motor neurons also increases with age, consistent with reduced NMJ function (75, 76). Other factors also contribute to denervation in aging, for example, changes in synaptic extracellular matrix proteins, including agrin (77, 78), laminin α4 (77), and collagen XIII (79), as well as cell-autonomous changes in motor neuron health (60), but the data presented here are consistent with a contribution from the skeletal myofiber involving Pofut1.
MATERIALS AND METHODS
Mice.
Mice bearing two Pofut1 alleles with flanking loxP sites (Pofut1FF) or mice bearing one floxed Pofut1 allele and one deleted Pofut1 allele (Pofut1F/−) were a generous gift from Pamela Stanley (Albert Einstein College of Medicine) and have been described previously (25, 80, 81). Transgenic mice expressing Cre recombinase whose expression is driven only in skeletal muscles via the human skeletal actin promoter and intron (HSACre) (35, 36) were purchased from The Jackson Laboratory (Bar Harbor, ME). Interbred mouse strains were maintained on a similarly mixed background, and age-matched littermates were used as control strains in all experiments. The mice were maintained on a protocol approved by the Institutional Animal Care and Use Committee of the Research Institute at Nationwide Children's Hospital or the University of Michigan.
Histology.
Skeletal muscles were dissected from tendon to tendon, weighed, and then snap-frozen in liquid nitrogen-cooled isopentane. Frozen skeletal muscle blocks were cross-sectioned from the midsection of the muscle with a 10-μm thickness on a cryostat. For hematoxylin and eosin (H&E) staining, the sections were fixed in 10% neutral buffered formalin, washed in tap water, stained in Gill's 3 hematoxylin (Fisher Scientific, Pittsburgh, PA) for 2 min, and then washed in tap water, in bluing agent, and then again in tap water. Sections were then stained with eosin (Fisher Scientific, Pittsburgh, PA) for 1 min and washed 3 times in clean 100% ethanol. The sections were cleared with xylene and mounted in the xylene-based mounting medium Cytoseal.
Immunostaining.
For immunostaining, 10-μm cryostat-cut frozen muscle sections were fixed in 4% paraformaldehyde in PBS for 10 min, incubated in 0.1% Triton X-100 for 10 min, blocked in 10% goat serum plus 1% bovine serum albumin (BSA) in PBS at room temperature for 1 h, and incubated overnight at 4°C with one of the following antibodies: anti-Wnt10b, anti-Wnt16, or anti-PARK2 (Pierce Thermo Scientific, Rockford, IL), anti-CTGF, anti-NotchR1, anti-Jagged-1, anti-Jagged-2, anti-β catenin, anti-Wnt1, anti-Wnt3a, anti-Frizzled6, anti-Frizzled7, or anti-Dll1 (Abcam, Cambridge, MA), antiparkin or anti-NotchR1 (Novus Biologicals, Littleton, CO), cleaved NotchR1 (Val1744) monoclonal antibody (Cell Signaling Technology, Danvers, MA), or anti-Cre antibody (Novagen, Madison, WI). An α dystroglycan antibody (IIH6) was purchased from EMD Millipore (Temecula, CA). A β dystroglycan antibody (43DAG) was purchased from Leica (Buffalo Grove, IL). Laminin α2 antibody was purchased from Sigma (St. Louis, MO). Anti-Pax7 antibody was a generous gift from Michael Rudnicki (Ottawa Health Research Institute). Sections were incubated with Cy2- or Cy3-conjugated goat anti-mouse or goat anti-rabbit secondary antibody (Jackson ImmunoResearch, West Grove, PA) and sometimes costained with Cy3-conjugated α bungarotoxin, as indicated, for 1 h at room temperature and then were mounted using ProLong Gold Antifade mounting reagent (Invitrogen). For Pax7-BrdU costaining, Pax7 staining was followed by fixation in formalin and then by BrdU staining. For whole-mount staining, diaphragm muscles were dissected and fixed in 2% paraformaldehyde and then 2% paraformaldehyde with 0.1% Triton X-100. Muscles were then costained with anti-Neurofilament 200 (Sigma, St. Louis, MO) and anti-synaptophysin (Pierce Thermo Scientific, Rockford, IL), using antibodies made in the same species, followed by an appropriate Cy2-conjugated secondary antibody and rhodamine-conjugated α-bungarotoxin as previously described (82). Neuromuscular junctions were imaged with a Zeiss LSM 710 confocal laser scanning microscope, using the 63× objective, and nerve terminal-AChR overlap and AChR fragmentation were assessed on digitized images of individual NMJs by using NIH ImageJ and the methodology of Lovering and colleagues (83). Fiber type staining was done using antibodies specific to type 1 (A4.840), type 2A (2F7), type 2X (6H1), and type 2B (10F5) fibers, purchased from the Developmental Studies Hybridoma Bank (Iowa City, IA), with laminin α2 counterstaining. Myosin ATPase staining at pH 4.3 was also done as previously described (84).
Quantification of skeletal myofiber diameters and central nuclei.
Quantification of myofiber diameters and central nuclei was done as previously described, using Zeiss AxioVision Rel.4.8 software (50). H&E-stained images taken at a magnification of ×20 were used for the calculations. Quantifications were done on 5 images for each muscle, and at least 4 animals were used for each genotype.
Western blotting.
Frozen muscle blocks were cut at 40 μm on a cryostat so that 800 μm to 1,100 μm was collected from each sample. Sections were incubated in 50 mM Tris, pH 6.8, 1 mM EDTA, 100 mM dithiothreitol (DTT), 2% SDS, and cOmplete protease inhibitors (diluted according to the manufacturer's instructions; Roche, Indianapolis, IN). Protein was quantitated using the RC DC protein assay (Bio-Rad, Hercules, CA). A fixed amount of 45 μg of protein was boiled for 5 min, separated in a NuPage 4 to 12% Bis-Tris or Bolt gel (Life Technologies, Grand Island, NY), and transferred to nitrocellulose. The membrane was blocked in 5% nonfat dry milk in Tris-buffered saline (50 mM Tris, 150 mM NaCl) containing 0.5% Tween 20 (TBST) and then probed with NotchR1 antibody (Upstate Biotechnology), cleaved Notch1 (Val1744) monoclonal antibody (Cell Signaling Technology, Danvers, MA), anti-Myc tag antibody (Abcam, Cambridge, MA), anti-Hes1 (Ab5702) antibody, anti-Hey1 (Ab5714) antibody (Millipore, Temecula, CA), anti-lamin B1 (Santa Cruz Biotechnology, Dallas, TX), anti-α dystroglycan (IIH6; Upstate Biotechnology, Lake Placid, NY), or anti-β dystroglycan (Leica, Buffalo Grove, IL). After washing, horseradish peroxidase-coupled secondary antibody was added, and blots were developed using the ECL chemiluminescence method (Lumigen, Southfield, MI) after further washing.
Grip strength and treadmill ambulation.
Mice were tested using a grip strength meter (Columbus Instruments) to assess their forelimb and hind-limb strength. Mice were tested once per day for a week, with 10 repetitions for the forelimbs and 10 repetitions for the hind limbs at each trial. To measure ambulation, the mice underwent a 20-min run on a horizontal treadmill (Treadmill Simplex II; Columbus Instruments). The mice ran for 5 min at 5 m/min, 5 min at 6 m/min, 5 min at 8 m/min, and 5 min at 9 m/min. The time that the mice remained on the treadmill, up to a total time of 20 min, was recorded.
Serum creatine kinase activity.
Blood was collected from the superficial temporal vein and allowed to clot for 1 h at 25°C. Clotted cells were centrifuged at 1,500 × g for 5 min, and serum was collected and analyzed without freezing. Creatine kinase activity assays were done using an enzyme-coupled absorbance assay kit (Creatine Kinase-SL; Sekisui Diagnostics, Lexington, MA) by following the manufacturer's instructions. Absorbance was measured at 340 nm every 30 s for 4 min at 25°C to calculate enzyme activity. All measurements were done in triplicate.
Cardiotoxin-induced muscle regeneration.
Young adult (2 months old) mice were used for all cardiotoxin experiments. Gastrocnemius and tibialis anterior muscles were injected with 10 μM cardiotoxin (from Naga mossambica mossambica; Sigma, St. Louis, MO) in 50 μl sterile PBS. Control gastrocnemius and tibialis anterior muscles were injected with an equivalent volume of sterile PBS alone. Mice were sacrificed by CO2 inhalation at 1, 4, 7, 14, or 28 days postinjection, after which muscles were harvested and snap-frozen in liquid nitrogen-cooled isopentane for subsequent histological and biochemical analyses.
BrdU pulsing and immunostaining.
BrdU (Sigma, St. Louis, MO) was dissolved in normal saline and injected intraperitoneally daily at a concentration of 50 mg/kg of body weight. The day after the final injection, mice were sacrificed and their muscles dissected and frozen in liquid nitrogen-cooled isopentane. Sections were fixed in ice-cold methanol, permeabilized in 1% Triton X-100 in PBS, incubated in 1 N HCl for 10 min on ice, incubated in 2 N HCl for 10 min at room temperature, and then incubated in 2 N HCl for 10 min at 37°C. The acid was neutralized by immersing the sections in 0.1 M borate buffer, pH 8.5, for 12 min at room temperature. After washing again in 1% Triton X-100 in PBS, the sections were blocked in 3% bovine serum albumin in PBS for 1 h at room temperature and then incubated overnight with anti-BrdU antibody (Abcam, Cambridge, MA). The sections were stained with Cy3-conjugated anti-rat secondary antibody (Jackson ImmunoResearch, West Grove, PA) and mounted using ProLong Gold antifade mounting reagent with DAPI (4′,6-diamidino-2-phenylindole) (Invitrogen).
Primary muscle cultures.
Gastrocnemius and quadriceps muscles from 3-month-old or 23-month-old wild-type mice were dissected, minced, and digested at 37°C in 5 mg/ml collagenase IV and 1.2 U/ml dispase (Worthington Biochemical Corporation, Lakewood, NJ) in PBS. After 30 min, the digestion was stopped with warm Dulbecco's modified Eagle's medium (DMEM) plus 10% heat-inactivated horse serum. The mixture was filtered through a 70-μm cell strainer and then centrifuged at 1,500 × g for 5 min at 4°C. Muscle cells were resuspended in DMEM containing 20% fetal calf serum (Life Technologies, Grand Island, NY), 4% chicken embryo extract (U.S. Biological, Salem, MA), 50 U/ml penicillin, and 50 μg/ml streptomycin. Cells were preplated on a plastic tissue culture dish for 40 min to remove fibroblasts. The medium was removed, and cells were plated on dishes coated with Matrigel (Corning, Corning, NY). Cells were incubated at 37°C and 5% CO2 for approximately 10 days, until they reached confluence. Half of the cells were collected in TRIzol for RNA extraction. The remaining cells were induced to fuse into myotubes by incubation in serum-poor medium (DMEM plus 2% horse serum, 50 U/ml penicillin, and 50 μg/ml streptomycin).
qRT-PCR.
Total RNA was isolated from frozen blocks of gastrocnemius muscle or from primary muscle cells by use of TRIzol reagent (Invitrogen, Carlsbad, CA). RNA was purified on a silica gel-based membrane (RNeasy; Qiagen, Germantown, MD). Relative transcription levels were assessed by semiquantitative real-time PCR (qRT-PCR) using the ΔΔCT method, with 18S rRNA as an internal reference (85). qRT-PCR measurements were compared to 18S rRNA in this and all subsequent instances, after first testing a group of marker genes (glyceraldehyde-3-phosphate dehydrogenase [GAPDH], β actin, and 18S rRNA genes) to determine the one with the smallest ΔCT changes between muscle genotypes and ages (not shown). A high-capacity cDNA archive kit (Applied Biosystems, Foster City, CA) was used to reverse transcribe RNA per the manufacturer's guidelines. Samples were subjected to real-time PCR in triplicate, using a TaqMan ABI 7500 sequence detection system (Applied Biosystems). Primer sets were purchased from Applied Biosystems, except for the Becn1 primer set, which was purchased from Bio-Rad.
Open field tests.
Ambulatory movements and rearing events were determined using the photobeam activity system (PAS; San Diego Instruments) open field test. All measurements were done in mouse behavior rooms at the same time of day, with a defined temperature, ambient noise, and ambient light. Each mouse was placed individually in a 16- by 16-in. clear acrylic chamber with photobeams running along its base, with 1-in. spacing, along the x and y axes. Ambulatory activity was recorded every time that an animal crossed from one square-inch region to another. “Peripheral movement” reflects beam crossing in the outermost 1-in.2 squares of the cage on any side, while “center movement” reflects all other cage regions. Movements were recorded in five 4-min sessions. Total recorded events for the entire 20 min were summed for each independent measure, with six total measures being taken per animal. Both ambulatory and fine movements were recorded. Ambulatory movements were defined as movements in which an animal crossed a single photobeam. Fine movements were recorded as photobeams crossed multiple times in sequence. Rearing events were also recorded, using software that specifically defines this pattern of behavior.
Muscle physiology.
Analysis of tetanic force in the EDL muscle or in strips of dissected diaphragm muscle was performed as previously described (86, 87). Muscles (EDL) or muscle strips (diaphragm) were isolated immediately after euthanasia and bathed in oxygenated Krebs-Henseleit solution (95% O2-5% CO2, 118 mM NaCl, 25 mM NaHCO3, 5 mM KCl, 1 mM KH2PO4, 2 mM CaCl2, 1 mM MgCl2, 5 mM glucose, pH 7.4) in a circulating bath. For diaphragm force and fatigue measures, small linear strips of dissected diaphragm muscle were suspended between a force transducer and a stimulator hook and superfused with Krebs-Henseleit solution at 37°C. Electrical stimulation was achieved by use of parallel platinum-iridium electrodes. Tetanic force was assessed by using tetanuses of a 600-ms duration at 250 Hz and a pulse width of 1 ms. For fatigue measures, muscle was first stretched until maximal twitches produced maximal force at 150 Hz, with a 10-min rest between intervals, after which a paired-pulse protocol was used wherein 100-Hz tetanuses were delivered over 500 ms every second for 1 min (for a total of 60 stimulations). After measurements, muscles were weighed and their cross-sectional areas calculated as previously described (86, 87). Isolated EDL muscles were tied to a force transducer and a linear servomotor. Twitch contractions were elicited at 30°C, and the muscle was stretched to its optimal length. Next, one to three tetanuses of a 500-ms duration, using 1-ms pulses at 150 Hz, were imposed on the muscle. This was followed by repeats of 10 eccentric contractions. For each repeat, the muscle was tetanized for 700 ms and stretched by 5% of its initial length during the last 200 ms of the tetanus. After stimulation was halted at 700 ms, the muscle was taken back to its original length in 200 ms. Between repeats, the muscle remained unstimulated for 2 min. After measurements, muscles were weighed and their cross-sectional areas calculated.
Microarray analysis.
Microarray chip analysis was done by the microarray core facility at Nationwide Children's Hospital, as previously described (88). Briefly, an Ovation biotin RNA amplification and labeling system (NuGen Technologies) was used to prepare amplified biotin-labeled double-stranded cDNA from total RNA. Quadriceps muscle RNAs were isolated from individual HSACre and HSACrePofut1FF mice at 2 months of age. For each microarray, cDNAs were hybridized to a 430 2.0 GeneChip array (Affymetrix). Hybridization was allowed to continue for 16 h at 45°C, followed by washing and staining in a Fluidics Station 450 instrument. GeneChip arrays were scanned in a GeneChip Scanner 3000 (Affymetrix), and CEL file generation from DAT files was performed with GeneChip operating software (GCOS). The probe set signals were generated with the robust multichip average (RMA) algorithm in ArrayAssist 3.4 (Stratagene) and used to determine differential gene expression by pairwise comparisons. Genes that were altered by a factor of 2 either way were sorted and used for further validation by qRT-PCR as described above.
RNA-seq.
RNA samples from isolated quadriceps muscles were used for RNA-seq. Following assessment of the quality of total RNA by use of an Agilent 2100 bioanalyzer and an RNA Nano Chip kit (Agilent Technologies, CA), RNA was treated with DNase, and 2.5 μg was subjected to rRNA digestion with a Ribo-Zero rRNA removal kit for human/mouse/rat (Illumina). To generate directional signals in the RNA-seq data, libraries were constructed from first-strand cDNAs by use of a ScriptSeq v2 RNA-seq library preparation kit (Epicentre Biotechnologies, WI). Briefly, 50 ng of rRNA-depleted RNA was fragmented and reverse transcribed using random primers containing a 5′ tagging sequence, followed by 3′-end tagging with a terminus-tagging oligonucleotide to yield dually tagged, single-stranded cDNA. Following purification by a magnetic bead-based approach, the dually tagged cDNA was amplified by limit-cycle PCR, using primer pairs that anneal to tagging sequences and add adaptor sequences required for sequencing cluster generation. Amplified RNA-seq libraries were purified using the AMPure XP system (Beckman Coulter). The quality of libraries was determined by use of an Agilent 2200 Tapestation using high-sensitivity D1000 screen tape and quantified by use of a Qubit fluorometer with a dsDNA BR assay (Invitrogen, Thermo Fisher Scientific). Paired-end 150-bp sequence reads were generated using the Illumina HiSeq 4000 platform.
On average, 87 million paired-end 150-bp RNA-seq reads were generated for each sample (the range was 80 to 98 million). Each sample was aligned to the GRCm38.p4 assembly of the mouse reference from NCBI by using version 2.5.1b of the RNA-seq aligner STAR (http://bioinformatics.oxfordjournals.org/content/29/1/15). Transcript features were identified from the GFF file provided with the GRCh38.p5 assembly from NCBI, and raw coverage counts were calculated using HTSeq (http://www-huber.embl.de/users/anders/HTSeq/doc/count.html). The raw RNA-seq gene expression data were normalized and postalignment statistical analyses performed using DESeq2 (http://genomebiology.com/2014/15/12/550) and custom analysis scripts written in R. Comparisons of gene expression and associated statistical analyses were performed for different conditions of interest, using the normalized read counts. All fold change values are expressed as the value for test condition/value for control condition, where values of <1 are denoted as the negative of the inverse (note that there will be no fold change values between −1 and 1 and that fold changes of 1 and −1 represent the same value). Transcripts were considered significantly differentially expressed by using a 5% false discovery rate (DESeq2 adjusted P value of ≤0.05) and a fold change cutoff of 2 between the control and test samples.
Electroporation of Hes1 promoter-GFP reporter into the sternomastoid muscle and confocal microscopy.
Adult female non-Swiss albino mice (∼25 g) were anesthetized with an intraperitoneal injection of a mixture of 80 mg/kg ketamine and 20 mg/kg xylazine. The sternomastoid muscle was surgically exposed, and a plasmid solution containing 10 μg of plasmid Hes1Promoter-GFP (a gift from Susan Cole, Ohio State University) was layered over the muscle surface as described previously (89, 90). This plasmid was modified to insert two copies of the simian virus 40 (SV40) enhancer at the 5′ end of the Hes1 promoter. Briefly, gold electrodes were placed parallel to the muscle fibers on either side of the muscle, and eight monopolar square-wave pulses were applied perpendicularly to the long axis of the muscle. Following electroporation, the mouse was sutured and allowed to recover. Six days later, the animal was reanesthetized, and BTX-Alexa Fluor 594 was added to the sternomastoid muscle to label AChRs (1 h). The animal was then perfused transcardially with 2% paraformaldehyde, and the sternomastoid muscle was removed, mounted in DAPI-Fluoromount G to label nuclei, scanned, and imaged with a confocal microscope (Leica SP5). The z-stacks were then collapsed and the contrast adjusted with Photoshop.
Injection of skeletal muscles with rAAVrh74-MHCK7-NICD.
Six- to 7-week-old wild-type (C57BL/6) or HSACrePofut1FF mice were injected in the left hind-limb muscles (TA, Gastroc, and Quad) with rAAVrh74-MHCK7-NICD, produced by the Viral Vector Core at Nationwide Children's Hospital. This vector packages a cDNA that encodes only the cleaved NotchR intracellular domain (NICD) of mouse NotchR1, which is normally cleaved off by γ secretase upon ligand binding (11). The MHCK7 promoter is a skeletal muscle- and heart-specific promoter designed by Hauschka and colleagues (62), while rAAVrh74, or rhesus serotype 74, is a viral AAV capsid similar to rAAV8 (91). The TA muscle was injected with 1 × 10¹¹ vector genomes in 25 μl, while the Gastroc and Quad muscles were each injected with 2 × 10¹¹ vector genomes in 50 μl. An equivalent volume of sterile PBS was injected into the contralateral muscle as a control.
Statistics.
Significant differences between two individual samples were analyzed using Student's two-tailed unpaired t test. Comparisons between more than two groups were done by analysis of variance (ANOVA) with post hoc Tukey's test.
Accession number(s).
The microarray data for the HSACre and HSACrePofut1FF samples were deposited in the Gene Expression Omnibus (GEO) database under accession number GSE80145. RNASeq data were submitted under accession number GSE94768.
ACKNOWLEDGMENTS
We thank Pamela Stanley (Albert Einstein College of Medicine) for the generous gift of Pofut1FF and Pofut1F/− mice, Michael Rudnicki (Ottawa Health Research Institute) for the Pax7 antibody, and Susan Cole (Ohio State University) for the Hes1Promoter-GFP plasmid. We give special thanks to Bethannie Golden and Guohong Shao (Nationwide Children's Hospital) for technical support.
This work was supported by NIH grants R21 AR060412 and R01 AR049722 to P.T.M.
We have no conflicts to report with regard to publication of this work.
REFERENCES
- 1.Welle S. 2002. Cellular and molecular basis of age-related sarcopenia. Can J Appl Physiol 27:19–41. doi: 10.1139/h02-002. [DOI] [PubMed] [Google Scholar]
- 2.Ryall JG, Schertzer JD, Lynch GS. 2008. Cellular and molecular mechanisms underlying age-related skeletal muscle wasting and weakness. Biogerontology 9:213–228. doi: 10.1007/s10522-008-9131-0. [DOI] [PubMed] [Google Scholar]
- 3.Hepple RT. 2012. Muscle atrophy is not always sarcopenia. J Appl Physiol 113:677–679. doi: 10.1152/japplphysiol.00304.2012. [DOI] [PubMed] [Google Scholar]
- 4.Thompson LV. 2002. Skeletal muscle adaptations with age, inactivity, and therapeutic exercise. J Orthop Sports Phys Ther 32:44–57. doi: 10.2519/jospt.2002.32.2.44. [DOI] [PubMed] [Google Scholar]
- 5.Warner HR, Sierra F. 2003. Models of accelerated ageing can be informative about the molecular mechanisms of ageing and/or age-related pathology. Mech Ageing Dev 124:581–587. doi: 10.1016/S0047-6374(03)00008-3. [DOI] [PubMed] [Google Scholar]
- 6.Conboy IM, Rando TA. 2005. Aging, stem cells and tissue regeneration: lessons from muscle. Cell Cycle 4:407–410. doi: 10.4161/cc.4.3.1518. [DOI] [PubMed] [Google Scholar]
- 7.Conboy IM, Conboy MJ, Smythe GM, Rando TA. 2003. Notch-mediated restoration of regenerative potential to aged muscle. Science 302:1575–1577. doi: 10.1126/science.1087573. [DOI] [PubMed] [Google Scholar]
- 8.Carlson ME, Hsu M, Conboy IM. 2008. Imbalance between pSmad3 and Notch induces CDK inhibitors in old muscle stem cells. Nature 454:528–532. doi: 10.1038/nature07034. [DOI] [PMC free article] [PubMed] [Google Scholar]
- 9.Carey KA, Farnfield MM, Tarquinio SD, Cameron-Smith D. 2007. Impaired expression of Notch signaling genes in aged human skeletal muscle. J Gerontol A Biol Sci Med Sci 62:9–17. doi: 10.1093/gerona/62.1.9. [DOI] [PubMed] [Google Scholar]
- 10.Luo D, Renault VM, Rando TA. 2005. The regulation of Notch signaling in muscle stem cell activation and postnatal myogenesis. Semin Cell Dev Biol 16:612–622. doi: 10.1016/j.semcdb.2005.07.002. [DOI] [PubMed] [Google Scholar]
- 11.Takeuchi H, Haltiwanger RS. 2014. Significance of glycosylation in Notch signaling. Biochem Biophys Res Commun 453:235–242. doi: 10.1016/j.bbrc.2014.05.115. [DOI] [PMC free article] [PubMed] [Google Scholar]
- 12.Stahl M, Uemura K, Ge C, Shi S, Tashima Y, Stanley P. 2008. Roles of Pofut1 and O-fucose in mammalian Notch signaling. J Biol Chem 283:13638–13651. doi: 10.1074/jbc.M802027200. [DOI] [PMC free article] [PubMed] [Google Scholar]
- 13.Okajima T, Irvine KD. 2002. Regulation of notch signaling by O-linked fucose. Cell 111:893–904. doi: 10.1016/S0092-8674(02)01114-5. [DOI] [PubMed] [Google Scholar]
- 14.Okajima T, Xu A, Irvine KD. 2003. Modulation of notch-ligand binding by protein O-fucosyltransferase 1 and fringe. J Biol Chem 278:42340–42345. doi: 10.1074/jbc.M308687200. [DOI] [PubMed] [Google Scholar]
- 15.Rampal R, Li AS, Moloney DJ, Georgiou SA, Luther KB, Nita-Lazar A, Haltiwanger RS. 2005. Lunatic fringe, manic fringe, and radical fringe recognize similar specificity determinants in O-fucosylated epidermal growth factor-like repeats. J Biol Chem 280:42454–42463. doi: 10.1074/jbc.M509552200. [DOI] [PubMed] [Google Scholar]
- 16.Moloney DJ, Panin VM, Johnston SH, Chen J, Shao L, Wilson R, Wang Y, Stanley P, Irvine KD, Haltiwanger RS, Vogt TF. 2000. Fringe is a glycosyltransferase that modifies Notch. Nature 406:369–375. doi: 10.1038/35019000. [DOI] [PubMed] [Google Scholar]
- 17.Kakuda S, Haltiwanger RS. 2014. Analyzing the posttranslational modification status of Notch using mass spectrometry. Methods Mol Biol 1187:209–221. doi: 10.1007/978-1-4939-1139-4_16. [DOI] [PubMed] [Google Scholar]
- 18.Kim ML, Chandrasekharan K, Glass M, Shi S, Stahl MC, Kaspar B, Stanley P, Martin PT. 2008. O-fucosylation of muscle agrin determines its ability to cluster acetylcholine receptors. Mol Cell Neurosci 39:452–464. doi: 10.1016/j.mcn.2008.07.026. [DOI] [PMC free article] [PubMed] [Google Scholar]
- 19.Loriol C, Dupuy F, Rampal R, Dlugosz MA, Haltiwanger RS, Maftah A, Germot A. 2006. Molecular evolution of protein O-fucosyltransferase genes and splice variants. Glycobiology 16:736–747. doi: 10.1093/glycob/cwj124. [DOI] [PubMed] [Google Scholar]
- 20.Muller J, Rana NA, Serth K, Kakuda S, Haltiwanger RS, Gossler A. 2014. O-fucosylation of the notch ligand mDLL1 by POFUT1 is dispensable for ligand function. PLoS One 9:e88571. doi: 10.1371/journal.pone.0088571. [DOI] [PMC free article] [PubMed] [Google Scholar]
- 21.Cole SE, Levorse JM, Tilghman SM, Vogt TF. 2002. Clock regulatory elements control cyclic expression of Lunatic fringe during somitogenesis. Dev Cell 3:75–84. doi: 10.1016/S1534-5807(02)00212-5. [DOI] [PubMed] [Google Scholar]
- 22.Evrard YA, Lun Y, Aulehla A, Gan L, Johnson RL. 1998. Lunatic fringe is an essential mediator of somite segmentation and patterning. Nature 394:377–381. doi: 10.1038/28632. [DOI] [PubMed] [Google Scholar]
- 23.Serth K, Schuster-Gossler K, Kremmer E, Hansen B, Marohn-Kohn B, Gossler A. 2015. O-fucosylation of DLL3 is required for its function during somitogenesis. PLoS One 10:e0123776. doi: 10.1371/journal.pone.0123776. [DOI] [PMC free article] [PubMed] [Google Scholar]
- 24.Zhang N, Gridley T. 1998. Defects in somite formation in lunatic fringe-deficient mice. Nature 394:374–377. doi: 10.1038/28625. [DOI] [PubMed] [Google Scholar]
- 25.Shi S, Stahl M, Lu L, Stanley P. 2005. Canonical Notch signaling is dispensable for early cell fate specifications in mammals. Mol Cell Biol 25:9503–9508. doi: 10.1128/MCB.25.21.9503-9508.2005. [DOI] [PMC free article] [PubMed] [Google Scholar]
- 26.Conboy IM, Rando TA. 2002. The regulation of Notch signaling controls satellite cell activation and cell fate determination in postnatal myogenesis. Dev Cell 3:397–409. doi: 10.1016/S1534-5807(02)00254-X. [DOI] [PubMed] [Google Scholar]
- 27.Carlson ME, Conboy IM. 2007. Loss of stem cell regenerative capacity within aged niches. Aging Cell 6:371–382. doi: 10.1111/j.1474-9726.2007.00286.x. [DOI] [PMC free article] [PubMed] [Google Scholar]
- 28.Conboy IM, Conboy MJ, Wagers AJ, Girma ER, Weissman IL, Rando TA. 2005. Rejuvenation of aged progenitor cells by exposure to a young systemic environment. Nature 433:760–764. doi: 10.1038/nature03260. [DOI] [PubMed] [Google Scholar]
- 29.Brack AS, Conboy IM, Conboy MJ, Shen J, Rando TA. 2008. A temporal switch from notch to Wnt signaling in muscle stem cells is necessary for normal adult myogenesis. Cell Stem Cell 2:50–59. doi: 10.1016/j.stem.2007.10.006. [DOI] [PubMed] [Google Scholar]
- 30.Carlson ME, Conboy IM. 2007. Regulating the Notch pathway in embryonic, adult and old stem cells. Curr Opin Pharmacol 7:303–309. doi: 10.1016/j.coph.2007.02.004. [DOI] [PubMed] [Google Scholar]
- 31.Le Grand F, Jones AE, Seale V, Scime A, Rudnicki MA. 2009. Wnt7a activates the planar cell polarity pathway to drive the symmetric expansion of satellite stem cells. Cell Stem Cell 4:535–547. doi: 10.1016/j.stem.2009.03.013. [DOI] [PMC free article] [PubMed] [Google Scholar]
- 32.Schuster-Gossler K, Cordes R, Gossler A. 2007. Premature myogenic differentiation and depletion of progenitor cells cause severe muscle hypotrophy in Delta1 mutants. Proc Natl Acad Sci U S A 104:537–542. doi: 10.1073/pnas.0608281104. [DOI] [PMC free article] [PubMed] [Google Scholar]
- 33.Luo Y, Nita-Lazar A, Haltiwanger RS. 2006. Two distinct pathways for O-fucosylation of epidermal growth factor-like or thrombospondin type 1 repeats. J Biol Chem 281:9385–9392. doi: 10.1074/jbc.M511974200. [DOI] [PubMed] [Google Scholar]
- 34.Luo Y, Koles K, Vorndam W, Haltiwanger RS, Panin VM. 2006. Protein O-fucosyltransferase 2 adds O-fucose to thrombospondin type 1 repeats. J Biol Chem 281:9393–9399. doi: 10.1074/jbc.M511975200. [DOI] [PubMed] [Google Scholar]
- 35.Muscat GE, Kedes L. 1987. Multiple 5′-flanking regions of the human alpha-skeletal actin gene synergistically modulate muscle-specific expression. Mol Cell Biol 7:4089–4099. doi: 10.1128/MCB.7.11.4089. [DOI] [PMC free article] [PubMed] [Google Scholar]
- 36.Brennan KJ, Hardeman EC. 1993. Quantitative analysis of the human alpha-skeletal actin gene in transgenic mice. J Biol Chem 268:719–725. [PubMed] [Google Scholar]
- 37.Stuart CA, Stone WL, Howell ME, Brannon MF, Hall HK, Gibson AL, Stone MH. 2016. Myosin content of individual human muscle fibers isolated by laser capture microdissection. Am J Physiol Cell Physiol 310:C381–C389. doi: 10.1152/ajpcell.00317.2015. [DOI] [PMC free article] [PubMed] [Google Scholar]
- 38.Sheng JJ, Jin JP. 2016. TNNI1, TNNI2 and TNNI3: evolution, regulation, and protein structure-function relationships. Gene 576:385–394. doi: 10.1016/j.gene.2015.10.052. [DOI] [PMC free article] [PubMed] [Google Scholar]
- 39.Conley CA. 2001. Leiomodin and tropomodulin in smooth muscle. Am J Physiol Cell Physiol 280:C1645–C1656. [DOI] [PubMed] [Google Scholar]
- 40.Kee AJ, Hardeman EC. 2008. Tropomyosins in skeletal muscle diseases. Adv Exp Med Biol 644:143–157. doi: 10.1007/978-0-387-85766-4_12. [DOI] [PubMed] [Google Scholar]
- 41.Katsube K, Sakamoto K, Tamamura Y, Yamaguchi A. 2009. Role of CCN, a vertebrate specific gene family, in development. Dev Growth Differ 51:55–67. doi: 10.1111/j.1440-169X.2009.01077.x. [DOI] [PubMed] [Google Scholar]
- 42.Hamacher-Brady A, Brady NR. 2016. Mitophagy programs: mechanisms and physiological implications of mitochondrial targeting by autophagy. Cell Mol Life Sci 73:775–795. doi: 10.1007/s00018-015-2087-8. [DOI] [PMC free article] [PubMed] [Google Scholar]
- 43.Noda N, Honma S, Ohmiya Y. 2011. Hes1 is required for contact inhibition of cell proliferation in 3T3-L1 preadipocytes. Genes Cells 16:704–713. doi: 10.1111/j.1365-2443.2011.01518.x. [DOI] [PubMed] [Google Scholar]
- 44.Alqudah MA, Agarwal S, Al-Keilani MS, Sibenaller ZA, Ryken TC, Assem M. 2013. NOTCH3 is a prognostic factor that promotes glioma cell proliferation, migration and invasion via activation of CCND1 and EGFR. PLoS One 8:e77299. doi: 10.1371/journal.pone.0077299. [DOI] [PMC free article] [PubMed] [Google Scholar]
- 45.Gopalakrishnan N, Saravanakumar M, Madankumar P, Thiyagu M, Devaraj H. 2014. Colocalization of beta-catenin with Notch intracellular domain in colon cancer: a possible role of Notch1 signaling in activation of CyclinD1-mediated cell proliferation. Mol Cell Biochem 396:281–293. doi: 10.1007/s11010-014-2163-7. [DOI] [PubMed] [Google Scholar]
- 46.Letellier E, Haan S. 2016. SOCS2: physiological and pathological functions. Front Biosci 8:189–204. doi: 10.2741/e760. [DOI] [PubMed] [Google Scholar]
- 47.Golan T, Yaniv A, Bafico A, Liu G, Gazit A. 2004. The human Frizzled 6 (HFz6) acts as a negative regulator of the canonical Wnt beta-catenin signaling cascade. J Biol Chem 279:14879–14888. doi: 10.1074/jbc.M306421200. [DOI] [PubMed] [Google Scholar]
- 48.Wit JM, Walenkamp MJ. 2013. Role of insulin-like growth factors in growth, development and feeding. World Rev Nutr Diet 106:60–65. doi: 10.1159/000342546. [DOI] [PubMed] [Google Scholar]
- 49.Schiaffino S, Reggiani C. 2011. Fiber types in mammalian skeletal muscles. Physiol Rev 91:1447–1531. doi: 10.1152/physrev.00031.2010. [DOI] [PubMed] [Google Scholar]
- 50.Singhal N, Martin PT. 2015. A role for Galgt1 in skeletal muscle regeneration. Skelet Muscle 5:3. doi: 10.1186/s13395-014-0028-0. [DOI] [PMC free article] [PubMed] [Google Scholar]
- 51.Wang YX, Rudnicki MA. 2011. Satellite cells, the engines of muscle repair. Nat Rev Mol Cell Biol 13:127–133. doi: 10.1038/nrm3265. [DOI] [PubMed] [Google Scholar]
- 52.Patton BL, Connoll AM, Martin PT, Cunningham JM, Mehta S, Pestronk A, Miner JH, Sanes JR. 1999. Distribution of ten laminin chains in dystrophic and regenerating muscles. Neuromuscul Disord 9:423–433. doi: 10.1016/S0960-8966(99)00033-4. [DOI] [PubMed] [Google Scholar]
- 53.Covault J, Merlie JP, Goridis C, Sanes JR. 1986. Molecular forms of N-CAM and its RNA in developing and denervated skeletal muscle. J Cell Biol 102:731–739. doi: 10.1083/jcb.102.3.731. [DOI] [PMC free article] [PubMed] [Google Scholar]
- 54.Sanes JR, Lichtman JW. 2001. Induction, assembly, maturation and maintenance of a postsynaptic apparatus. Nat Rev Neurosci 2:791–805. [DOI] [PubMed] [Google Scholar]
- 55.Compton AG, Cooper ST, Hill PM, Yang N, Froehner SC, North KN. 2005. The syntrophin-dystrobrevin subcomplex in human neuromuscular disorders. J Neuropathol Exp Neurol 64:350–361. doi: 10.1093/jnen/64.4.350. [DOI] [PubMed] [Google Scholar]
- 56.Kim MS, Fielitz J, McAnally J, Shelton JM, Lemon DD, McKinsey TA, Richardson JA, Bassel-Duby R, Olson EN. 2008. Protein kinase D1 stimulates MEF2 activity in skeletal muscle and enhances muscle performance. Mol Cell Biol 28:3600–3609. doi: 10.1128/MCB.00189-08. [DOI] [PMC free article] [PubMed] [Google Scholar]
- 57.Hamalainen N, Pette D. 1993. The histochemical profiles of fast fiber types IIB, IID, and IIA in skeletal muscles of mouse, rat, and rabbit. J Histochem Cytochem 41:733–743. doi: 10.1177/41.5.8468455. [DOI] [PubMed] [Google Scholar]
- 58.Nguyen HH, Jayasinha V, Xia B, Hoyte K, Martin PT. 2002. Overexpression of the cytotoxic T cell GalNAc transferase in skeletal muscle inhibits muscular dystrophy in mdx mice. Proc Natl Acad Sci U S A 99:5616–5621. doi: 10.1073/pnas.082613599. [DOI] [PMC free article] [PubMed] [Google Scholar]
- 59.Singhal N, Martin PT. 2011. Role of extracellular matrix proteins and their receptors in the development of the vertebrate neuromuscular junction. Dev Neurobiol 71:982–1005. doi: 10.1002/dneu.20953. [DOI] [PMC free article] [PubMed] [Google Scholar]
- 60.Valdez G, Tapia JC, Lichtman JW, Fox MA, Sanes JR. 2012. Shared resistance to aging and ALS in neuromuscular junctions of specific muscles. PLoS One 7:e34640. doi: 10.1371/journal.pone.0034640. [DOI] [PMC free article] [PubMed] [Google Scholar]
- 61.Li Y, Lee Y, Thompson WJ. 2011. Changes in aging mouse neuromuscular junctions are explained by degeneration and regeneration of muscle fiber segments at the synapse. J Neurosci 31:14910–14919. doi: 10.1523/JNEUROSCI.3590-11.2011. [DOI] [PMC free article] [PubMed] [Google Scholar]
- 62.Salva MZ, Himeda CL, Tai PW, Nishiuchi E, Gregorevic P, Allen JM, Finn EE, Nguyen QG, Blankinship MJ, Meuse L, Chamberlain JS, Hauschka SD. 2007. Design of tissue-specific regulatory cassettes for high-level rAAV-mediated expression in skeletal and cardiac muscle. Mol Ther 15:320–329. doi: 10.1038/sj.mt.6300027. [DOI] [PubMed] [Google Scholar]
- 63.Kitamura T, Kitamura YI, Funahashi Y, Shawber CJ, Castrillon DH, Kollipara R, DePinho RA, Kitajewski J, Accili D. 2007. A Foxo/Notch pathway controls myogenic differentiation and fiber type specification. J Clin Invest 117:2477–2485. doi: 10.1172/JCI32054. [DOI] [PMC free article] [PubMed] [Google Scholar]
- 64.Barrantes IB, Elia AJ, Wunsch K, Hrabe de Angelis MH, Mak TW, Rossant J, Conlon RA, Gossler A, de la Pompa JL. 1999. Interaction between Notch signalling and Lunatic fringe during somite boundary formation in the mouse. Curr Biol 9:470–480. doi: 10.1016/S0960-9822(99)80212-7. [DOI] [PubMed] [Google Scholar]
- 65.Purves-Smith FM, Sgarioto N, Hepple RT. 2014. Fiber typing in aging muscle. Exerc Sport Sci Rev 42:45–52. doi: 10.1249/JES.0000000000000012. [DOI] [PubMed] [Google Scholar]
- 66.Servian-Morilla E, Takeuchi H, Lee TV, Clarimon J, Mavillard F, Area-Gomez E, Rivas E, Nieto-Gonzalez JL, Rivero MC, Cabrera-Serrano M, Gomez-Sanchez L, Martinez-Lopez JA, Estrada B, Marquez C, Morgado Y, Suarez-Calvet X, Pita G, Bigot A, Gallardo E, Fernandez-Chacon R, Hirano M, Haltiwanger RS, Jafar-Nejad H, Paradas C. 2016. A POGLUT1 mutation causes a muscular dystrophy with reduced Notch signaling and satellite cell loss. EMBO Mol Med 8:1289–1309. doi: 10.15252/emmm.201505815. [DOI] [PMC free article] [PubMed] [Google Scholar]
- 67.Yoshida-Moriguchi T, Campbell KP. 2015. Matriglycan: a novel polysaccharide that links dystroglycan to the basement membrane. Glycobiology 25:702–713. doi: 10.1093/glycob/cwv021. [DOI] [PMC free article] [PubMed] [Google Scholar]
- 68.Ibraghimov-Beskrovnaya O, Ervasti JM, Leveille CJ, Slaughter CA, Sernett SW, Campbell KP. 1992. Primary structure of dystrophin-associated glycoproteins linking dystrophin to the extracellular matrix. Nature 355:696–702. doi: 10.1038/355696a0. [DOI] [PubMed] [Google Scholar]
- 69.Vieira NM, Elvers I, Alexander MS, Moreira YB, Eran A, Gomes JP, Marshall JL, Karlsson EK, Verjovski-Almeida S, Lindblad-Toh K, Kunkel LM, Zatz M. 2015. Jagged 1 rescues the Duchenne muscular dystrophy phenotype. Cell 163:1204–1213. doi: 10.1016/j.cell.2015.10.049. [DOI] [PMC free article] [PubMed] [Google Scholar]
- 70.Vandervoort AA. 2002. Aging of the human neuromuscular system. Muscle Nerve 25:17–25. doi: 10.1002/mus.1215. [DOI] [PubMed] [Google Scholar]
- 71.Akaaboune M, Allinquant B, Farza H, Roy K, Magoul R, Fiszman M, Festoff BW, Hantai D. 2000. Developmental regulation of amyloid precursor protein at the neuromuscular junction in mouse skeletal muscle. Mol Cell Neurosci 15:355–367. doi: 10.1006/mcne.2000.0834. [DOI] [PubMed] [Google Scholar]
- 72.Sakuma K, Nakao R, Yamasa Y, Yasuhara M. 2006. Normal distribution of presenilin-1 and nicastrin in skeletal muscle and the differential responses of these proteins after denervation. Biochim Biophys Acta 1760:980–987. doi: 10.1016/j.bbagen.2006.02.006. [DOI] [PubMed] [Google Scholar]
- 73.Li XM, Dong XP, Luo SW, Zhang B, Lee DH, Ting AK, Neiswender H, Kim CH, Carpenter-Hyland E, Gao TM, Xiong WC, Mei L. 2008. Retrograde regulation of motoneuron differentiation by muscle beta-catenin. Nat Neurosci 11:262–268. doi: 10.1038/nn2053. [DOI] [PubMed] [Google Scholar]
- 74.Ivkovic S, Yoon BS, Popoff SN, Safadi FF, Libuda DE, Stephenson RC, Daluiski A, Lyons KM. 2003. Connective tissue growth factor coordinates chondrogenesis and angiogenesis during skeletal development. Development 130:2779–2791. doi: 10.1242/dev.00505. [DOI] [PMC free article] [PubMed] [Google Scholar]
- 75.Kelly SS, Robbins N. 1983. Progression of age changes in synaptic transmission at mouse neuromuscular junctions. J Physiol 343:375–383. doi: 10.1113/jphysiol.1983.sp014898. [DOI] [PMC free article] [PubMed] [Google Scholar]
- 76.Fahim MA, Holley JA, Robbins N. 1983. Scanning and light microscopic study of age changes at a neuromuscular junction in the mouse. J Neurocytol 12:13–25. doi: 10.1007/BF01148085. [DOI] [PubMed] [Google Scholar]
- 77.Samuel MA, Valdez G, Tapia JC, Lichtman JW, Sanes JR. 2012. Agrin and synaptic laminin are required to maintain adult neuromuscular junctions. PLoS One 7:e46663. doi: 10.1371/journal.pone.0046663. [DOI] [PMC free article] [PubMed] [Google Scholar]
- 78.Drey M, Sieber CC, Bauer JM, Uter W, Dahinden P, Fariello RG, Vrijbloed JW. 2013. C-terminal Agrin fragment as a potential marker for sarcopenia caused by degeneration of the neuromuscular junction. Exp Gerontol 48:76–80. doi: 10.1016/j.exger.2012.05.021. [DOI] [PubMed] [Google Scholar]
- 79.Latvanlehto A, Fox MA, Sormunen R, Tu H, Oikarainen T, Koski A, Naumenko N, Shakirzyanova A, Kallio M, Ilves M, Giniatullin R, Sanes JR, Pihlajaniemi T. 2010. Muscle-derived collagen XIII regulates maturation of the skeletal neuromuscular junction. J Neurosci 30:12230–12241. doi: 10.1523/JNEUROSCI.5518-09.2010. [DOI] [PMC free article] [PubMed] [Google Scholar]
- 80.Shi S, Stanley P. 2003. Protein O-fucosyltransferase 1 is an essential component of Notch signaling pathways. Proc Natl Acad Sci U S A 100:5234–5239. doi: 10.1073/pnas.0831126100. [DOI] [PMC free article] [PubMed] [Google Scholar]
- 81.Yao D, Huang Y, Huang X, Wang W, Yan Q, Wei L, Xin W, Gerson S, Stanley P, Lowe JB, Zhou L. 2011. Protein O-fucosyltransferase 1 (Pofut1) regulates lymphoid and myeloid homeostasis through modulation of Notch receptor ligand interactions. Blood 117:5652–5662. doi: 10.1182/blood-2010-12-326074. [DOI] [PMC free article] [PubMed] [Google Scholar]
- 82.Singhal N, Xu R, Martin PT. 2012. Distinct contributions of Galgt1 and Galgt2 to carbohydrate expression and function at the mouse neuromuscular junction. Mol Cell Neurosci 51:112–126. doi: 10.1016/j.mcn.2012.08.014. [DOI] [PMC free article] [PubMed] [Google Scholar]
- 83.Pratt SJ, Valencia AP, Le GK, Shah SB, Lovering RM. 2015. Pre- and postsynaptic changes in the neuromuscular junction in dystrophic mice. Front Physiol 6:252. doi: 10.3389/fphys.2015.00252. [DOI] [PMC free article] [PubMed] [Google Scholar]
- 84.Xia B, Hoyte K, Kammesheidt A, Deerinck T, Ellisman M, Martin PT. 2002. Overexpression of the CT GalNAc transferase in skeletal muscle alters myofiber growth, neuromuscular structure, and laminin expression. Dev Biol 242:58–73. doi: 10.1006/dbio.2001.0530. [DOI] [PubMed] [Google Scholar]
- 85.Livak KJ, Schmittgen TD. 2001. Analysis of relative gene expression data using real-time quantitative PCR and the 2(−Delta Delta C(T)) method. Methods 25:402–408. doi: 10.1006/meth.2001.1262. [DOI] [PubMed] [Google Scholar]
- 86.Martin PT, Xu R, Rodino-Klapac LR, Oglesbay E, Camboni M, Montgomery CL, Shontz K, Chicoine LG, Clark KR, Sahenk Z, Mendell JR, Janssen PM. 2009. Overexpression of Galgt2 in skeletal muscle prevents injury resulting from eccentric contractions in both mdx and wild-type mice. Am J Physiol Cell Physiol 296:C476–C488. doi: 10.1152/ajpcell.00456.2008. [DOI] [PMC free article] [PubMed] [Google Scholar]
- 87.Murray JD, Canan BD, Martin CD, Stangland JE, Rastogi N, Rafael-Fortney JA, Janssen PM. 2012. The force-temperature relationship in healthy and dystrophic mouse diaphragm; implications for translational study design. Front Physiol 3:422. doi: 10.3389/fphys.2012.00422. [DOI] [PMC free article] [PubMed] [Google Scholar]
- 88.Chandrasekharan K, Yoon JH, Xu Y, deVries S, Camboni M, Janssen PM, Varki A, Martin PT. 2010. A human-specific deletion in mouse Cmah increases disease severity in the mdx model of Duchenne muscular dystrophy. Sci Transl Med 2:42ra54. doi: 10.1126/scitranslmed.3000692. [DOI] [PMC free article] [PubMed] [Google Scholar]
- 89.Bruneau EG, Akaaboune M. 2010. Dynamics of the rapsyn scaffolding protein at the neuromuscular junction of live mice. J Neurosci 30:614–619. doi: 10.1523/JNEUROSCI.4595-09.2010. [DOI] [PMC free article] [PubMed] [Google Scholar]
- 90.Martinez-Pena YVI, Aittaleb M, Chen PJ, Akaaboune M. 2015. The knockdown of alphakap alters the postsynaptic apparatus of neuromuscular junctions in living mice. J Neurosci 35:5118–5127. doi: 10.1523/JNEUROSCI.3951-14.2015. [DOI] [PMC free article] [PubMed] [Google Scholar]
- 91.Chicoine LG, Rodino-Klapac LR, Shao G, Xu R, Bremer WG, Camboni M, Golden B, Montgomery CL, Shontz K, Heller KN, Griffin DA, Lewis S, Coley BD, Walker CM, Clark KR, Sahenk Z, Mendell JR, Martin PT. 2014. Vascular delivery of rAAVrh74.MCK.GALGT2 to the gastrocnemius muscle of the rhesus macaque stimulates the expression of dystrophin and laminin alpha2 surrogates. Mol Ther 22:713–724. doi: 10.1038/mt.2013.246. [DOI] [PMC free article] [PubMed] [Google Scholar]


