Figure 6.

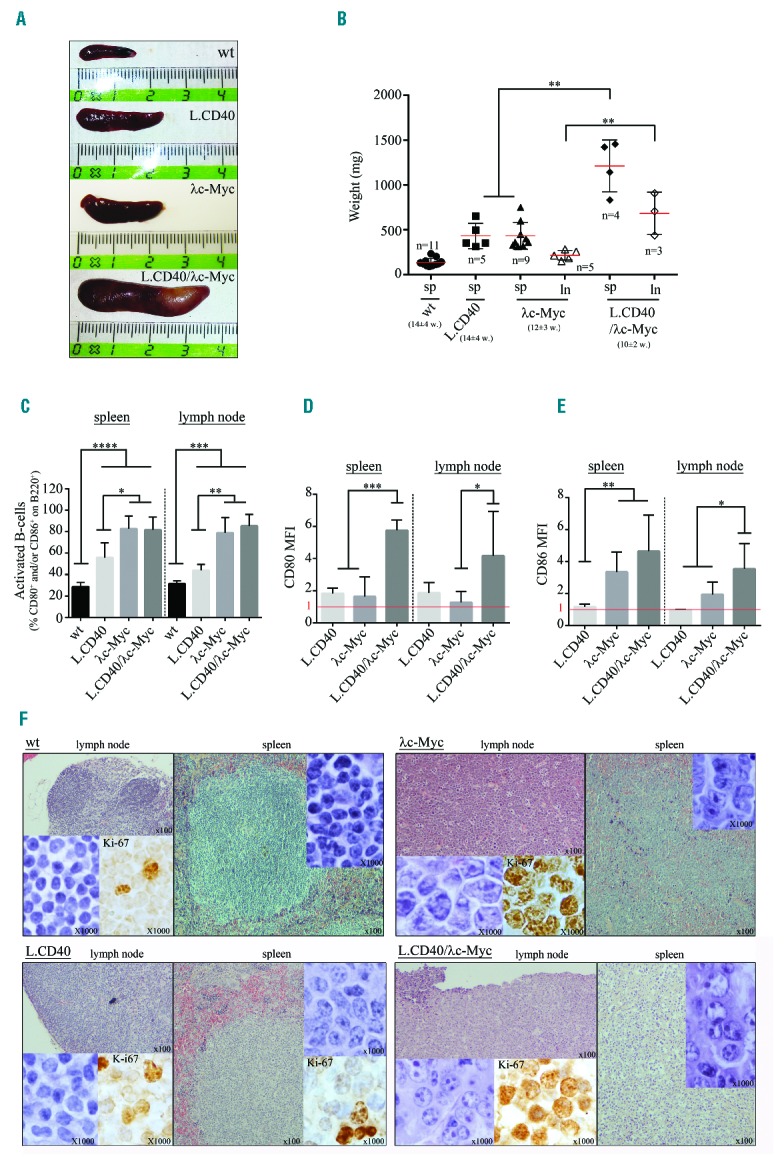
Phenotypic analysis of L.CD40/λc-Myc mice compared to wild-type (wt), L.CD40, and λc-Myc control mice. (A) Representative spleen size. (B) Scatter-plot of spleen (sp) and lymph node (ln) weights. For each group, number (n) and mean age of mice (w, week) are indicated. Data are shown as mean ± standard deviation (n=3–11 mice in each experiment group). Statistical significance was determined by Student’s t-test (**P<0.01). (C, D, and E) B220, CD80, and CD86 labeling from total splenocytes and lymph node cells. Histograms of activated B-cell percentages on B220+ cells i.e., percentage of CD80+ and/or CD86+ cells (C), mean fluorescent intensity (MFI) of CD80 (D) and CD86 (E) on B220 positive cells. MFI was normalized from wt mice (MFI=1 in red). Data are shown as mean ± standard deviation (n=3–11 mice in each experiment group). Statistical significance was determined by Student’s t-test (*P<0.05; **P<0.01; ***P<0.001; ****P<0.0001). (F) H&E and Ki-67 staining on lymph node and spleen sections.
